CoQ deficiency causes disruption of mitochondrial sulfide oxidation, a new pathomechanism associated with this syndrome
- PMID: 27856619
- PMCID: PMC5210161
- DOI: 10.15252/emmm.201606345
CoQ deficiency causes disruption of mitochondrial sulfide oxidation, a new pathomechanism associated with this syndrome
Abstract
Coenzyme Q (CoQ) is a key component of the mitochondrial respiratory chain, but it also has several other functions in the cellular metabolism. One of them is to function as an electron carrier in the reaction catalyzed by sulfide:quinone oxidoreductase (SQR), which catalyzes the first reaction in the hydrogen sulfide oxidation pathway. Therefore, SQR may be affected by CoQ deficiency. Using human skin fibroblasts and two mouse models with primary CoQ deficiency, we demonstrate that severe CoQ deficiency causes a reduction in SQR levels and activity, which leads to an alteration of mitochondrial sulfide metabolism. In cerebrum of Coq9R239X mice, the deficit in SQR induces an increase in thiosulfate sulfurtransferase and sulfite oxidase, as well as modifications in the levels of thiols. As a result, biosynthetic pathways of glutamate, serotonin, and catecholamines were altered in the cerebrum, and the blood pressure was reduced. Therefore, this study reveals the reduction in SQR activity as one of the pathomechanisms associated with CoQ deficiency syndrome.
Keywords: COX; SQR; blood pressure; glutathione; mitochondrial disease.
© 2016 The Authors. Published under the terms of the CC BY 4.0 license.
Figures

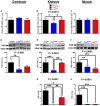
- A–H
Sqr mRNA levels (A–C), SQR protein levels (D–F), and SQR activity (G, H) in cerebrum (A, D), kidneys (B, E, G), and muscle (C, F, H) of Coq9 +/+, Coq9 R239X, and Coq9 Q95X mice. Note that SQR Western blots were performed in isolated cerebral mitochondria due to the low levels of this protein in cerebrum. In kidneys and muscle, the Western blots were performed in tissue homogenates. Data are expressed as mean ± SD. *P < 0.05; **P < 0.01; ***P < 0.001; Coq9 R239X and Coq9 Q95X mice versus Coq9 +/+ mice. # P < 0.05; ## P < 0.01; ### P < 0.001; Coq9 R239X versus Coq9 Q95X mice (one‐way ANOVA with a Tukey's post hoc test; n = 5–9 for each group).

- A
Levels of CoQ10 in fibroblasts of controls (C) and patients (P1‐4) with primary CoQ10 deficiency.
- B
Levels of SQR protein in fibroblasts of controls (C) and patients (P1‐4) with primary CoQ10 deficiency cultured without (vehicle) and with 5 μM of CoQ10 (+ CoQ10) during 1 day or 7 days.
- C, D
Total CoQ levels (CoQ9 + CoQ10) in kidneys (C) and muscle (D) of Coq9 +/+, Coq9 R239X, and Coq9 R239X + ubiquinol‐10 (Q10H2) mice.
- E, F
Levels of SQR protein in kidneys (E) and muscle (F) of Coq9 +/+, Coq9 R239X, and Coq9 R239X + ubiquinol‐10 (Q10H2) mice.
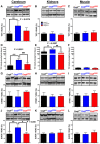
- A–C
TST protein levels in cerebrum (A), kidneys (B), and muscle (C) of Coq9 +/+, Coq9 R239X, and Coq9 Q95X mice.
- D–F
TST activity in cerebrum (D), kidneys (E), and muscle (F) of Coq9 +/+, Coq9 R239X, and Coq9 Q95X mice.
- G–I
ETEH1 (SDO) protein levels in cerebrum (G), kidneys (H), and muscle (I) of Coq9 +/+, Coq9 R239X, and Coq9 Q95X mice.
- J–L
SUOX protein levels in cerebrum (J), kidneys (K), and muscle (L) of Coq9 +/+, Coq9 R239X and Coq9 Q95X mice.
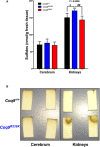
Quantification of sulfide levels in cerebrum and kidneys of Coq9 +/+, Coq9 R239X, and Coq9 Q95X mice. Data are expressed as mean ± SD. *P < 0.05; Coq9 R239X and Coq9 Q95X mice versus Coq9 +/+ mice. ## P < 0.01; Coq9 R239X versus Coq9 Q95X mice (one‐way ANOVA with a Tukey's post hoc test; n = 5–10 for each group).
Qualitative measurement of hydrogen sulfide in cerebrum and kidneys of Coq9 +/+ and Coq9 R239X mice.
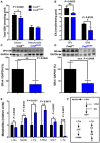
- A
Total GSH in cytosol and mitochondria of cerebrum of Coq9 +/+ and Coq9 R239X mice.
- B
Cytosolic GPx and GRd activities in cerebrum of Coq9 +/+ and Coq9 R239X mice.
- C, D
Levels of GPx4 (C) and GRd (D) protein in cerebral homogenate of Coq9 +/+ and Coq9 R239X mice.
- E
Levels of L‐glutamate (L‐Glu), N‐acetylglutamate (NacGlu), L‐tryptophan (L‐Trp), 5‐HIAA, N‐acetyltryptophan (NALT), L‐tyrosine (L‐Tyr) in cerebrum of Coq9 +/+ and Coq9 R239X mice.
- F
Biosynthetic pathway of GSH, serotonin, and catecholamine.
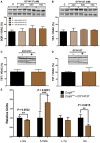
- A, B
SQR (A) and TST (B) protein levels in human skin fibroblasts supplemented with the H2S donor GYY4137.
- C, D
TST protein level in kidneys (C) and cerebrum (D) of Coq9 +/+ mice supplemented with the H2S donor GYY4137.
- E
Levels of neurotransmitters in cerebrum of Coq9 +/+ mice supplemented with the H2S donor GYY4137.

COX activity in cerebrum, kidneys, and muscle of Coq9 +/+, Coq9 R239X, and Coq9 Q95X mice. Data are expressed as mean ± SD (one‐way ANOVA with a Tukey's post hoc test; n = 3–6 for each group).
Images COX histochemistry in gastrocnemius of Coq9 +/+, Coq9 R239X, and Coq9 Q95X mice; scale bar: 100 μm.

Systolic, diastolic, and mean blood pressure in Coq9 +/+ and Coq9 R239X mice.
Heart rate in Coq9 +/+ and Coq9 R239X mice.
References
-
- Ashby MN, Kutsunai SY, Ackerman S, Tzagoloff A, Edwards PA (1992) COQ2 is a candidate for the structural gene encoding para‐hydroxybenzoate: polyprenyltransferase. J Biol Chem 267: 4128–4136 - PubMed
-
- Brzywczy J, Sienko M, Kucharska A, Paszewski A (2002) Sulphur amino acid synthesis in Schizosaccharomyces pombe represents a specific variant of sulphur metabolism in fungi. Yeast 19: 29–35 - PubMed
-
- Di Meo I, Fagiolari G, Prelle A, Viscomi C, Zeviani M, Tiranti V (2011) Chronic exposure to sulfide causes accelerated degradation of cytochrome c oxidase in ethylmalonic encephalopathy. Antioxid Redox Signal 15: 353–362 - PubMed
Publication types
MeSH terms
Substances
Supplementary concepts
Grants and funding
LinkOut - more resources
Full Text Sources
Other Literature Sources
Medical
Molecular Biology Databases
Research Materials

