

Metabolism and phospholipid assembly of polyunsaturated fatty acids in human bone marrow mesenchymal stromal cells
- PMID: 27856675
- PMCID: PMC5234713
- DOI: 10.1194/jlr.M070680
Metabolism and phospholipid assembly of polyunsaturated fatty acids in human bone marrow mesenchymal stromal cells
Abstract
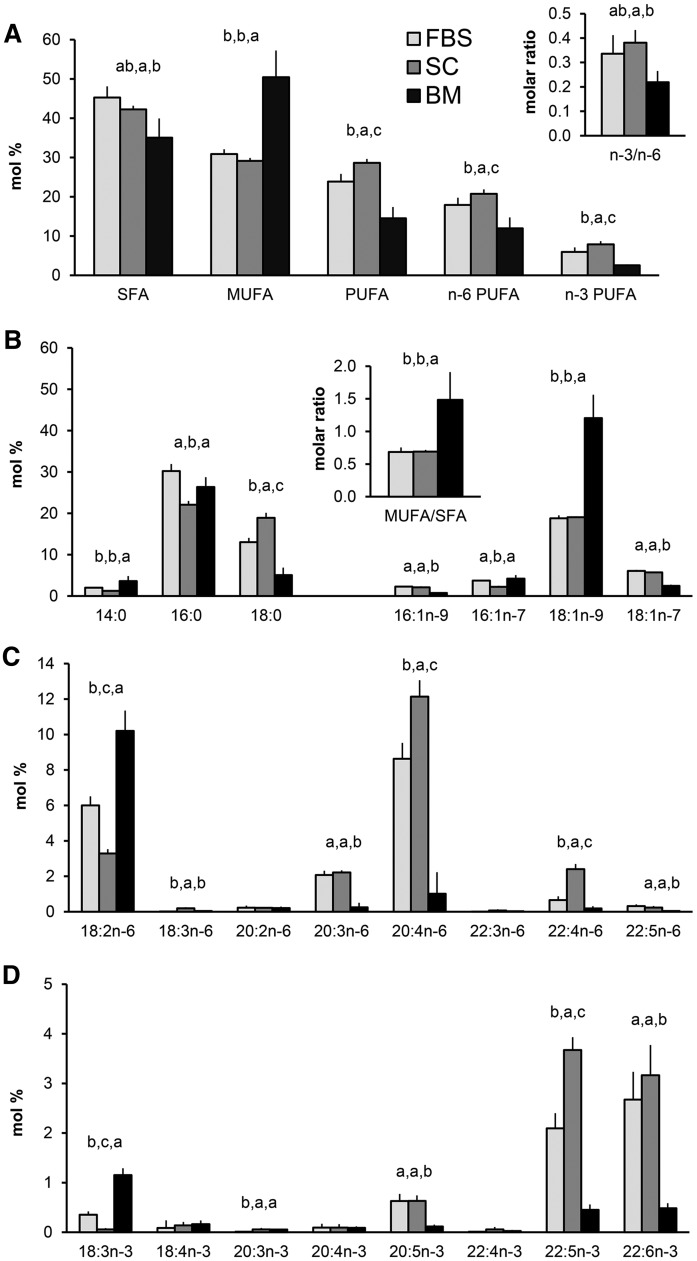
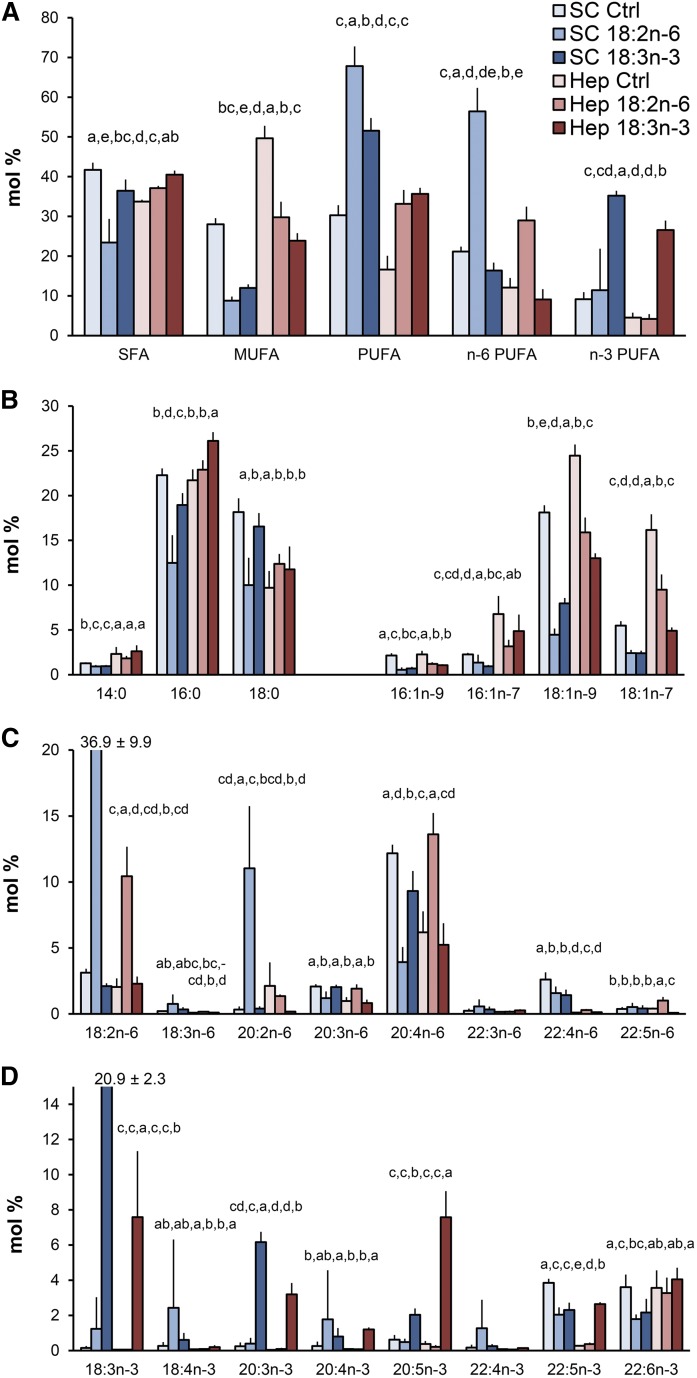
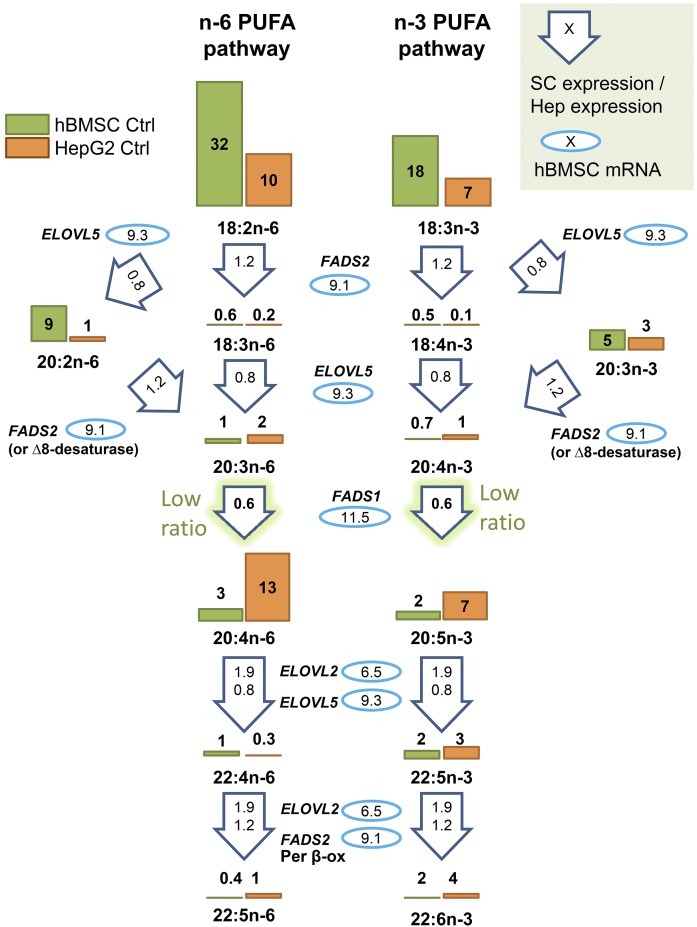
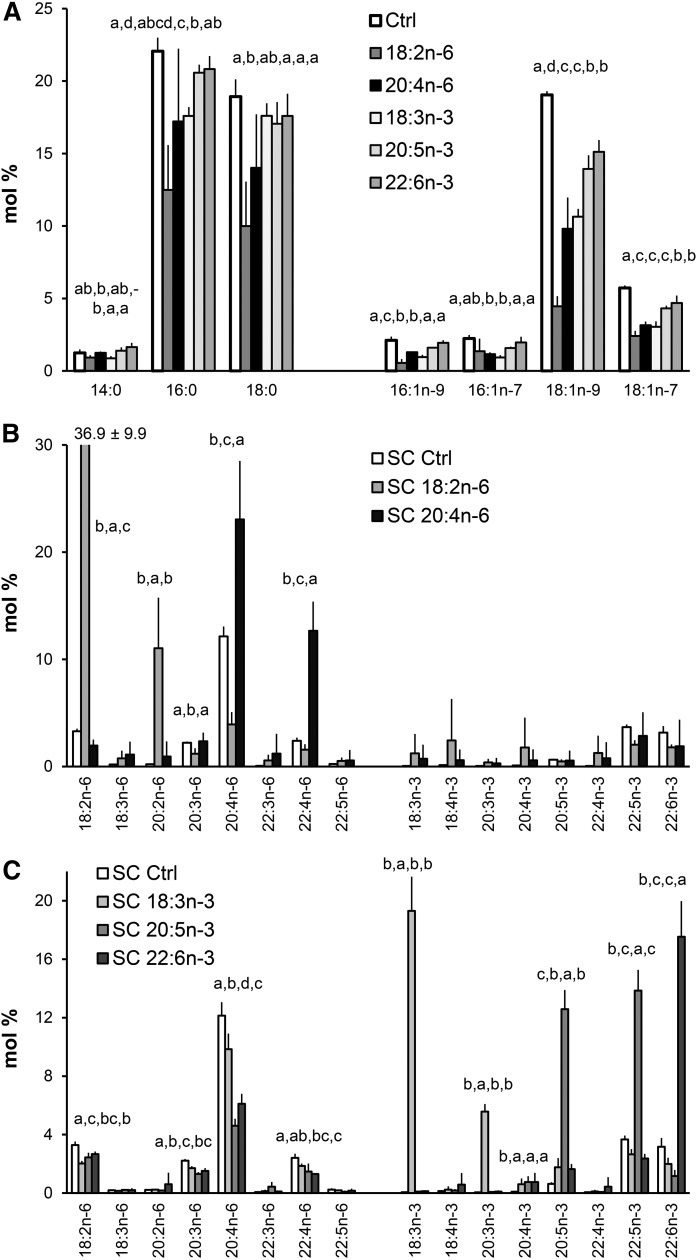
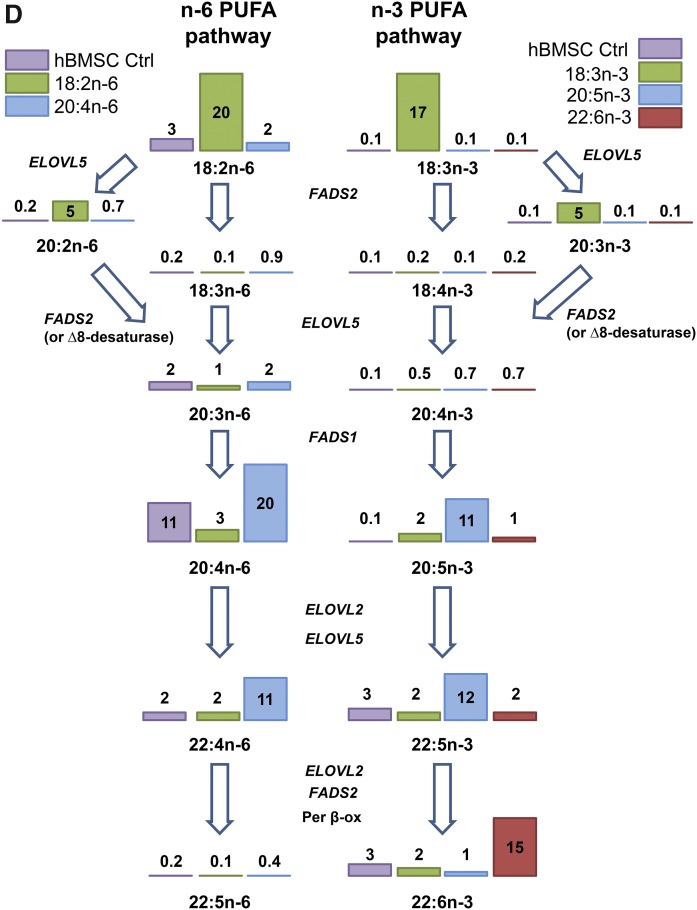
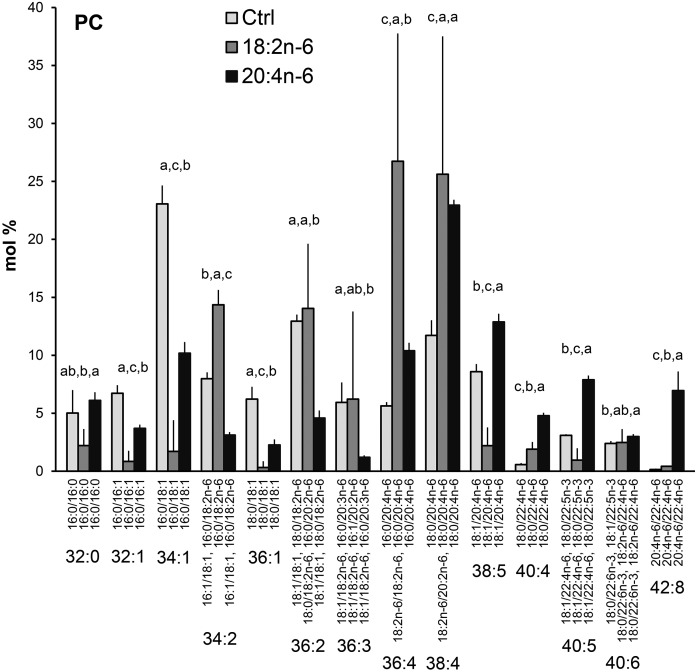
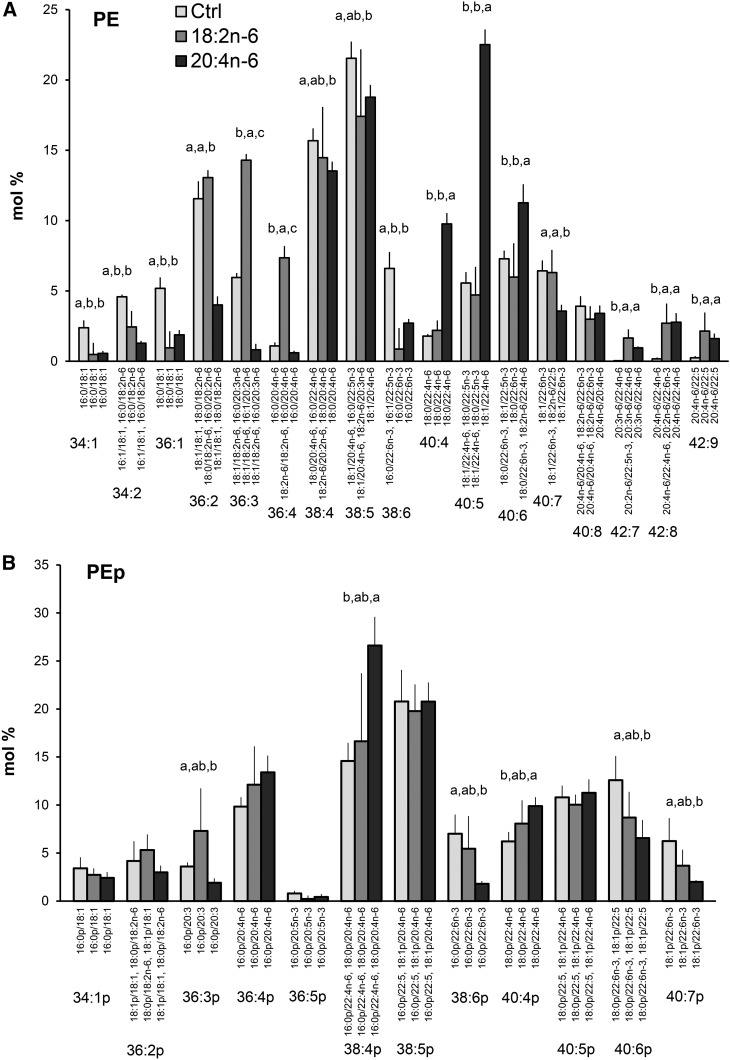
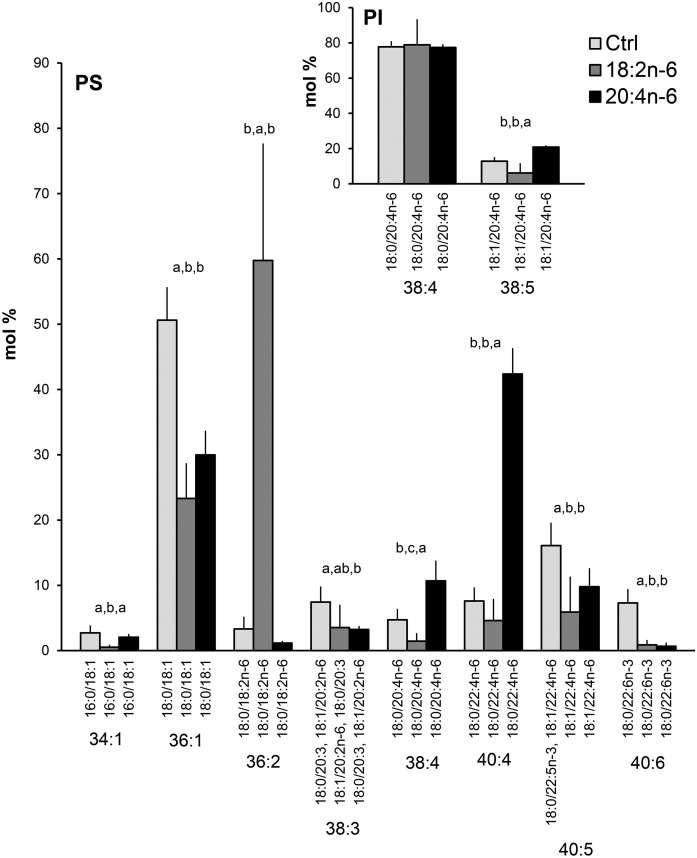
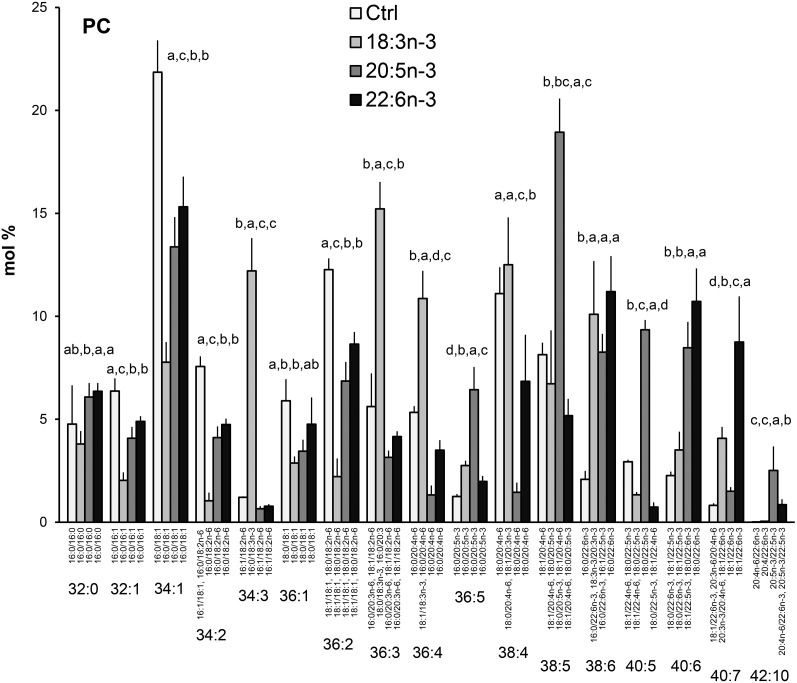
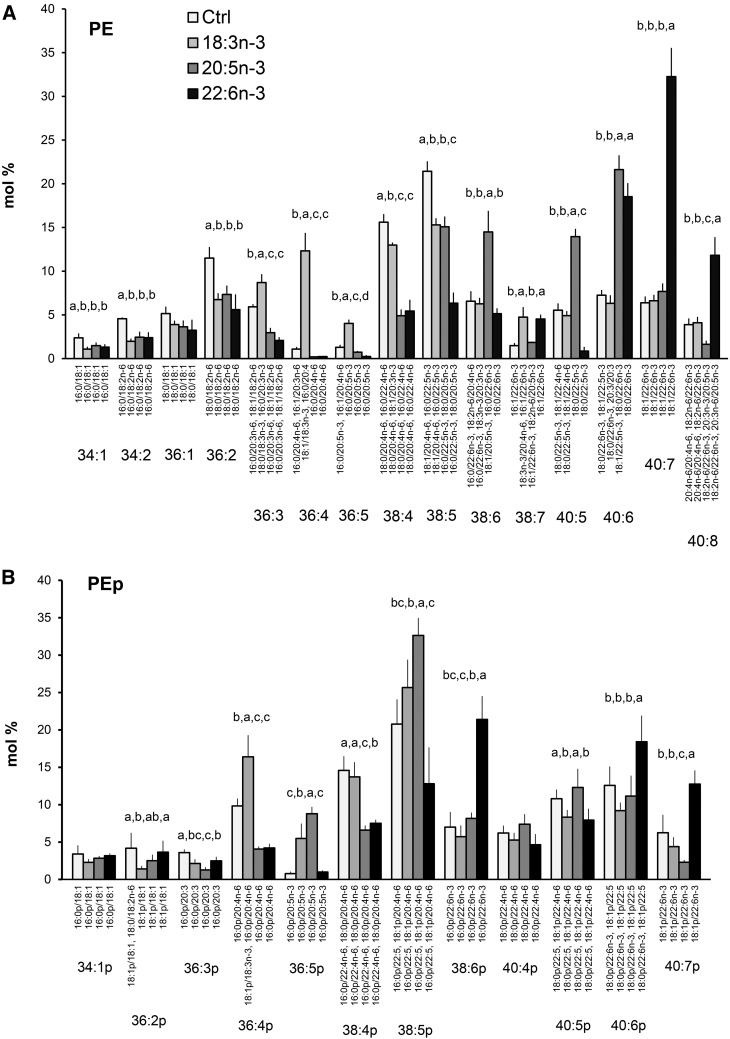
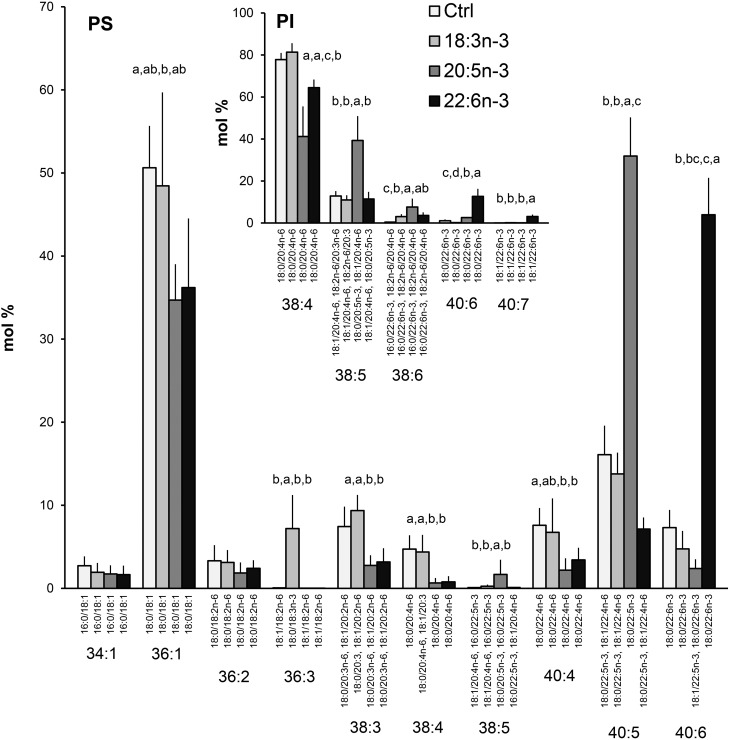
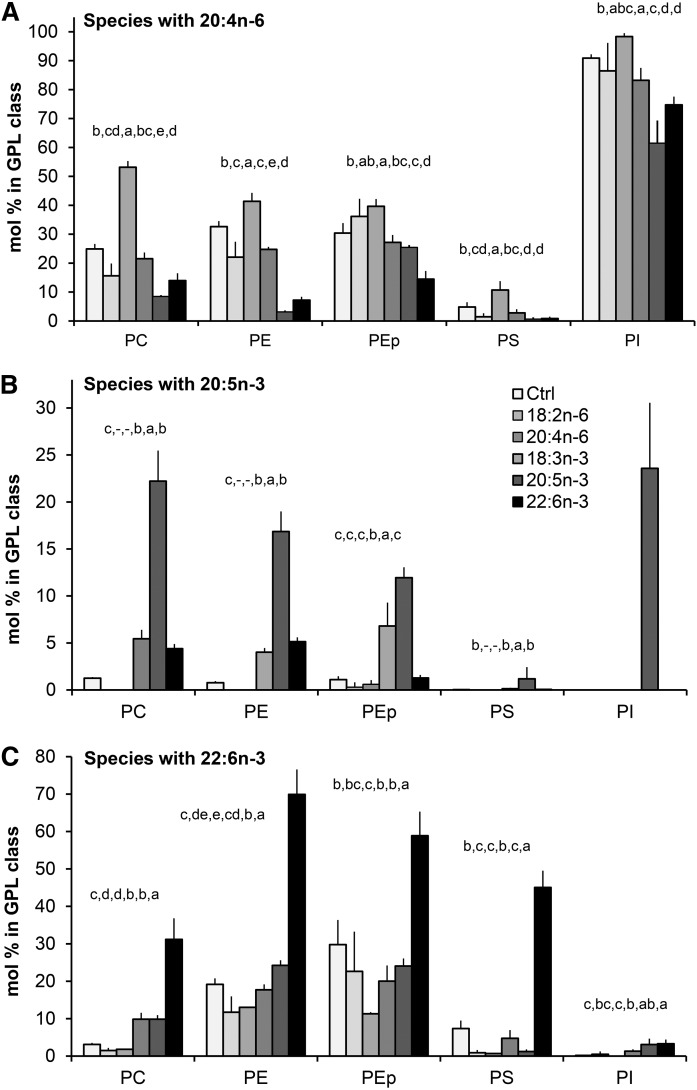
High arachidonic acid (20:4n-6) and low n-3 PUFA levels impair the capacity of cultured human bone marrow mesenchymal stromal cells (hBMSCs) to modulate immune functions. The capacity of the hBMSCs to modify PUFA structures was found to be limited. Therefore, different PUFA supplements given to the cells resulted in very different glycerophospholipid (GPL) species profiles and substrate availability for phospholipases, which have preferences for polar head group and acyl chains when liberating PUFA precursors for production of lipid mediators. When supplemented with 20:4n-6, the cells increased prostaglandin E2 secretion. However, they elongated 20:4n-6 to the less active precursor, 22:4n-6, and also incorporated it into triacylglycerols, which may have limited the proinflammatory signaling. The n-3 PUFA precursor, 18:3n-3, had little potency to reduce the GPL 20:4n-6 content, while the eicosapentaenoic (20:5n-3) and docosahexaenoic (22:6n-3) acid supplements efficiently displaced the 20:4n-6 acyls, and created diverse GPL species substrate pools allowing attenuation of inflammatory signaling. The results emphasize the importance of choosing appropriate PUFA supplements for in vitro hBMSC expansion and suggests that for optimal function they require an exogenous fatty acid source providing 20:5n-3 and 22:6n-3 sufficiently, but 20:4n-6 moderately, which calls for specifically designed optimal PUFA supplements for the cultures.
Keywords: arachidonic acid; docosahexaenoic acid; eicosapentaenoic acid; glycerophospholipid; immunomodulation; lipid signaling; mass spectrometry; mesenchymal stromal/stem cell; prostaglandin E2.
Copyright © 2017 by the American Society for Biochemistry and Molecular Biology, Inc.
Figures
Similar articles
-
Aging bone marrow mesenchymal stromal cells have altered membrane glycerophospholipid composition and functionality.J Lipid Res. 2013 Mar;54(3):622-635. doi: 10.1194/jlr.M030650. Epub 2012 Dec 27. J Lipid Res. 2013. PMID: 23271708 Free PMC article.
-
Polyunsaturated fatty acids modify the extracellular vesicle membranes and increase the production of proresolving lipid mediators of human mesenchymal stromal cells.Biochim Biophys Acta Mol Cell Biol Lipids. 2019 Oct;1864(10):1350-1362. doi: 10.1016/j.bbalip.2019.06.010. Epub 2019 Jun 15. Biochim Biophys Acta Mol Cell Biol Lipids. 2019. PMID: 31207356
-
The pathway from arachidonic to docosapentaenoic acid (20:4n-6 to 22:5n-6) and from eicosapentaenoic to docosahexaenoic acid (20:5n-3 to 22:6n-3) studied in testicular cells from immature rats.Biochim Biophys Acta. 2000 Jan 3;1483(1):119-31. doi: 10.1016/s1388-1981(99)00166-3. Biochim Biophys Acta. 2000. PMID: 10601701
-
Fatty acids, the immune response, and autoimmunity: a question of n-6 essentiality and the balance between n-6 and n-3.Lipids. 2003 Apr;38(4):323-41. doi: 10.1007/s11745-003-1067-z. Lipids. 2003. PMID: 12848277 Review.
-
Polyunsaturated fatty acids and inflammatory processes: New twists in an old tale.Biochimie. 2009 Jun;91(6):791-5. doi: 10.1016/j.biochi.2009.01.008. Biochimie. 2009. PMID: 19455748 Review.
Cited by
-
Bioactive Lipids in MSCs Biology: State of the Art and Role in Inflammation.Int J Mol Sci. 2021 Feb 2;22(3):1481. doi: 10.3390/ijms22031481. Int J Mol Sci. 2021. PMID: 33540695 Free PMC article. Review.
-
Restored in vivo-like membrane lipidomics positively influence in vitro features of cultured mesenchymal stromal/stem cells derived from human placenta.Stem Cell Res Ther. 2017 Feb 7;8(1):31. doi: 10.1186/s13287-017-0487-4. Stem Cell Res Ther. 2017. PMID: 28173875 Free PMC article.
-
Phospholipolysis Caused by Different Types of Bacterial Phospholipases During Cold Storage of Bovine Raw Milk Is Prevented by N2 Gas Flushing.Front Microbiol. 2018 Jun 19;9:1307. doi: 10.3389/fmicb.2018.01307. eCollection 2018. Front Microbiol. 2018. PMID: 29971053 Free PMC article.
-
Orotic acid-treated hepatocellular carcinoma cells resist steatosis by modification of fatty acid metabolism.Lipids Health Dis. 2020 Apr 13;19(1):70. doi: 10.1186/s12944-020-01243-5. Lipids Health Dis. 2020. PMID: 32284043 Free PMC article.
-
Multi-omics characterization of lymphedema-induced adipose tissue resulting from breast cancer-related surgery.FASEB J. 2024 Oct 31;38(20):e70097. doi: 10.1096/fj.202400498RR. FASEB J. 2024. PMID: 39394863 Free PMC article.
References
-
- Pittenger M. F., Mackay A. M., Beck S. C., Jaiswal R. K., Douglas R., Mosca J. D., Moorman M. A., Simonetti D. W., Craig S., and Marshak D. R.. 1999. Multilineage potential of adult human mesenchymal stem cells. Science. 284: 143–147. - PubMed
-
- Di Nicola M., Carlo-Stella C., Magni M., Milanesi M., Longoni P. D., Matteucci P., Grisanti S., and Gianni A. M.. 2002. Human bone marrow stromal cells suppress T-lymphocyte proliferation induced by cellular or nonspecific mitogenic stimuli. Blood. 99: 3838–3843. - PubMed
-
- Sato K., Ozaki K., Oh I., Meguro A., Hatanaka K., Nagai T., Muroi K., and Ozawa K.. 2007. Nitric oxide plays a critical role in suppression of T-cell proliferation by mesenchymal stem cells. Blood. 109: 228–234. - PubMed
-
- Ren G., Zhang L., Zhao X., Xu G., Zhang Y., Roberts A. I., Zhao R. C. C., and Shi Y.. 2008. Mesenchymal stem cell-mediated immunosuppression occurs via concerted action of chemokines and nitric oxide. Cell Stem Cell. 2: 141–150. - PubMed
-
- Krampera M., Glennie S., Dyson J., Scott D., Laylor R., Simpson E., and Dazzi F.. 2003. Bone marrow mesenchymal stem cells inhibit the response of naive and memory antigen-specific T cells to their cognate peptide. Blood. 101: 3722–3729. - PubMed
MeSH terms
Substances
LinkOut - more resources
Full Text Sources
Other Literature Sources
Molecular Biology Databases
