. 2016 Nov 29;113(48):E7778-E7787.
doi: 10.1073/pnas.1608221113. Epub 2016 Nov 15.

Trypanosoma brucei metabolite indolepyruvate decreases HIF-1α and glycolysis in macrophages as a mechanism of innate immune evasion

Affiliations

Trypanosoma brucei metabolite indolepyruvate decreases HIF-1α and glycolysis in macrophages as a mechanism of innate immune evasion

Anne F McGettrick et al. Proc Natl Acad Sci U S A. .

Abstract

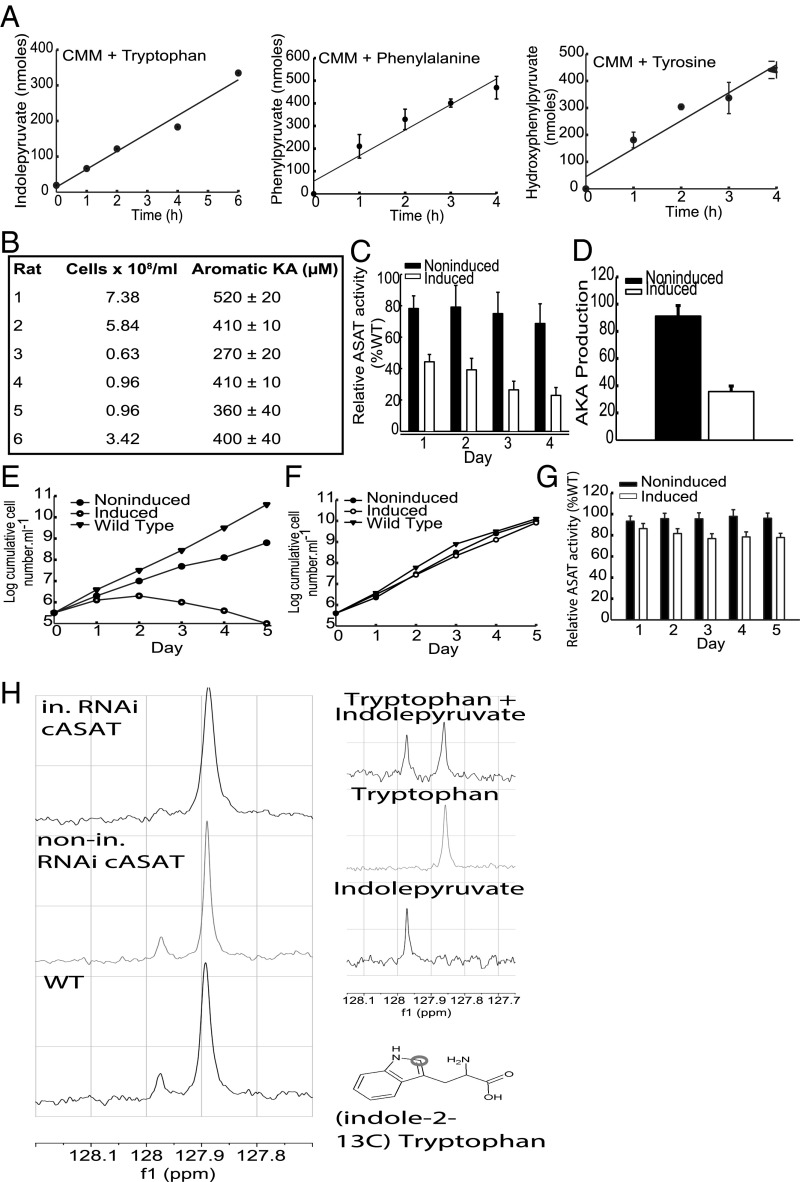
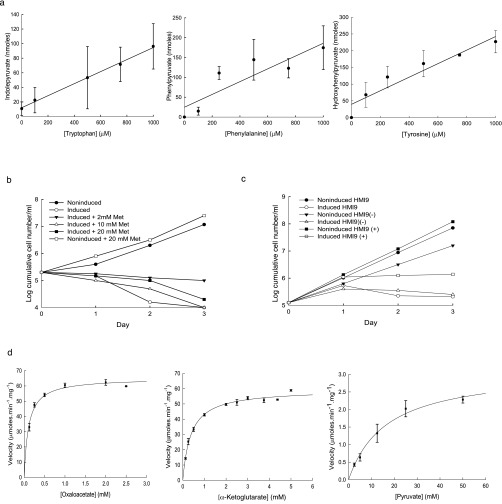
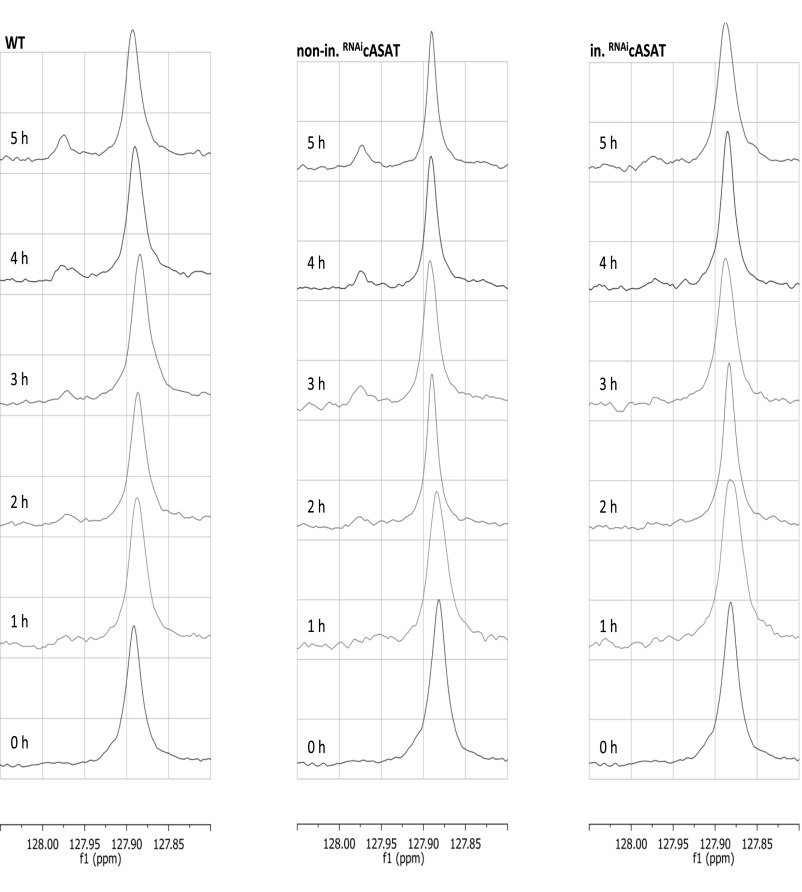
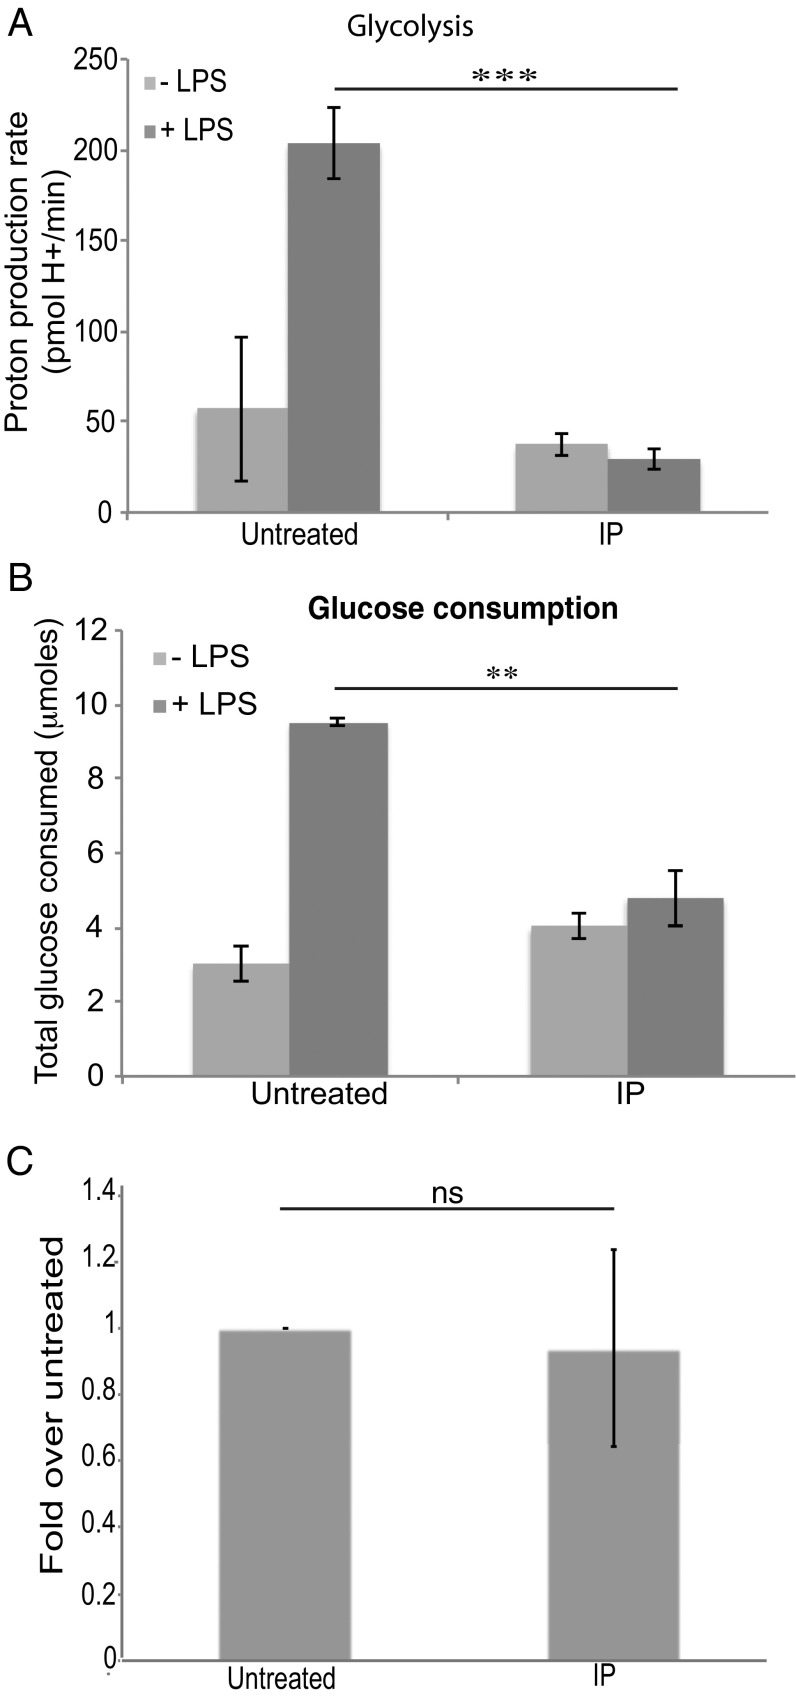
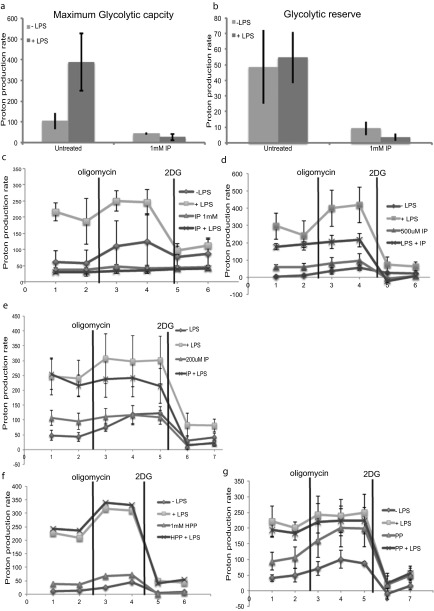
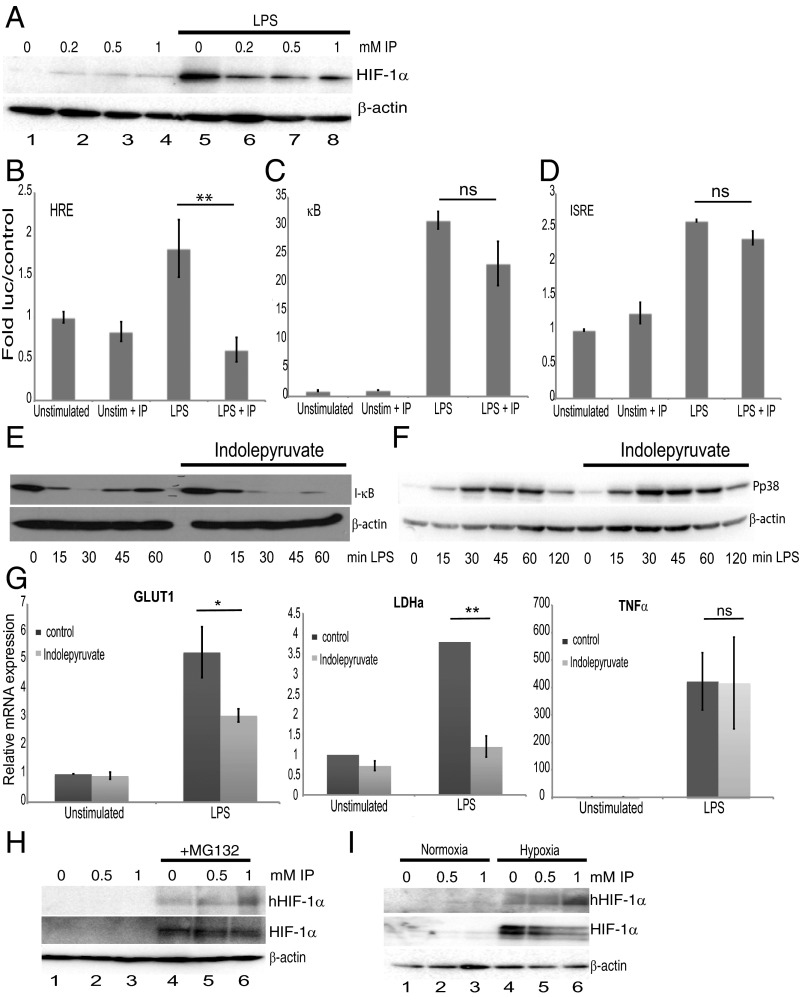
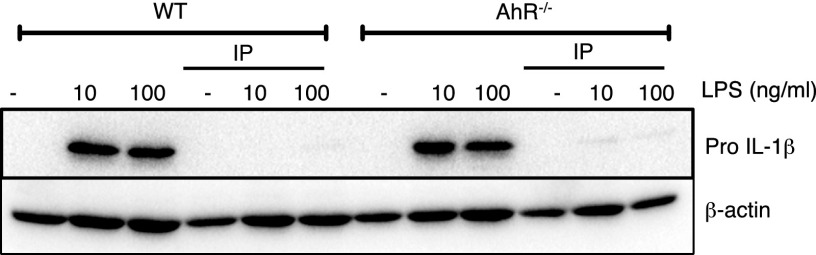
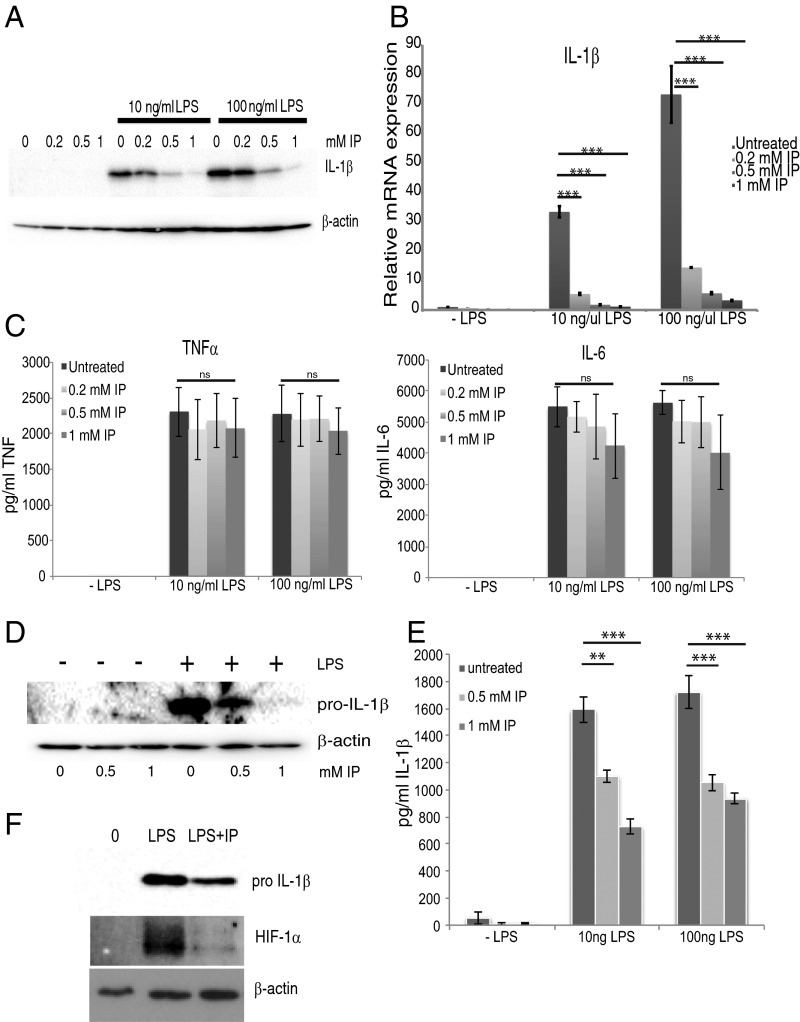
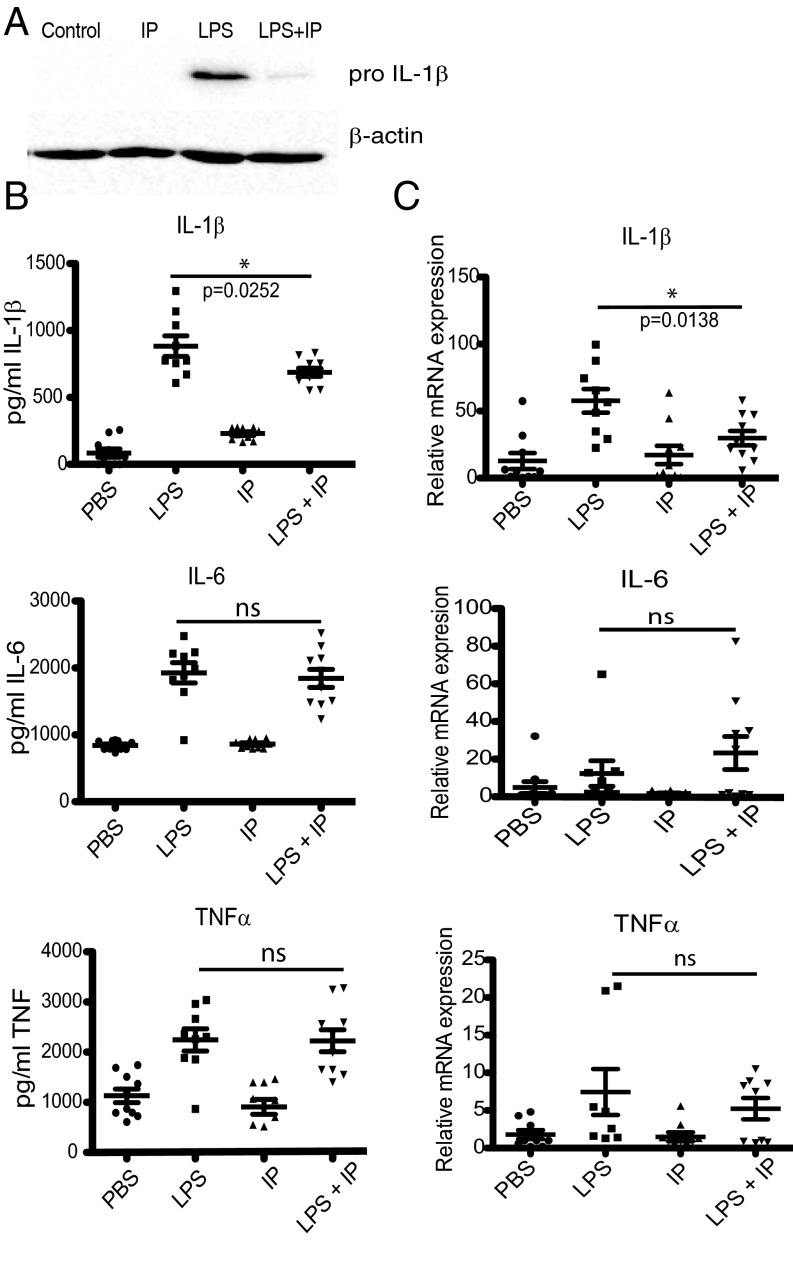
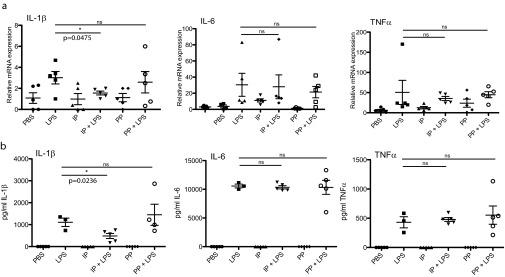
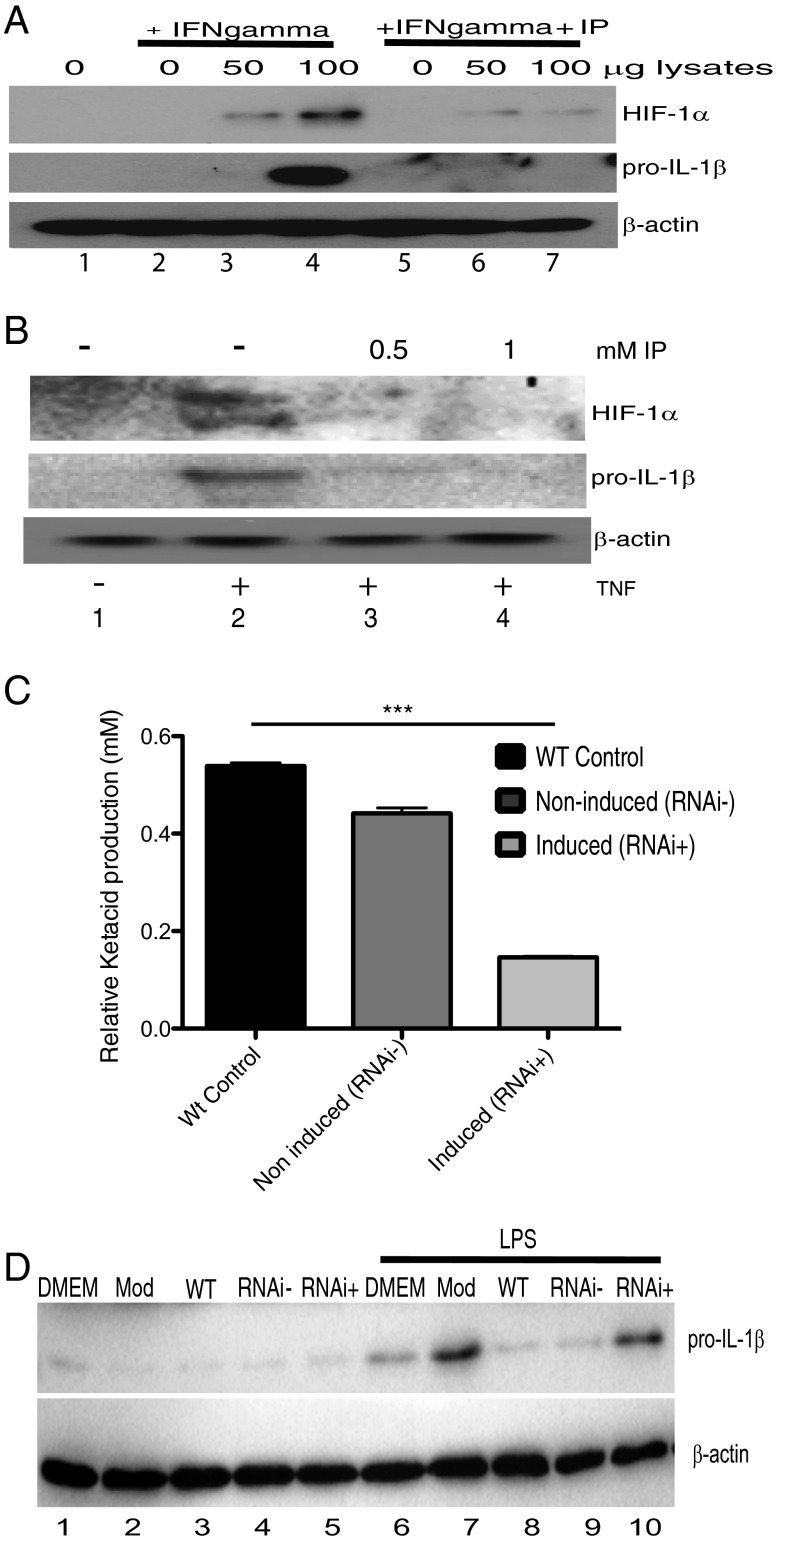
The parasite Trypanasoma brucei causes African trypanosomiasis, known as sleeping sickness in humans and nagana in domestic animals. These diseases are a major burden in the 36 sub-Saharan African countries where the tsetse fly vector is endemic. Untreated trypanosomiasis is fatal and the current treatments are stage-dependent and can be problematic during the meningoencephalitic stage, where no new therapies have been developed in recent years and the current drugs have a low therapeutic index. There is a need for more effective treatments and a better understanding of how these parasites evade the host immune response will help in this regard. The bloodstream form of T. brucei excretes significant amounts of aromatic ketoacids, including indolepyruvate, a transamination product of tryptophan. This study demonstrates that this process is essential in bloodstream forms, is mediated by a specialized isoform of cytoplasmic aminotransferase and, importantly, reveals an immunomodulatory role for indolepyruvate. Indolepyruvate prevents the LPS-induced glycolytic shift in macrophages. This effect is the result of an increase in the hydroxylation and degradation of the transcription factor hypoxia-inducible factor-1α (HIF-1α). The reduction in HIF-1α levels by indolepyruvate, following LPS or trypanosome activation, results in a decrease in production of the proinflammatory cytokine IL-1β. These data demonstrate an important role for indolepyruvate in immune evasion by T. brucei.

Keywords: Trypanosoma brucei; immune evasion; immunometabolism; innate immunity.


Conflict of interest statement

The authors declare no conflict of interest.

Figures

Fig. 1.
Fig. 1.
Aromatic ketoacids production in bloodstream forms of T. brucei involves an essential cASAT activity. (A) Trypanosomes (5–6 × 10⁷ cells/mL) were incubated in Creek’s Minimal Medium (CMM) supplemented with tryptophan, phenylalanine, or tyrosine (2 mM). At the indicated times, samples of the extracellular medium were assayed for aromatic ketoacid content using AHADH, as described in Materials and Methods. The results represent the mean ± SD of three determinations and the rates were estimated by linear regression analysis and expressed as nanomoles per 5 × 10⁷cells per hour. (B) Serum was prepared from infected rat blood and concentration of aromatic ketoacids was determined using AHADH, as described in Materials and Methods. In each case the level of the parasitemia was also determined. (C) The total ASAT activity of noninduced and induced bloodstream TbcASAT RNAi cells was measured as described in Materials and Methods. The results were expressed as relative to the activity of the wild-type cells (46.7 ± 2.3 nmol⋅min−1⋅mg−1) and represent the mean ± SD of three determinations. (D) Total aromatic ketoacid production by noninduced and induced bloodstream TbcASAT RNAi cells was measured as described in Materials and Methods. The results are expressed as relative to wild-type production and represent the mean ± SD of three determinations. (E) The growth of the parental wild-type cells (▼) and a bloodstream form TbcASAT RNAi cell line cultured in the absence (●, noninduced) or presence (○, induced) of tetracycline was monitored and expressed as log-cumulative number of cells per milliliter. (F) The growth of the parental wild-type cells (▼) and a procyclic form TbcASAT RNAi cell line cultured in the absence (●, noninduced) or presence (○, induced) of tetracycline was monitored and expressed as log cumulative number of cells per milliliter. (G) The total ASAT activity of noninduced and induced procyclic TbcASAT RNAi cells were measured as described in Materials and Methods. The results were expressed as relative to the activity of the wild-type cells (203.3 ± 10.4 nmol⋅min−1⋅mg−1) and represent the mean ± SD of three determinations. (H) Bloodstream form wild-type (WT) MITat 1.1 and TbcASAT RNAi cells cultured in the presence (in. RNAicASAT) or absence (nonin. RNAicASAT) of tetracycline for 48 h were incubated in HMI-9 containing l-(indole-2-13C)-tryptophan for 5 h and the excreted end products were analyzed. The chemical shift of indolepyruvate (∼127.97 ppm) and l-tryptophan (∼127.86 ppm) are clearly distinguishable in a 13C NMR spectra. Molecular structure of (indole-2-13C) tryptophan, indicating the position of the 13C-labeled atom in the indole ring that was used for metabolite identification.
Fig. S1.
Fig. S1.
Aromatic ketoacids production in bloodstream forms of Trypanosoma brucei varies with the extracellular concentration of tryptophan, phenylalanine, or tyrosine and involves the essential activity of TbcASAT. Trypanosomes (2.5 × 10⁷ cells/mL) were incubated (37 °C) in CMM containing dialyzed FCS and supplemented with various concentrations of tryptophan, phenylalanine, or tyrosine as indicated. After 4 h, samples of the extracellular medium were prepared by centrifugation and assayed for aromatic ketoacid content using AHADH as described in Materials and Methods. The results represent the mean ± SD of three determinations and the data were fitted by linear regression analysis. (B) The bloodstream form TbcASAT RNAi cell line cultured in HMI-9 medium supplemented with methionine (Met) from 2–20 mM and grown under induced (+tetracycline) or noninduced conditions. The growth of the cells was monitored and expressed as log cumulative number of cells per milliliter. (C) The bloodstream form TbcASAT RNAi cell line was cultured in HMI-9 medium, HMI-9 medium supplemented with 1 mM each of tryptophan, phenylalanine and tryosine [HMI(+)] or HMI-9 medium containing a fivefold lower concentration of each of the aromatic amino acids [HMI-9 (−)]. The cells were grown under induced (+tetracycline) or noninduced conditions. The growth of the cells was monitored and expressed as log-cumulative number of cells per milliliter. (D) The full-length ORF of TbcASAT (Tb10.70.3710,) was amplified from genomic DNA and inserted into pNIC28-Bsa4 using ligation independent cloning, for expression in BL21 (DE3) E. coli. Following IPTG-induced expression of the recombinant protein, the TbcASAT was purified via Ni2+ resin column. Protein concentration was ascertained via Bradford assay. The assays were performed in 100 mM Tris pH 7.5 containing 25 mM NaCl, 0.25 mM NADH, T. cruzi recombinant AHADH (20 units) as the coupling enzyme, 25 mM l-tryptophan, and various concentrations of oxaloacetate, α-ketoglutarate, or pyruvate as ketoacid acceptors. The assay was initiated by addition of 0.45 ng TbcASAT. Enzyme velocity was estimated from the decrease in absorbance at 340 nM and was expressed as μmoles⋅min−1⋅mg−1. The data were plotted and fitted to Michaelis–Menten curves using the Enzyme Kinetics Module (v1.3) operating in Sigma Plot (v11). The data represent the mean ± SE of triplicate determinations.
Fig. S2.
Fig. S2.
Bloodstream T. brucei produce Indolepyruvate in the presence of tryptophan. Bloodstream from wild-type MITat 1.1 and TbcASAT RNAi cells cultured in the presence (in. RNAicASAT) or absence (nonin. RNAicASAT) of tetracycline for 48 h were incubated in HMI-9 containing l-(indole-2-13C)-tryptophan and the excreted end products were analyzed every hour for 5 h by 13C NMR, as described in Materials and Methods. The chemical shift of indolepyruvate (∼127.97 ppm) and l-tryptophan (∼127.86 ppm) are clearly distinguishable in a 13C NMR spectra.
Fig. 2.
Fig. 2.
Indolepyruvate inhibits the ability of LPS to induce glycolysis. BMDM were preincubated with indolepyruvate at a final concentration of 1 mM for 30 min before stimulation with LPS (100 ng/mL) for 24 h. (A) The proton production rate (PPR) was measured as described in Materials and Methods. ***P < 0.001. (B) The levels of glucose consumed from the supernatant was measured as described in Materials and Methods and (C) an LDH assay was performed to ensure indolepyruvate was not toxic at this concentration. **P < 0.01. One millimolar indolepyruvate was added to BMDM for 25 h and then the levels of cell death were measured as described in Materials and Methods. The level of cell death is presented as fold over untreated. These are representative of at least three independent experiments. IP, indolepyruvate; NS, not significant.
Fig. S3.
Fig. S3.
Indolepyruvate, but not phenylpyruvate or hydroxyphenylpyruvate, inhibits the ability of LPS to induce glycolysis. BMDM were preincubated with indolepyruvate at various concentrations, phenylpyruvate at 1 mM or hydroxyphenylpyruvate at 1 mM, for 30 min before stimulation with LPS (100 ng/mL) for 24 h. The proton production rate was measured as described in Materials and Methods. (A) The maximum glycolytic rate was measured following injection of oligomycin at a final concentration of 0.2 μM. (B) The glycolytic reserve was calculated by subtracting the rate of glycolysis from the maximum glycolytic rate. (C–G) The glycolytic profile of these BMDMs was measured using oligomycin at a final concentration of 0.2 μM and 2DG at a final concentration of 0.5 mM. These are representative of at least two independent experiments. HPP, hydroxyphenylpyruvate; IP, indolepyruvate; PP, phenylpyruvate.
Fig. 3.
Fig. 3.
Indolepyruvate inhibits the induction of HIF-1α by LPS but has little or no effect on the κB, ISRE, or MAPK pathways. (A) BMDM were incubated with various concentrations of indolepyruvate (as indicated) for 30 min before stimulation with LPS (100 ng/mL) for 24 h. The levels of HIF-1α were measured by Western blot. (B–D) 293-MTC cells were transfected with luciferase plasmids containing (B) HRE (**P < 0.01), (C) κB, or (D) ISRE promoters along with the TK Renilla control vector. Twenty-four hours later indolepyruvate, at a final concentration of 1 mM, was incubated on the cells for 30 min before stimulation with LPS (100 ng/mL) for 6 h. Results are normalized to Renilla luciferase activity and are presented relative to control cells containing empty vector. (E and F) BMDM were incubated with indolepyruvate at a final concentration of 1 mM for 30 min before stimulation with LPS (100 ng/mL) for varying times as indicated. The levels of (E) I-κB or (F) phosphorylated p38 (Pp38) were measured by Western blot. (G) GLUT1, LDHA, and TNF-α mRNA levels were measured by qPCR from mRNA isolated from BMDM incubated with 0.5 mM indolepyruvate for 30 min before stimulation with LPS (100 ng/mL) for 24 h. *P < 0.05; **P < 0.001. (H) BMDM were preincubated with MG132 for 30 min before addition of indolepyruvate at 0.5 and 1 mM for 6 h. The levels of hydroxylated HIF-1α and total HIF-1α were measured by Western blot. (I) Thirty minutes postincubation with indolepyruvate, BMDM were placed under normoxic or hypoxic conditions for 2 h. The levels of hydroxylated HIF-1α and total HIF-1α were measured by Western blot. (A–F, H, and I) are representative of at least three independent experiments. (G) Mean ± SEM, n = 3. IP, indolepyruvate.
Fig. S4.
Fig. S4.
Indolepyruvate inhibits LPS-induced IL-1β in both wild-type and AhR-deficient BMDM. BMDM were preincubated with indolepyruvate at 1 mM for 30 min before stimulation with LPS (10 ng/mL or 100 ng/mL, as indicated) for 24 h. The level of pro–IL-1β protein was measured by Western blot. This is representative of at least three independent experiments. IP, indolepyruvate.
Fig. 4.
Fig. 4.
Indolepyruvate inhibits the induction of IL-1β by LPS. (A–C) BMDM were incubated with varying concentrations of indolepyruvate 30 min before stimulation with LPS (10 ng/mL or 100 ng/mL) for 24 h. (A) The levels of pro-IL-1β protein were measured by Western blot, whereas (B) IL-1β mRNA was measured by qPCR. ***P < 0.001. (C) Supernatants were examined by ELISA to determine the expression levels of TNF and IL-6. (D and E) PBMCs were incubated with varying concentrations of indolepyruvate 30 min before stimulation with LPS (100 ng/mL) for 24 h. (D) The levels of pro–IL-1β protein were measured by Western blot and (E) IL-1β mRNA was measured by qPCR. **P < 0.01; ***P < 0.001. (F) PECs were incubated with 1 mM indolepyruvate for 30 min before stimulation with LPS (100 ng/mL) for 24 h. The levels of pro–IL-1β and HIF-1α were measured by Western blot. A, D, and F are representative of three independent experiments; B, C, and E represent mean ± SEM, n = 3. IP, indolepyruvate.
Fig. 5.
Fig. 5.
Indolepyruvate affects the ability of LPS to induce IL-1β and HIF-1α, but has no effect on TNF or IL-6 in vivo. Mice were injected intraperitoneally with indolepyruvate (50 mg/kg) or PBS for 30 min. LPS (15 mg/kg) or PBS were then injected intraperitoneally for 2 h. (A) Protein isolated from PECs was analyzed by Western blot for the presence of pro–IL-1β. (B) The levels of IL-1β, TNF, and IL-6 protein secreted into the serum were measured by ELISA. (C) The levels of IL-1β, TNF, and IL-6 mRNA were measured by qPCR using mRNA isolated from PECS. A is representative of three independent experiments. In B and C, n = 9 per group. IP, indolepyruvate.
Fig. S5.
Fig. S5.
Indolepyruvate affects the ability of LPS to induce IL-1β and HIF-1α, while having no effect on TNF or IL-6 in vivo. PECS and serum were isolated from mice following an in vivo experiment, as described in Materials and Methods. (A) mRNA isolated from PECs was analyzed by qPCR for IL-1β, TNF, and IL-6 qPCR. (B) The levels of IL-1β, TNF, and IL-6 protein secreted into the serum were measured by ELISA. n = 5 per group. IP, indolepyruvate; PP, phenylpyruvate.
Fig. 6.
Fig. 6.
Indolepyruvate inhibits the ability of T. brucei lysates to induce pro–IL-1β expression. BMDM were incubated with 1 mM indolepyruvate for 30 min before stimulation with (A) T. brucei lysates (0, 50, 100 μg), prepared as described in Materials and Methods, alongside IFN-γ (100 ng/mL) for 8 h or (B) TNF-α (10 ng/mL) for 8 h. The levels of pro–IL-1β and HIF-1α protein were measured by Western blot. (C) Wild-type, noninduced, and induced bloodstream cASAT RNAi cells were grown in a modified DMEM (Mod). Supernatants were removed, centrifuged and filtered, and total ASAT activity was measured as described in Materials and Methods. ***P < 0.001. (D) BMDM were pretreated with supernatants (diluted 1:1) from C or control media for 1 h. Cells were then stimulated with 100 ng/mL LPS for 24 h. The levels of pro–IL-1β and HIF-1α protein were measured by Western blot. Mod: Modified DMEM; RNAi−, supernatants from noninduced TbcASAT RNAi cells; RNAi+, supernatants from induced TbcASAT RNAi cells; WT, supernatants from wild-type bloodstream cells. These experiments are representative of at least three independent experiments. IP, indolepyruvate.

Similar articles

Cited by

References

    1. Stich A, Abel PM, Krishna S. Human African trypanosomiasis. BMJ. 2002;325(7357):203–206. - PMC - PubMed
    1. Cross GA. Cellular and genetic aspects of antigenic variation in trypanosomes. Annu Rev Immunol. 1990;8:83–110. - PubMed
    1. Pays E, Vanhamme L, Berberof M. Genetic controls for the expression of surface antigens in African trypanosomes. Annu Rev Microbiol. 1994;48:25–52. - PubMed
    1. Morrison LJ, Marcello L, McCulloch R. Antigenic variation in the African trypanosome: Molecular mechanisms and phenotypic complexity. Cell Microbiol. 2009;11(12):1724–1734. - PubMed
    1. Thuita JK, et al. Trypanosoma brucei rhodesiense transmitted by a single tsetse fly bite in vervet monkeys as a model of human African trypanosomiasis. PLoS Negl Trop Dis. 2008;2(5):e238. - PMC - PubMed

Publication types

MeSH terms