. 2016 Dec 6;113(49):E7890-E7899.
doi: 10.1073/pnas.1611213113. Epub 2016 Nov 17.

Substrate recognition and catalysis by GH47 α-mannosidases involved in Asn-linked glycan maturation in the mammalian secretory pathway

Affiliations

Substrate recognition and catalysis by GH47 α-mannosidases involved in Asn-linked glycan maturation in the mammalian secretory pathway

Yong Xiang et al. Proc Natl Acad Sci U S A. .

Abstract

Maturation of Asn-linked oligosaccharides in the eukaryotic secretory pathway requires the trimming of nascent glycan chains to remove all glucose and several mannose residues before extension into complex-type structures on the cell surface and secreted glycoproteins. Multiple glycoside hydrolase family 47 (GH47) α-mannosidases, including endoplasmic reticulum (ER) α-mannosidase I (ERManI) and Golgi α-mannosidase IA (GMIA), are responsible for cleavage of terminal α1,2-linked mannose residues to produce uniquely trimmed oligomannose isomers that are necessary for ER glycoprotein quality control and glycan maturation. ERManI and GMIA have similar catalytic domain structures, but each enzyme cleaves distinct residues from tribranched oligomannose glycan substrates. The structural basis for branch-specific cleavage by ERManI and GMIA was explored by replacing an essential enzyme-bound Ca2+ ion with a lanthanum (La3+) ion. This ion swap led to enzyme inactivation while retaining high-affinity substrate interactions. Cocrystallization of La3+-bound enzymes with Man9GlcNAc2 substrate analogs revealed enzyme-substrate complexes with distinct modes of glycan branch insertion into the respective enzyme active-site clefts. Both enzymes had glycan interactions that extended across the entire glycan structure, but each enzyme engaged a different glycan branch and used different sets of glycan interactions. Additional mutagenesis and time-course studies of glycan cleavage probed the structural basis of enzyme specificity. The results provide insights into the enzyme catalytic mechanisms and reveal structural snapshots of the sequential glycan cleavage events. The data also indicate that full steric access to glycan substrates determines the efficiency of mannose-trimming reactions that control the conversion to complex-type structures in mammalian cells.

Keywords: Asn-linked glycan processing; bioinorganic chemistry; glycosidase mechanism; glycoside hydrolase; α-mannosidase.


Conflict of interest statement

The authors declare no conflict of interest.

Figures
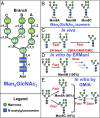
Fig. 1.
Fig. 1.
Diagrams of glycan cleavage specificity for ERManI and GMIA in vivo and in vitro. (A) Schematic diagram of the branched Man9GlcNAc2 Asn-linked glycan including the residue nomenclature and glycosidic linkages for mannose (M) and N-acetylglucosamine (NAG) residues as indicated by the symbol nomenclature shown in the legend. (B) Three Man8GlcNAc2 isomers can be generated by α-mannosidase action as indicated by the Man8A, Man8B, and Man8C nomenclature. (C) Cleavage of Man9GlcNAc2 in vivo is initiated by ERManI action to produce the Man8B isomer, and further digestion by GMIA/GMIB/GMIC produces Man5GlcNAc2. (D) In vitro cleavage of Man9GlcNAc2 by ERManI results in the rapid formation of the Man8B isomer and slow progression to smaller structures. (E) In vitro cleavage of Man9GlcNAc2 by GMIA results in the predominant cleavage of residue M11 (90%) and further cleavage to a Man6GlcNAc2 isomer that retains the M10 α1,2-linked mannose residue. Further cleavage to Man5GlcNAc2 occurs at a >10-fold slower rate.
Fig. S1.
Fig. S1.
Ion coordination for wild-type and mutant forms of ERManI and conformations of the mannose residues in the −1 and +1 subsites for the ERManI– and GMIA–glycan complexes. (A and B) The structures of bound glycans and ion coordination for the ERManI T688A mutant (A) and wild-type ERManI (1X9D) (14) (B) are presented for complexes with Ca2+ and a thiodisaccharide substrate analog. The Ca2+ ion is shown as a green sphere, and the thiodisaccharide is in stick form (green for the T688A mutant and yellow for wild-type ERManI). Coordinating water molecules are displayed as light blue spheres for the T688A mutant and as orange spheres for the pronucleophile water molecule (A) and as brown spheres for wild-type ERManI and purple spheres for the pronucleophile water molecule (B). The coordinating Thr/Ala residue is shown in stick form. The distance from the pronucleophile water molecule to the C1 of the thiodisaccharide glycone (3.7 Å) in the T688A mutant (A) is greater than the distance for the wild-type enzyme (3.4 Å) (B). (C) An overlay of the structures from A and B. (D and E) The structures of the nine-coordinate enzyme–La3+–Man9GlcNAc2–PA complexes for ERManI (D) and GMIA (E) are presented with the La3+ ion shown as a blue sphere and the glycan as cyan sticks in the ERManI–La3+–Man9GlcNAc2–PA complex and as magenta sticks in the ERManI–La3+–Man9GlcNAc2–PA complex. Coordinating water molecules are displayed as red spheres, and the coordinating Thr residue is shown in stick form. (F) An overlay of the structures from B and D. (GJ) The region of cation coordination in the structures of the ERManI(T688A) mutant (G) and wild-type ERManI (H) as Ca2+–thiodisaccharide complexes and wild-type ERManI (I) and wild-type GMIA (J) as La3+-Man9GlcNAc2–PA complexes. Coordinating water molecules are displayed as red spheres. Below each structure is a diagram representing the coordination geometry of each complex: G, Ca2+-centered pentagonal bipyramid; H, Ca2+-centered eightfold square antiprismatic; I and J, La3+-centered ninefold trigonal prismatic (square face tricapped). The structure of the Man-α (1, 2)-Man-O-methyl thiodisaccharide in the −1 and +1 subsites is shown for the ERManI(T688A) –Ca2+–thiodisaccharide complex (shown as green sticks in G and K) and the for wild-type ERManI–Ca2+–thiodisaccharide complex (1X9D) (14) (shown as yellow sticks in H and L). The equivalent Man-α (1, 2)-Man disaccharide in the −1 and +1 subsites for the ERManI–La3+–Man9GlcNAc2 complex (cyan sticks in I and M) and the GMIA–La3+–Man9GlcNAc2 complex (magenta sticks in J and N) are shown also. In KN the glycans are displayed in a similar position based on the alignment of the corresponding protein structures. The conformations of the residues in the −1 and +1 subsites and the glycosidic bond lengths between the respective residues are indicated in each panel. The Ca2+ ion is shown in green space fill representation (A–C, G, H, K, and L) and the La3+ ion is shown in blue space fill (D–F, I, J, M, and N). Coordinating water residues are shown in red space fill (D, E, and G–N).
Fig. S2.
Fig. S2.
Effect of cation substitution on the rescue of ERManI activity. ERManI was treated with EGTA and desalted as described in Material and Methods. Enzyme assays were performed with Man9GlcNAc2–PA as substrate in the presence of a range of cation concentrations. IC50 values were calculated for each cation and were plotted on a log scale in descending order of IC50. The ionic radius of the respective ion is indicated by the sphere above the plot, and hardness parameters are indicated in blue below each plot (59).
Fig. 2.
Fig. 2.
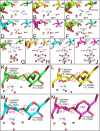
Oligosaccharide structures in the glycan-binding cleft of ERManI and GMIA. The crystal structures of ERManI (AC) and GMIA (DF) were determined in the presence of La3+ and Man9GlcNAc2–PA, and the electron densities of the bound glycan were revealed in Fo-Fc difference density maps calculated after omitting the ligands and subjecting the models to simulated annealing and contoured to 3σ. Cartoon diagrams of ERManI (A and B) and GMIA (D and E) are shown as side-on (A and D) or end-on (B and E) views with the protein structures in gray cartoon representation and the Fo-Fc map shown in mesh form. The structures of the bound Man9GlcNAc2 glycans are shown as yellow sticks. Wall-eyed stereo diagrams of the Fo-Fc omit maps for ERManI (C) and GMIA (F) in the glycan-binding cleft are also shown in a mesh representation with the structures of the glycans shown as yellow sticks. Monosaccharide residue designations based on the nomenclature shown in Fig.1 are indicated in the stereo figures.
Fig. 3.
Fig. 3.
Comparison of glycan structural conformations in the active sites of GH47 α-mannosidases. Enzyme-bound glycan conformations are compared for two pairs of GH47 α-mannosidase enzyme–glycan complexes (ERManI–glycan complexes in A, B, and E and GMIA–glycan complexes in C, D, and F) to illustrate the differences in glycan conformations bound in the active sites of the respective enzymes. (AD, Upper) Simplified cartoon representations of each glycan structure. The respective enzyme active-site clefts are depicted as brown lines representing the sides of the glycan-binding cleft with labeling of the −1 glycone-binding and ≥+1 glycan-binding subsites. Mannose residues are indicated by green circles and GlcNAc residues by blue squares. The monosaccharides that are missing from the respective glycan structures are shown as light green or light blue symbols with a dotted outline for each monosaccharide. (Lower) Stick representations of the glycan associated with the human ERManI–La3+–Man9GlcNAc2 complex (A, cyan sticks), yeast ERManI-Ca2+-Man5GlcNAc2 complex (1DL2) (10) (B, orange sticks), GMIA–La3+–Man9GlcNAc2 complex (C, yellow sticks), and GMIA–Ca2+–Man6GlcNAc2 complex (1NXC) (20) (D, green sticks); the residues in the +1 subsites are positioned identically. The positions of the La3+ or Ca2+ ions in the respective structures are shown as spheres at the bottom of the respective diagrams. The crystal structure of the mouse GMIA–Ca2+–Man6GlcNAc2 glycan complex contains a single additional mannose residue (α1,6-mannose linkage shown as a white circle in upper diagram of D and as white sticks in D and F) that was added during secretion in the yeast recombinant host. Because this residue is not a part of the mammalian glycan structure in vivo and faces into the solvent in the GMIA–Ca2+–glycan complex, the glycan structure is referred to as a “GMIA–Ca2+–Man5GlcNAc2” complex throughout this paper. In the lower diagrams in C and D, two additional sets of glycan structural representations are shown with a 90° rotation to illustrate the differences in glycan structural positions. (E) A structural overlay of the Man9GlcNAc2 glycan from human ERManI in A and the Man5GlcNAc2 glycan from yeast ERManI in B demonstrating a close structural superimposition for the two glycan structures. (F) A structural overlay of the Man9GlcNAc2 glycan from GMIA in C and the Man6GlcNAc2 glycan from GMIA in D demonstrating that the glycan structural conformations in these two complexes are quite different and also are quite different from the corresponding ERManI–glycan complexes. Branch designations for the individual arms of the Man9GlcNAc2–glycan structure, based on the nomenclature shown in Fig. 1, are indicated in the figures.
Fig. 4.
Fig. 4.
Interactions with the glycan structures in the active sites of ERManI and GMIA. (A and B, Upper) Wall-eyed stereo diagrams of the glycans bound in the active sites of ERManI (A, cyan sticks) and GMIA (B, yellow sticks) are shown along with active-site residues (white sticks) that interact with the glycan structures. (A and B, Lower) LigPlot displays of the residues that interact with the respective glycans. Hydrogen bonds are indicated by green dotted lines in each panel. Monosaccharides in the glycan structures are labeled in purple using the nomenclature described in Fig. 1. Amino acid residues labeled in red are residues that were subjected to mutagenesis and time-course studies for glycan cleavage (Fig. S4 and Table S5). Other amino acid residues in the active-site cleft are labeled in black.
Fig. S3.
Fig. S3.
Hydrophobic interactions with bound glycans in the active site of GMIA. Hydrophobic stacking of W341 with NAG2 is indicated for the GMIA–Ca2+–Man5GlcNAc2 complex (1NXC) (20) (A) and between W339 and mannose residue M3 in the GMIA–La3+–Man9GlcNAc2 complex (B). The two protein structures were aligned, and the positions of the W339 and P340 residues were found to be essentially identical in the two complexes. W341 exhibits hydrophobic stacking interactions with NAG2 in the GMIA–Ca2+–Man5GlcNAc2 complex. However, W341 has rotated ∼180° in the GMIA–La3+–Man9GlcNAc2 complex to alleviate a steric clash with NAG2, and W339 stacks over the C5–C6 region of mannose residue M3 in the latter complex.
Fig. S4.
Fig. S4.
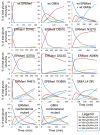
Time course of glycan digestion for wild-type and mutant forms of ERManI and GMIA. Wild-type and mutant forms of ERManI or GMIA were isolated and used in glycan digestion time-course studies with Man9GlcNAc2–PA as substrate. Individual time points in the digestion series were removed and subjected to NH2-HPLC as described in SI Materials and Methods. The relative abundance of Man9GlcNAc2–PA, Man8GlcNAc2–PA, Man7GlcNAc2–PA, Man6GlcNAc2–PA, and Man5GlcNAc2–PA structures in each time point was determined from the HPLC profiles, and glycan relative abundance was plotted versus digestion time. Enzyme sources are indicated in each time-course plot. Wild-type ERManI, wild-type GMIA, and a mixture of the two enzymes are shown in the three plots in the top row. Eight ERManI point mutants and a single-point mutant of GMIA are shown in the next three rows. The two plots in the bottom row show glycan digestion time-course plots for an ERManI combinatorial mutant containing equivalent residues swapped from GMIA and a combinatorial mutant of GMIA in which equivalent residues from ERManI were swapped into the GMIA sequence. Initial rate kinetic values for the enzymes are shown in Table S5. Details of the generation of the enzyme mutants and the glycan digestion time course are described in SI Materials and Methods.
Fig. S5.
Fig. S5.
HPLC separations of Man8GlcNAc2–PA isomers generated by wild-type and mutant forms of ERManI and GMIA. The peaks corresponding to Man8GlcNAc2–PA in the time-course studies were pooled and resolved by C18-HPLC as described in SI Materials and Methods. Man8GlcNAc2–PA isomer standards were used to identify the elution positions of the Man8A (A), Man8B (B), and Man8C (C) as indicated in the figure. Profiles are shown for wild-type ERManI, wild-type GMIA, the ERManI W389A mutant, the ERManI combinatorial mutant in which binding-cleft residues from ERManI were swapped for equivalent residues from GMIA, and an equivalent combinatorial mutant of GMIA in which equivalent residues from ERManI were swapped into the GMIA sequence. Details of generation of the enzyme mutants and the glycan digestion time course are described in SI Materials and Methods. The x axis is the elution time (in min) from the C18-HPLC column.
Fig. 5.
Fig. 5.
Summary of structural and mechanistic studies of mammalian GH47 α-mannosidases. (A) The sequential cleavage of Man9GlcNAc2-Asn to Man5GlcNAc2-Asn by ERManI and GMIA, in which each cleavage step requires the binding, cleavage, release, and subsequent conformational rearrangement of the glycan before binding to the enzyme in the next cleavage step. The structures of the glycan substrates are derived from the respective enzyme–glycan complexes and are depicted in 3D cartoon representations (50) in which Man residues (green spheres) and GlcNAc residues (blue cubes) are connected by glycosidic linkages (gray lines). Initial substrate interactions with a specific Man9GlcNAc2-Asn conformation in the ERManI glycan-binding cleft (step 1) result in the insertion of the terminal Manα1,2-Man disaccharide from the B branch into the −1/+1 catalytic subsites (enzymes are shown in A as gray surface representations). Residues that were not resolved in the respective enzyme–glycan complexes are shown in their anticipated positions in the structures (Man residues are shown as light green circles with dotted outlines and GlcNAc residues as light blue cubes with dotted outline). Following glycoside bond hydrolysis, the Man8GlcNAc2-Asn product and free Man residue must dissociate completely from the enzyme active site before conformational rearrangement and binding for the subsequent cleavage step. Conformational rearrangement leads to the insertion of branch A of the Man8GlcNAc2-Asn substrate in the GMIA glycan-binding cleft (step 2) with subsequent bond hydrolysis and dissociation of the Man7GlcNAc2-Asn product and the free Man residue. Similar conformational rearrangements lead to the binding of branch C of the Man7GlcNAc2-Asn substrate in step 3 and to the binding of branch A of the Man6GlcNAc2-Asn substrate to the GMIA glycan-binding cleft in step 4 (the structure of the bound complex is unknown). Each step in the cleavage series requires a different glycan structural conformation that is complementary to the geometry of the enzyme glycan-binding cleft. (B) The conformational distortion of the terminal mannose glycone residue upon binding to the active site and the enzymatic mechanism for all GH47 α-mannosidases. The dotted red box represents the proposed catalytic mechanism for bond hydrolysis by all GH47 α-mannosidases (including all ERManI and GMIA cleavage steps). Conformation distortion of the low free energy 4C1 ground state for the terminal α1,2-Man residue occurs as it enters the −1 subsite. Initial binding of the glycone in a 1C4 conformation is facilitated by hydrogen bonding, hydrophobic interactions (not shown), and coordination of the enzyme-bound Ca2+ ion with the glycone residue C2 and C3 hydroxyls. A conformational least-motion twist at C1 and the ring oxygen atom leads to a transient 3,0B/3S1 intermediate conformation followed by ring flattening to the 3H4 oxocarbenium ion transition state and release of the glycone in a 1C4 conformation. Deprotonation and attack of the glycosidic C1 by the hydroxide anion nucleophile (coordinated with the Ca2+ ion as a pronucleophile) leads to a change in coordination number from 8 to 7 for the cation. Release of the β-Man product into solution results in a conformational shift back to the low free energy 4C1 ground state.

Similar articles

Cited by

References

    1. Moremen KW, Tiemeyer M, Nairn AV. Vertebrate protein glycosylation: Diversity, synthesis and function. Nat Rev Mol Cell Biol. 2012;13(7):448–462. - PMC - PubMed
    1. Kornfeld R, Kornfeld S. Assembly of asparagine-linked oligosaccharides. Annu Rev Biochem. 1985;54:631–664. - PubMed
    1. Tannous A, Pisoni GB, Hebert DN, Molinari M. N-linked sugar-regulated protein folding and quality control in the ER. Semin Cell Dev Biol. 2015;41:79–89. - PMC - PubMed
    1. Lamriben L, Graham JB, Adams BM, Hebert DN. N-glycan-based ER molecular chaperone and protein quality control system: The calnexin binding cycle. Traffic. 2016;17(4):308–326. - PMC - PubMed
    1. Pisoni GB, Molinari M. Five questions (with their answers) on ER-associated degradation. Traffic. 2016;17(4):341–350. - PubMed

Publication types