

Evolution of association between renal and liver functions while awaiting heart transplant: An application using a bivariate multiphase nonlinear mixed effects model
- PMID: 27856959
- PMCID: PMC5433933
- DOI: 10.1177/0962280216678022
Evolution of association between renal and liver functions while awaiting heart transplant: An application using a bivariate multiphase nonlinear mixed effects model
Abstract
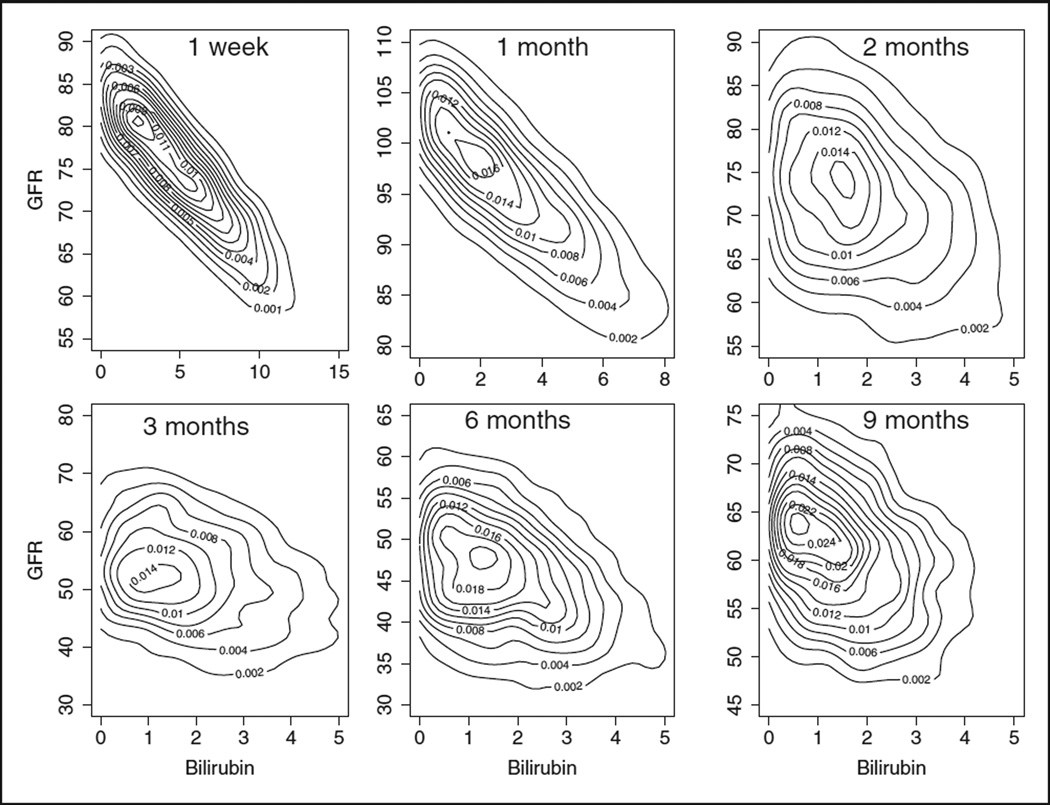
In many longitudinal follow-up studies, we observe more than one longitudinal outcome. Impaired renal and liver functions are indicators of poor clinical outcomes for patients who are on mechanical circulatory support and awaiting heart transplant. Hence, monitoring organ functions while waiting for heart transplant is an integral part of patient management. Longitudinal measurements of bilirubin can be used as a marker for liver function and glomerular filtration rate for renal function. We derive an approximation to evolution of association between these two organ functions using a bivariate nonlinear mixed effects model for continuous longitudinal measurements, where the two submodels are linked by a common distribution of time-dependent latent variables and a common distribution of measurement errors.
Keywords: Nonlinear model; additive regression; bivariate mixed effects model; evolution of correlation; mixed effects model; temporal decomposition.
Conflict of interest statement
The author(s) declared no potential conflicts of interest with respect to the research, authorship, and/or publication of this article.
Figures


References
-
- Mason DP, Rajeswaran J, Murthy SC, et al. Spirometry after transplantation: how much better are two lungs than one? Ann Thorac Surg. 2008;85:1193–1201. - PubMed
-
- Beckett LA, Tancredi DJ, Wilson RS. Multivariate longitudinal models for complex change processes. Stat Med. 2004;23:231–239. - PubMed
-
- Fieuws S, Verbeke G. Joint modeling of multivariate longitudinal profiles: pitfalls of the random-effect approach. Stat Med. 2004;23:3093–3104. - PubMed
-
- Fieuws S, Verbeke G, Molenbergs G. Random-effects models for multivariate repeated measures. Stat Methods Med Res. 2007;16:387–397. - PubMed
-
- O’Brian PC. Procedures for comparing samples with multiple endpoints. Biometrics. 1984;40:1079–1087. - PubMed
Publication types
MeSH terms
Grants and funding
LinkOut - more resources
Full Text Sources
Other Literature Sources
Medical
