. 2016 Nov 18:7:13353.
doi: 10.1038/ncomms13353.

Linear ubiquitin chain assembly complex coordinates late thymic T-cell differentiation and regulatory T-cell homeostasis

Affiliations

Linear ubiquitin chain assembly complex coordinates late thymic T-cell differentiation and regulatory T-cell homeostasis

Charis E Teh et al. Nat Commun. .

Abstract

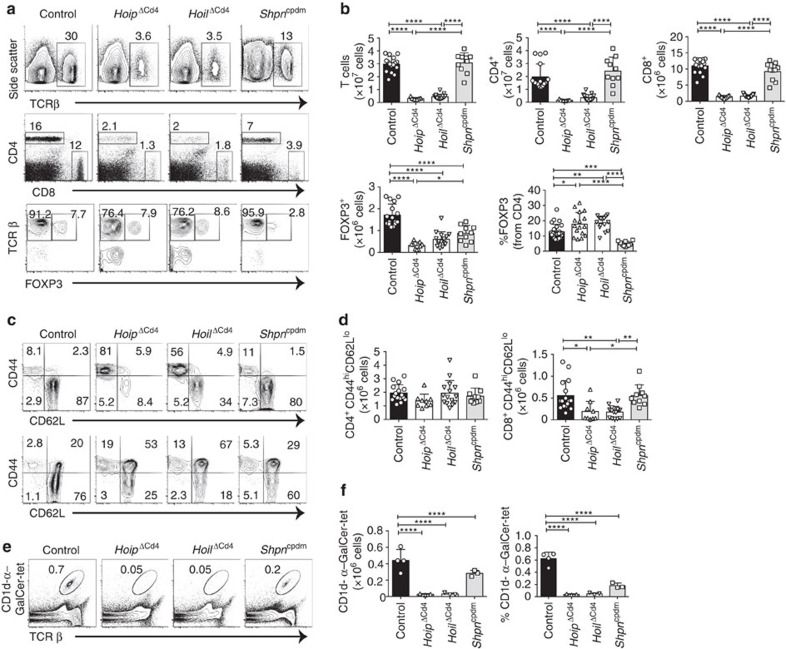
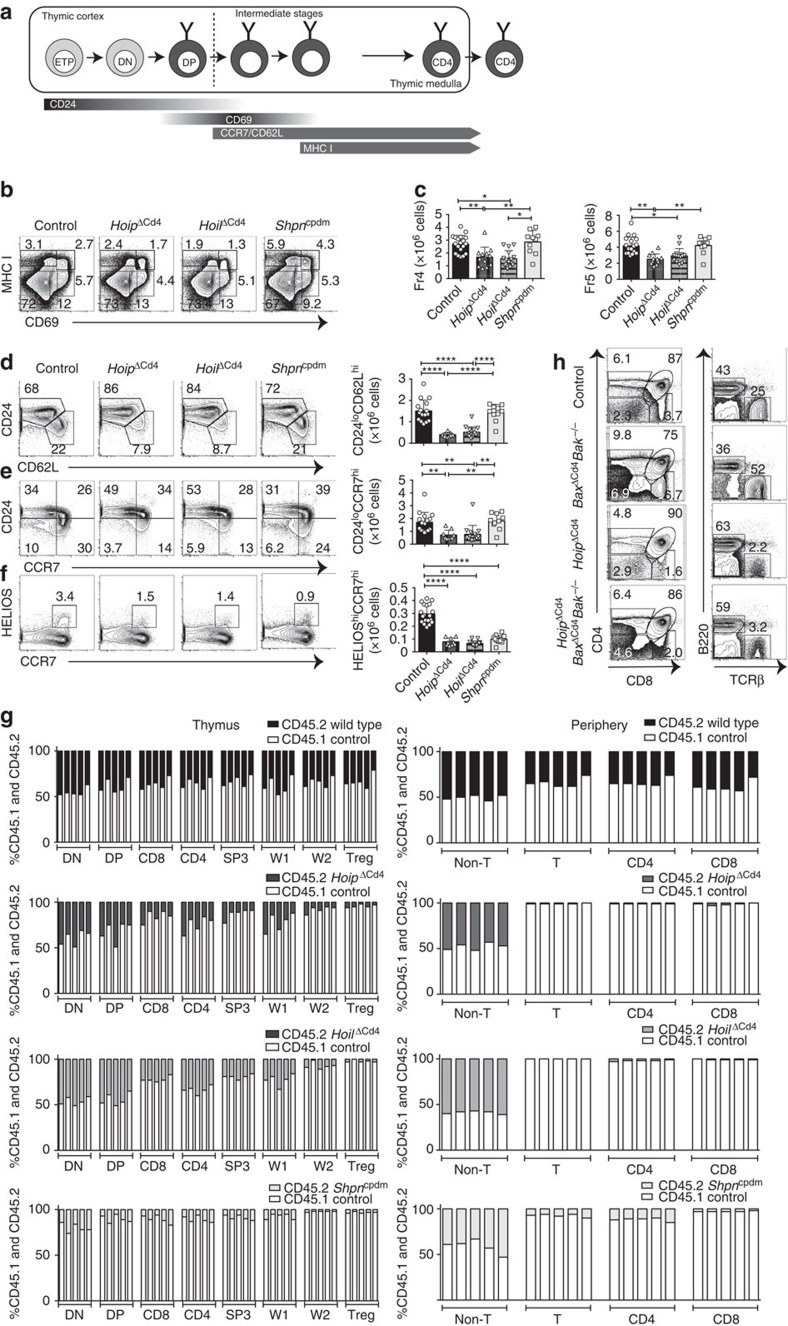
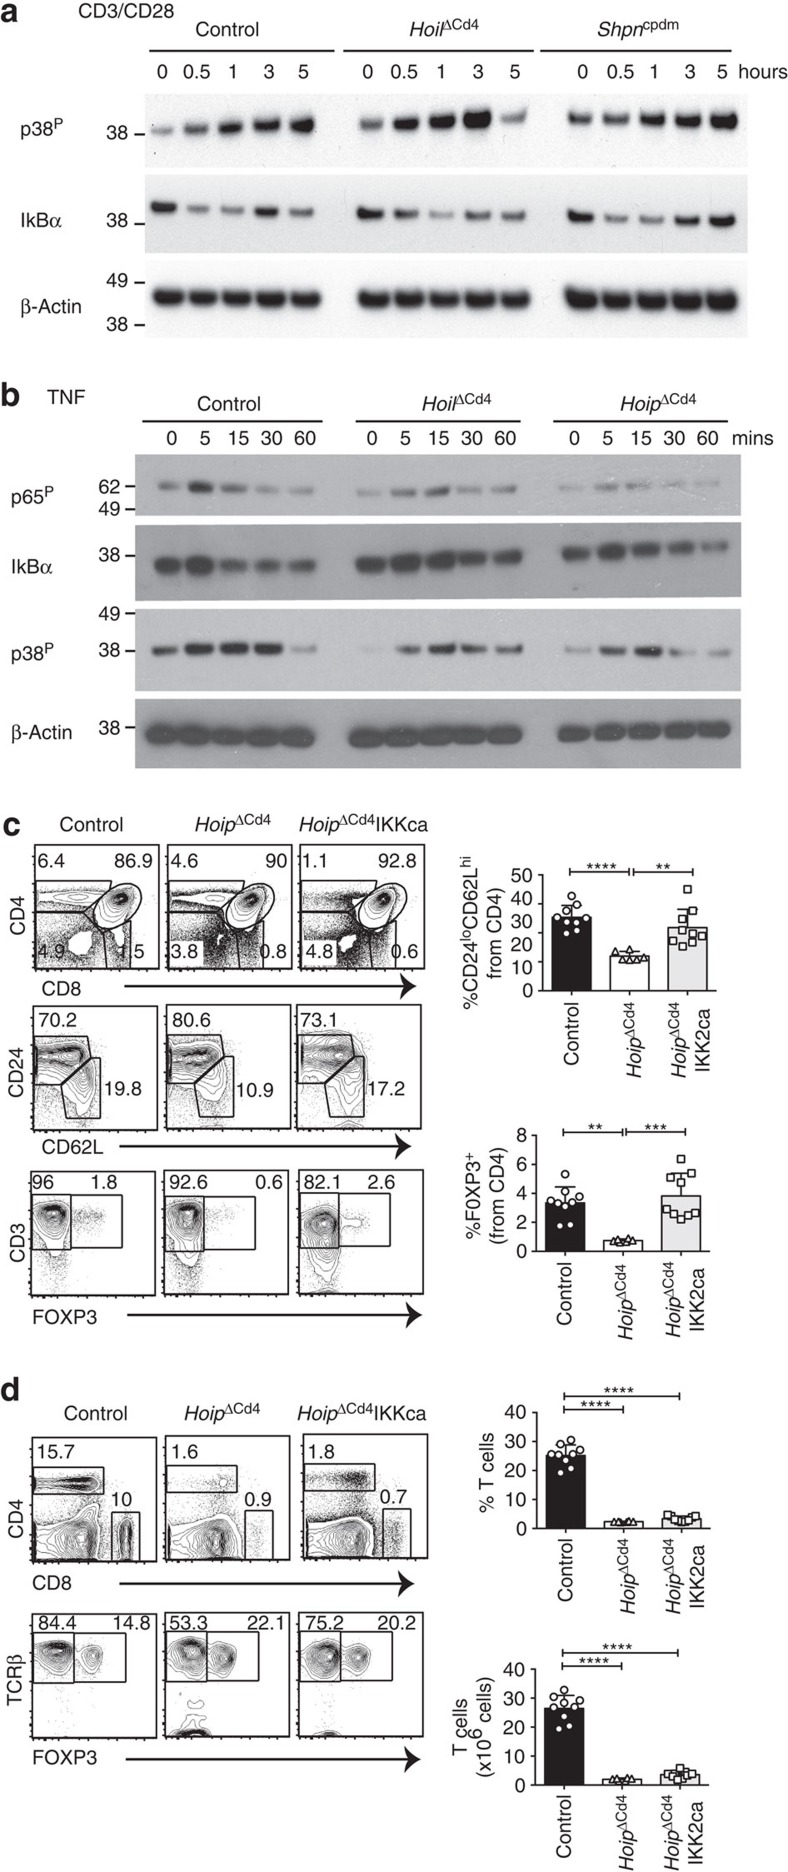
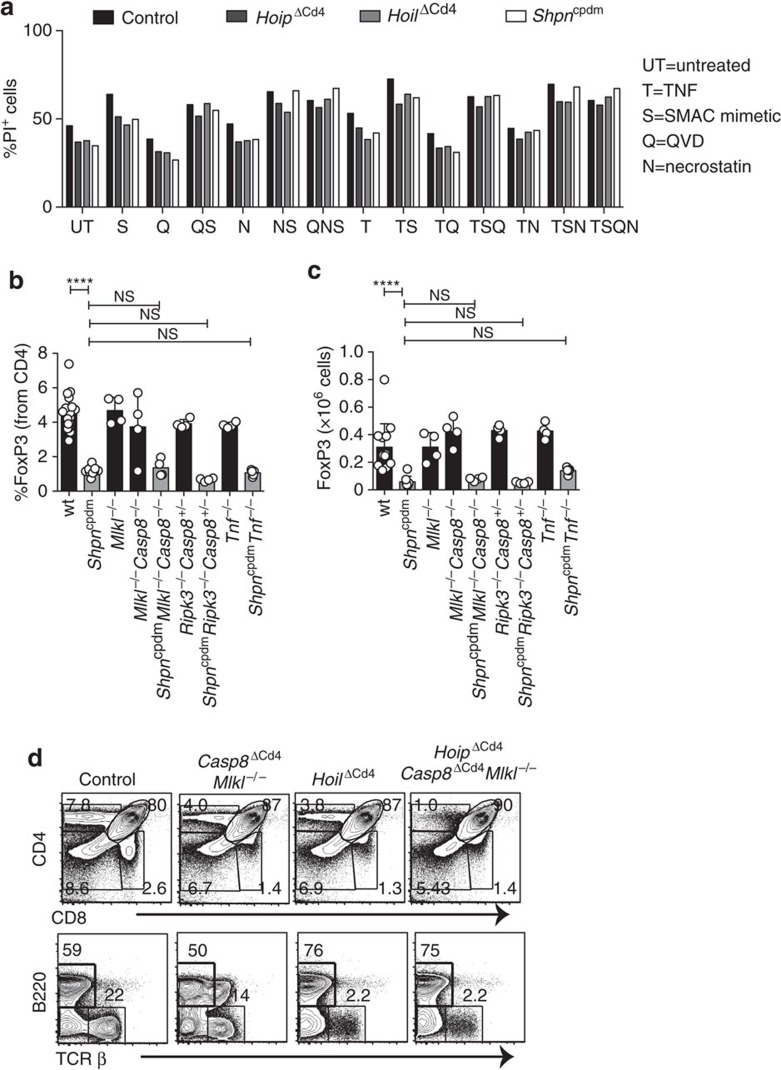
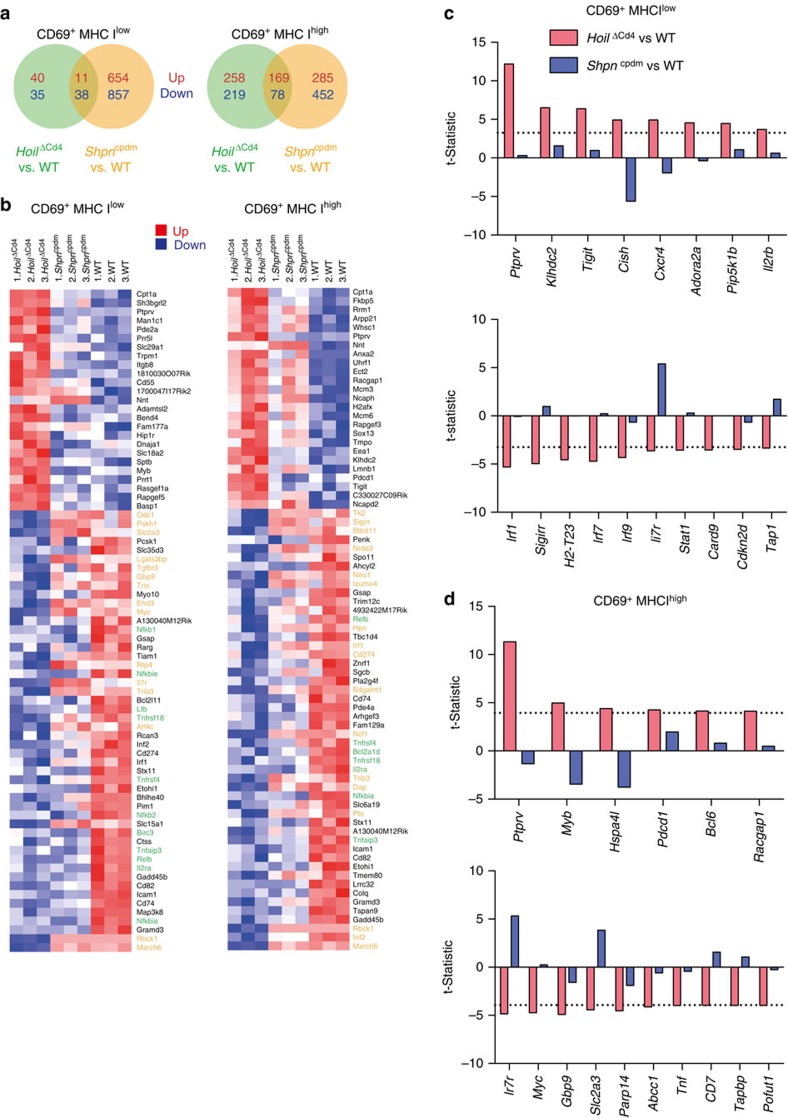
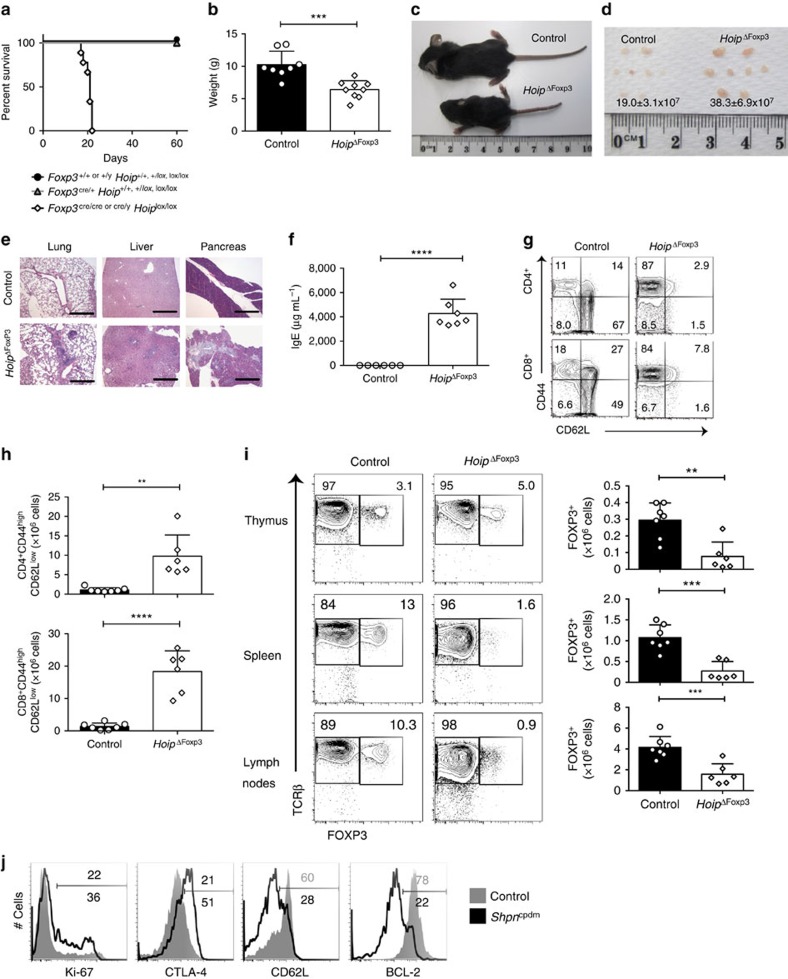
The linear ubiquitin chain assembly complex (LUBAC) is essential for innate immunity in mice and humans, yet its role in adaptive immunity is unclear. Here we show that the LUBAC components HOIP, HOIL-1 and SHARPIN have essential roles in late thymocyte differentiation, FOXP3+ regulatory T (Treg)-cell development and Treg cell homeostasis. LUBAC activity is not required to prevent TNF-induced apoptosis or necroptosis but is necessary for the transcriptional programme of the penultimate stage of thymocyte differentiation. Treg cell-specific ablation of HOIP causes severe Treg cell deficiency and lethal immune pathology, revealing an ongoing requirement of LUBAC activity for Treg cell homeostasis. These data reveal stage-specific requirements for LUBAC in coordinating the signals required for T-cell differentiation.


Figures

Figure 1
Figure 1. Absence of HOIP or HOIL-1 causes T-cell deficiency.
(a) Flow cytometry of splenic cells from 7- to 15-week-old control, HoipΔCd4, HoilΔCd4 and Sharpincpdm assessed for expression of TCRβ (top panels), CD4 and CD8 (middle panels), and for FOXP3, after gating on CD4+ cells (bottom panels). (b) Quantification of CD4+CD8+TCRβ+ and CD4+FOXP3+ cells in the spleen. (c) Surface expression of CD44 and CD62L on CD4+FOXP3 (top panels) and CD8+ T cells (bottom panels) in spleens of control, HoipΔCd4, HoilΔCd4 and Sharpincpdm mice. (d) Absolute numbers of CD44highCD62Llow activated cells in the CD4+FOXP3 (left graph) and CD8+ (right graph) populations from the spleens of controls, HoipΔCd4, HoilΔCd4 and Sharpincpdm mice. (e) Flow cytometry of splenic CD1d-αGalCer tetramer-positive NKT cells from 7- to 15-week-old control, HoipΔCd4, HoilΔCd4 and Sharpincpdm mice. (f) Total cell numbers and percentages of CD1d-α-galactosylceramide (α-GalCer) tetramer-positive NKT cells in the spleen. For b,d and f, each symbol represents an individual mouse; small horizontal lines indicate mean±s.d.; *P<0.05, **P<0.01, ***P<0.005 and ****P<0.001, respectively. One-way analysis of variance with a Tukey's post-hoc test for multiple comparisons was used for statistical analysis. Shpncpdm refers to Sharpincpdm mice. Data are pooled from six independent experiments with two to six mice per group (ad) or representative of two independent experiments with three to six mice per group (e,f).
Figure 2
Figure 2. Thymic T-cell differentiation in LUBAC-deficient mice.
(a) Surface staining of CD4 and CD8 (upper panels), and FOXP3 and CD25 (lower panels) on thymocytes from 7- to 15-week-old control, HoipΔCd4, HoilΔCd4 and Sharpincpdm mice. (b) Quantification of total cell numbers and percentages of CD4+ CD8+ and FOXP3+ thymocytes. (c) Flow cytometric analysis of thymic CD1d-αGalCer tetramer-positive NKT cells from 7- to 15-week-old control, HoipΔCd4, HoilΔCd4 and Sharpincpdm mice. (d) Total cell numbers and percentages of CD1d-αGalCer tetramer-positive NKT cells in the spleen. For b and d, each symbol represents an individual mouse; small horizontal lines indicate mean±s.d.; *P<0.05, **P<0.01, ***P<0.005 and ****P<0.001, respectively. One-way analysis of variance with a Tukey's post-hoc test for multiple comparisons was used for statistical analysis. Shpncpdm refers to Sharpincpdm mice. Data are pooled from six independent experiments with two to six mice per group (a,b) or representative of two independent experiments with four to six mice per group (c,d).
Figure 3
Figure 3. SP thymocyte differentiation and survival in LUBAC-deficient mice.
(a) Schematic representation of CD4+ T-cell development in the thymus. Earliest thymic progenitor (ETP) cells undergo progressive differentiation from DN to DP to single-positive (CD4 or CD8) cell. The different stages of thymocyte development are also accompanied by changes in CD24, CD62L, CCR7, CD69 and MHC I (H2-Kb) surface marker expression on the differentiating thymocyte. (b) Flow cytometric analysis of the surface expression of MHC I (H2-Kb) versus CD69 on whole thymocytes from 7- to 15-week-old control, HoipΔCd4, HoilΔCd4 and Sharpincpdm mice. (c) Quantification of total cell numbers and percentages of Fraction 4 (MHC Ihigh CD69high) and Fraction 5 (MHC Ihigh CD69low) populations for control, HoipΔCd4, HoilΔCd4 and Sharpincpdm mice. Surface expression of CD24 versus CD62L (d), CD24 versus CCR7 (e), Helios versus CCR7 (f) gated on CD4SP from 7- to 15-week-old control, HoipΔCd4, HoilΔCd4 and Sharpincpdm mice. Right, cell numbers of the mature CD24low CD62Lhigh, CD24low CCR7high and HELIOShigh CCR7high from CD4SP cells. (g) Contribution to different thymic T cell subsets in 50:50 mixed bone marrow chimeras 8 weeks after reconstitution. Columns show percentage of WT CD45.1+ (white bar) and CD45.2+ control, HoipΔCd4, HoilΔCd4 and Sharpincpdm (black bar) cells in individual chimeric mice. DN; CD4CD8, DP; CD4+CD8+ SP3; CD4+CD24lowCCR7high, W1; CD4+CCR7low,HELIOS+, W2; CD4+CCR7high,HELIOS+, Treg; CD4+FOXP3+. Each bar represents an individual mouse. (h) Surface expression of CD4 and CD8 on whole thymocytes (upper panels) and B220 and TCRβ on splenocytes (lower panels) from control, BaxΔCd4Bak−/−, HoipΔCd4 and HoipΔCd4BaxΔCd4Bak−/− mice. For c,d,e and f, each symbol represents an individual mouse; small horizontal lines indicate mean±s.d.; *P<0.05, **P<0.01, ***P<0.005 and ****P<0.001, respectively. One-way analysis of variance with a Tukey's post-hoc test for multiple comparisons was used for statistical analysis. Shpncpdm refers to Sharpincpdm mice. Data are pooled from six independent experiments with two to six mice per group (bf) or representative of two independent experiments with four to six mice per group (g), or representative of two independent experiments with one to five mice per group (h).
Figure 4
Figure 4. Perturbed TCR or TNFR signalling in LUBAC-deficient thymocytes.
Immunoblot analysis of phosphorylated (activated) p38, phosphorylated (activated) p65 or total IκBα from thymocytes left unstimulated (0) or stimulated with anti-CD3/CD28 for 0.5, 1, 3 or 5 h (a) or with TNF for 5, 15, 30 or 60 min (b). (c) Surface staining of CD4 and CD8 (upper panels), CD24 and CD62L gated on CD4+ cells (middle panels), CD3 and FOXP3 gated on CD4+ cells (lower panels) and numerical quantification of thymocytes from 7- to 15-week-old control, HoipΔCd4 and HoipΔCd4IKKca mice. (d) Surface expression of CD4 and CD8 (upper panels), TCRβ and FOXP3 (lower panels) on splenocytes from control, HoipΔCd4 and HoipΔCd4IKKca mice. For a and b, data are representative of two independent experiments with one mouse per group. For c and d, each symbol represents an individual mouse; small horizontal lines indicate mean±s.d.; *P<0.05, **P<0.01, ***P<0.005 and ****P<0.001, respectively. One-way analysis of variance with a Tukey's post-hoc test for multiple comparisons was used for statistical analysis. Data are pooled from three independent experiments with two to five mice per group (c,d).
Figure 5
Figure 5. Inhibition of cell death in LUBAC-deficient thymocytes.
(a) Cell death determined by PI uptake in thymocytes from control, HoipΔCd4, HoilΔCd4 and Sharpincpdm mice cultured for 24 h with combinations of agonists (T: 100 ng ml−1 TNF; S: 500 nM SMAC mimetic; Q:10 μM QVD-OPh;N: 10 μM necrostatin). Percentages (b) and absolute numbers (c) of CD4+FOXP3+ cells in the thymus of WT (n=18), Sharpincpdm (n=11), Mlkl−/− (n=4), Mlkl−/−Casp8−/− (n=4), SharpincpdmCasp8−/−Mlkl−/− (n=4), Rip3k−/−Casp8+/− (n=4), SharpincpdmRip3k−/−Casp8+/− (n=4), Tnf−/− (n=4) and SharpincpdmTnf−/− (n=5) mice. Shpncpdm refers to Sharpincpdm mice. (d) Surface expression of CD4 and CD8 on whole thymocytes from control, Casp8ΔCd4Mlkl−/−, HoilΔCd4 and HoipΔCd4Casp8Δcd4Mlkl−/−mice. Data are representative of two independent experiments with one mouse per genotype (a,d). For b and c, each symbol represents an individual mouse, with 4–14 mice per group; small horizontal lines indicate mean±s.d.; *P<0.05, **P<0.01, ***P<0.005 and ****P<0.001, respectively. One-way analsyis of variance with a Tukey's post-hoc test for multiple comparisons was used for statistical analysis.
Figure 6
Figure 6. Transcriptional impact of LUBAC deficiency on T-cell differentiation.
(a) Venn diagrams of the numbers of genes upregulated (red) or downregulated (blue) in comparisons of CD69+ MHC Ilow or CD69+ MHC Ihigh thymocytes from HoilΔCd4 versus WT (green) and Sharpincpdm versus WT (orange) at a 5% false discovery rate (FDR) cutoff. (b) Heatmaps of individual log-expression values. Left plot shows the 25 most upregulated genes and 50 most downregulated genes for HoilΔCd4 versus WT in CD69+ MHC Ilow thymocytes. Right plot show the same for CD69+ MHC Ihigh. Genes are ordered by P-value. Red indicates relatively higher expression and blue indicates relatively lower expression. Genes highlighted in green are involved in NF-κB signalling, those in yellow are involved in thymocyte/Treg cell differentiation. Shpncpdm refers to Sharpincpdm mice. (c,d) Genes that are differentially expressed in HoilΔCd4 versus WT but show no change or opposite change in Sharpincpdm. Results for CD69+ MHC Ilow thymocytes are shown in c and CD69+ MHC Ihigh thymocytes in d. The plot shows the limma t-statistics for each gene for assessing differential expression; the dotted line indicates the 5% FDR cutoffs of t=3.25 for c and t=3.94 for d.
Figure 7
Figure 7. LUBAC is required for peripheral Treg cell homeostasis and tolerance.
(a) Kaplan–Meyer survival curve measured from birth to 60 days for mice of the indicated genotypes (P<0.0001 using the log-ranked Mantel–Cox test). (b) Weights of 18–22-day-old male and female HoipΔFoxp3 mice and healthy littermate controls. (c) Runted appearance and (d) lymphadenopathy observed in HoipΔFoxp3 mice, with mean cell number indicated. (e) Representative hematoxylin and eosin (haematoxylin and eosin) stained sections of lung, liver and pancreas of 21-day-old mice of the indicated genotypes (scale bars, 500 μm). (f) Plasma IgE concentrations in 18–22-day-old HoipΔFoxp3 mice and healthy littermate controls. (g) Expression of CD44 and CD62L on CD4+FOXP3 (top panel) and CD8+ T cells (bottom panel) in spleens of WT and HoipΔFoxp3 mice. (h) Absolute numbers of CD44highCD62Llow activated cells in the CD4+FOXP3 and CD8+ population of WT and HoipΔFoxp3 mice. (i) Representative flow cytometry plots and absolute numbers of FOXP3+TCRβ+ cells in the thymus (top panel), spleen (middle panel) and lymph nodes (bottom panel) of WT and HoipΔFoxp3 mice. (j) Expression of Ki-67, CTLA-4, CD62L and BCL-2 in CD4+FOXP3+ cells in the spleen from WT (grey shaded histogram) and Sharpincpdm (black thick histogram) mice. Shpncpdm refers to Sharpincpdm mice. (n=6–9 per /genotype, bar graphs show mean±s.d.). *P<0.05, **P<0.01, ***P<0.005 and ****P<0.001, respectively. One-way analysis of variance with a Tukey's post-hoc test for multiple comparisons was used for statistical analysis. Data are pooled from (a,b,f,g,h) or representative (ce) of three independent experiments with one to three mice per group.

References

    1. Mingueneau M. et al. The transcriptional landscape of alphabeta T cell differentiation. Nat. Immunol. 14, 619–632 (2013). - PMC - PubMed
    1. McCaughtry T. M., Wilken M. S. & Hogquist K. A. Thymic emigration revisited. J. Exp. Med. 204, 2513–2520 (2007). - PMC - PubMed
    1. Hogquist K. A., Xing Y., Hsu F. C. & Shapiro V. S. T cell adolescence: maturation events beyond positive selection. J. Immunol. 195, 1351–1357 (2015). - PMC - PubMed
    1. Tani-ichi S. et al. Interleukin-7 receptor controls development and maturation of late stages of thymocyte subpopulations. Proc. Natl acad. Sci. USA 110, 612–617 (2013). - PMC - PubMed
    1. Xing Y., Wang X., Jameson S. C. & Hogquist K. A. Late stages of T cell maturation in the thymus involve NF-kappaB and tonic type I interferon signaling. Nat. Immunol. 17, 565–573 (2016). - PMC - PubMed

Publication types

MeSH terms