. 2016 Nov 18:7:13418.
doi: 10.1038/ncomms13418.

Lineage-specific roles of the cytoplasmic polyadenylation factor CPEB4 in the regulation of melanoma drivers

Affiliations

Lineage-specific roles of the cytoplasmic polyadenylation factor CPEB4 in the regulation of melanoma drivers

Eva Pérez-Guijarro et al. Nat Commun. .

Abstract

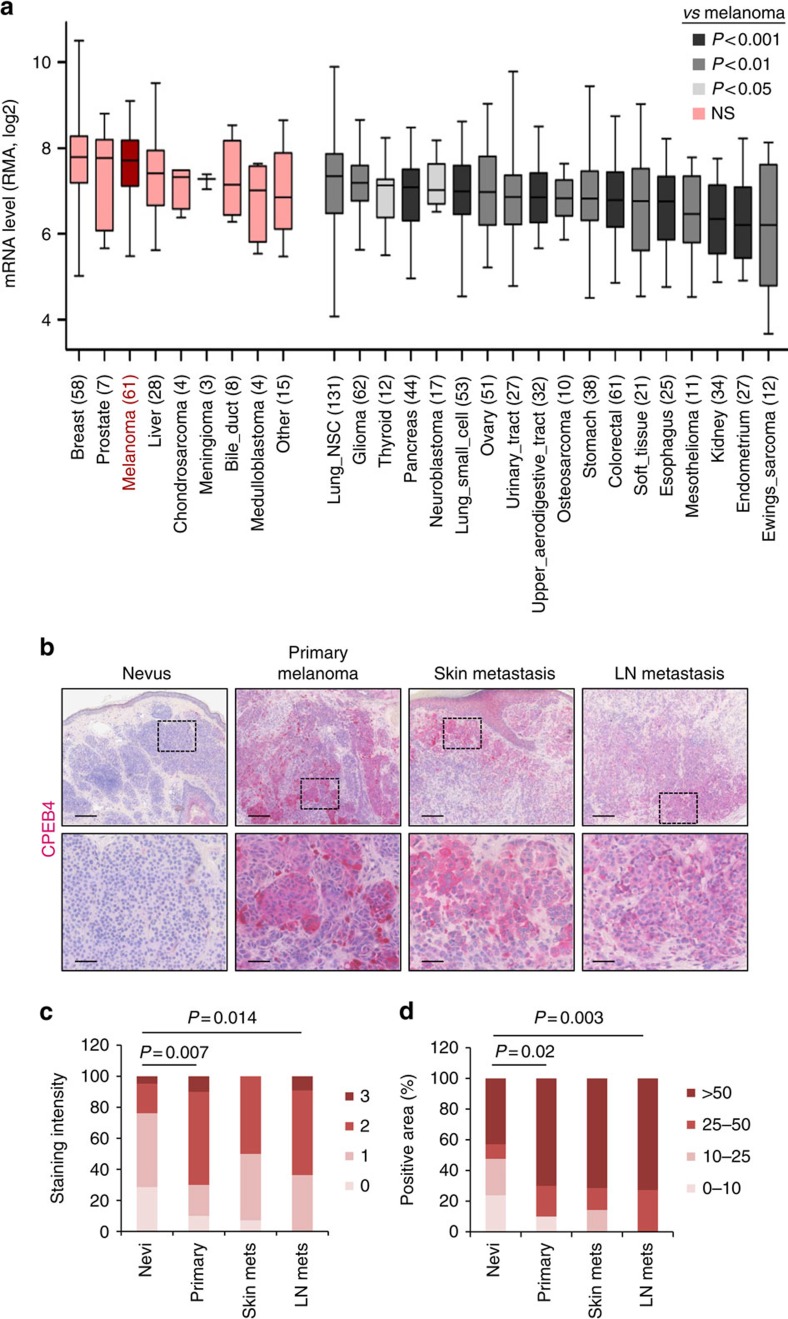
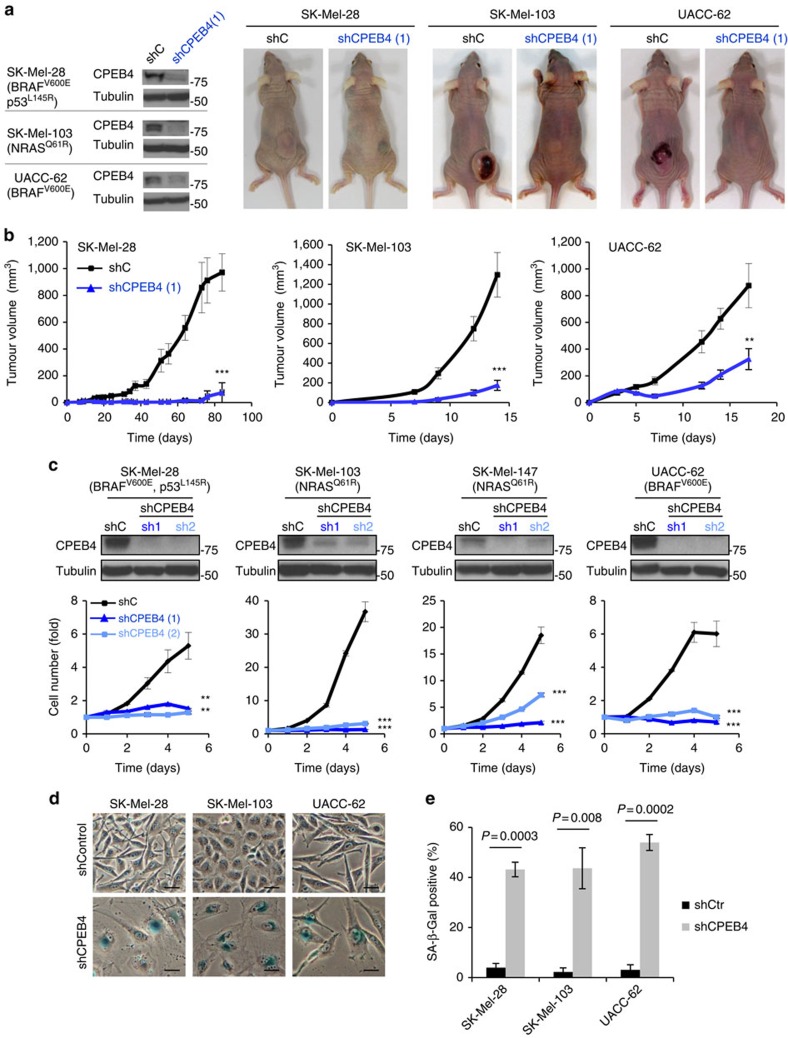
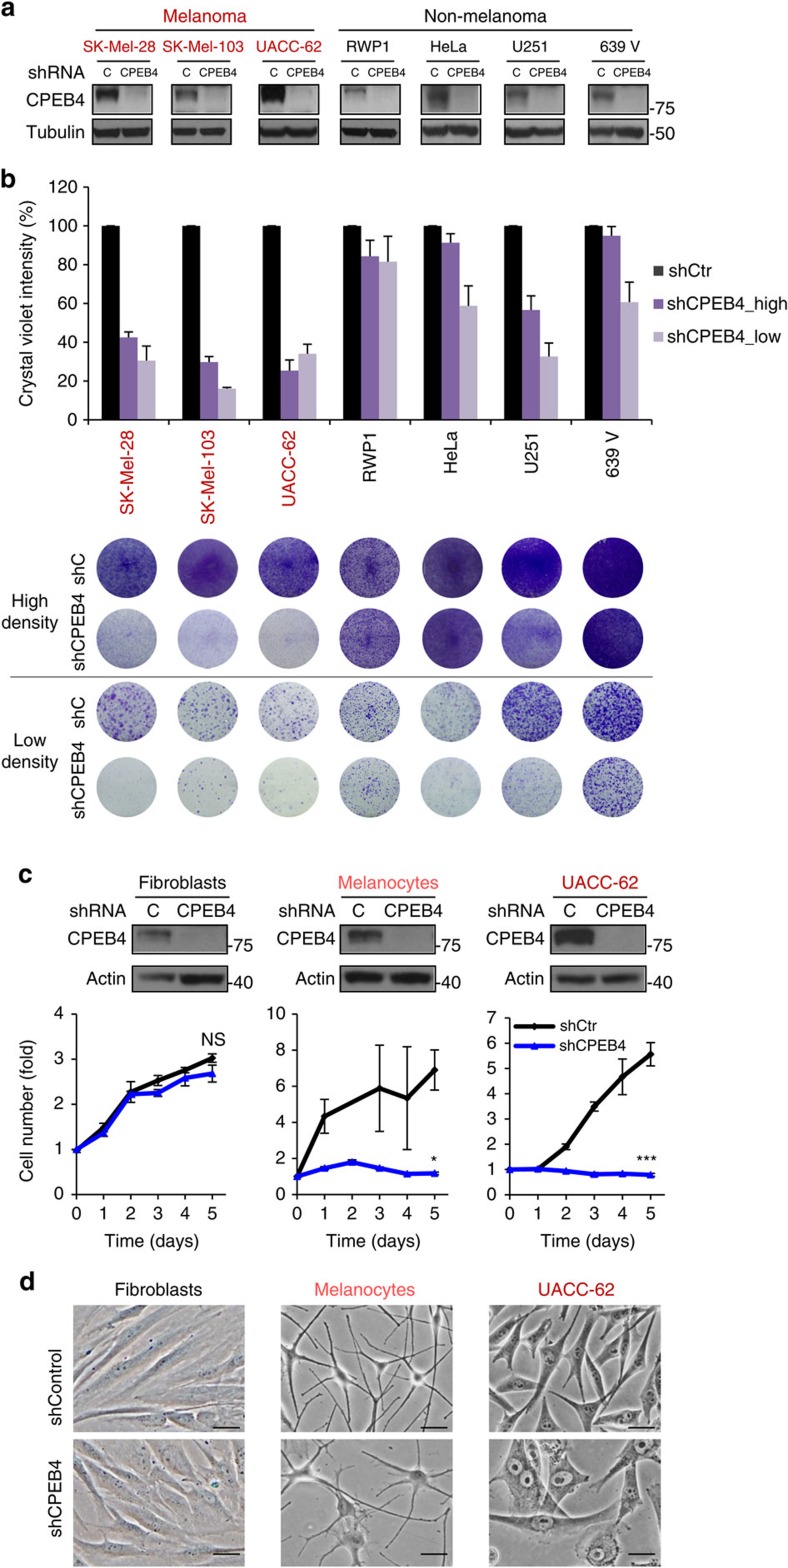
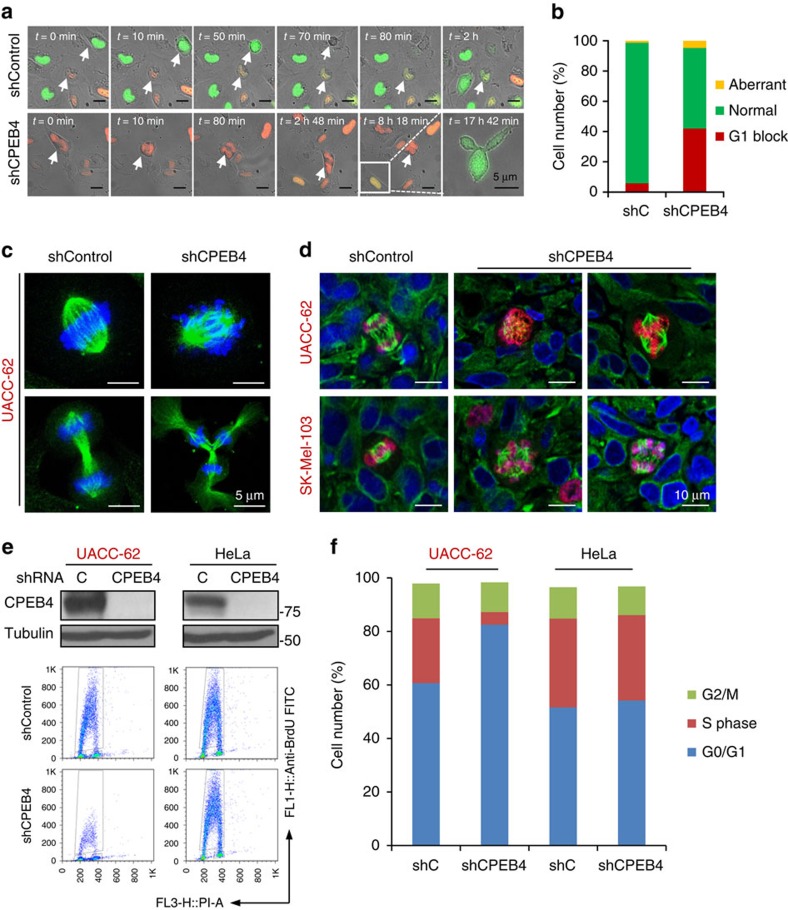
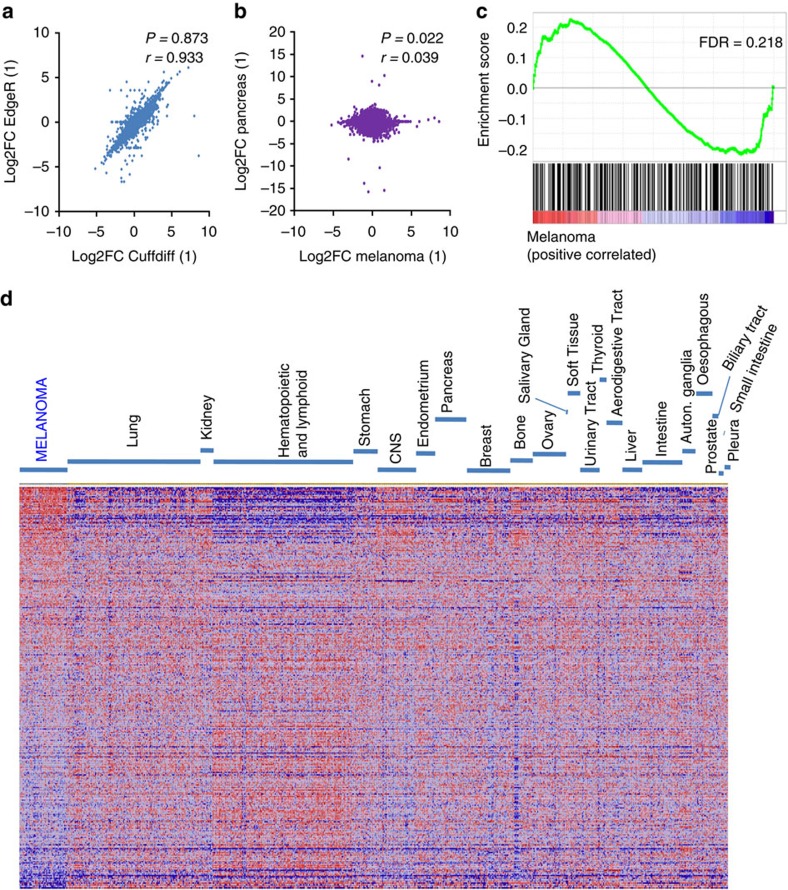
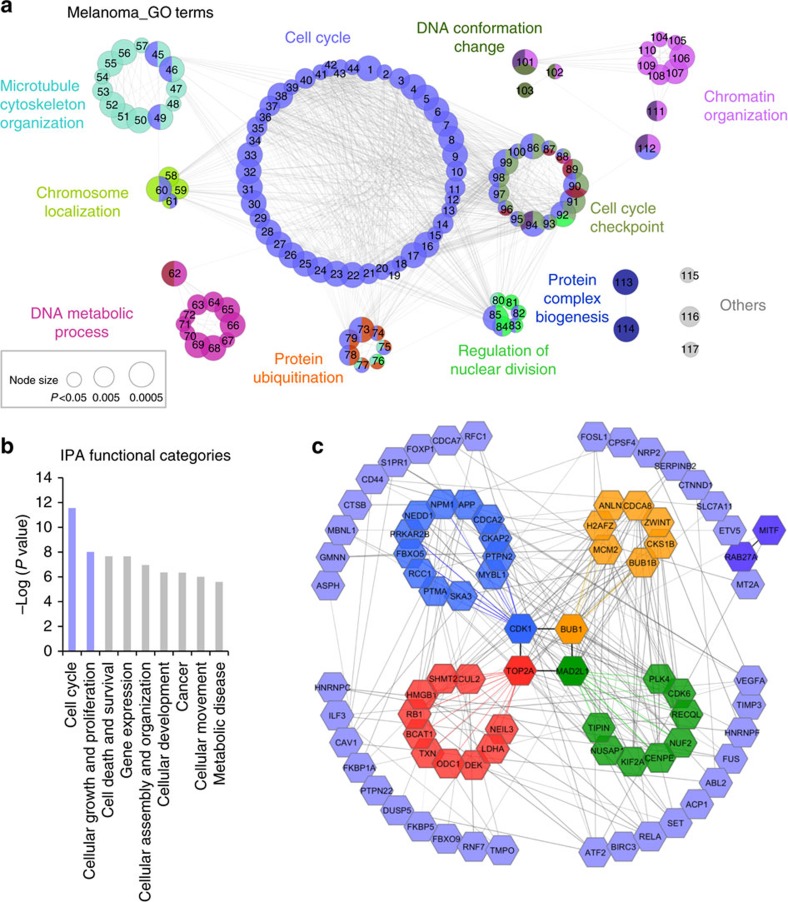
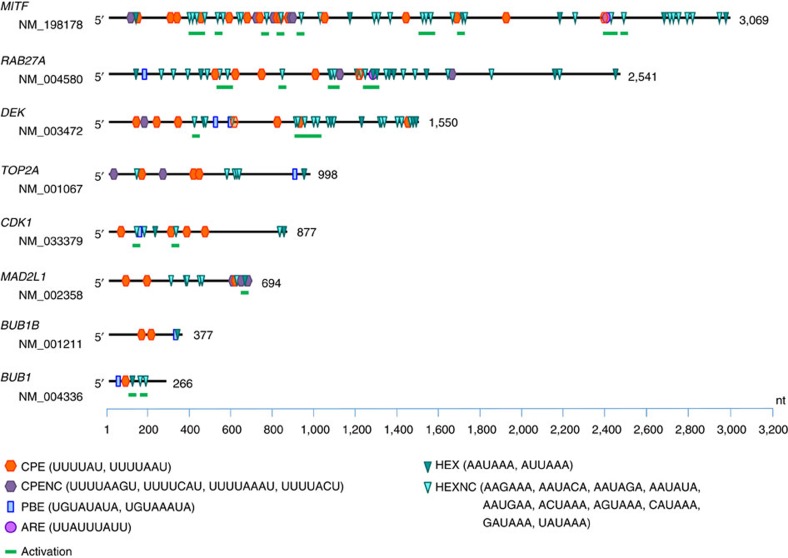
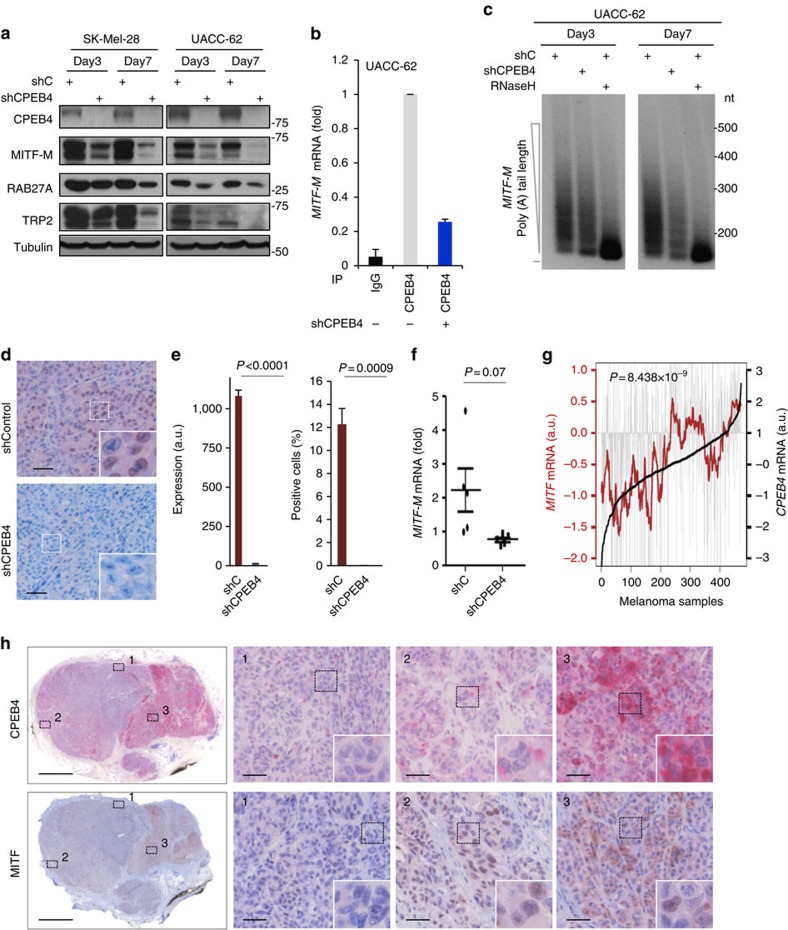
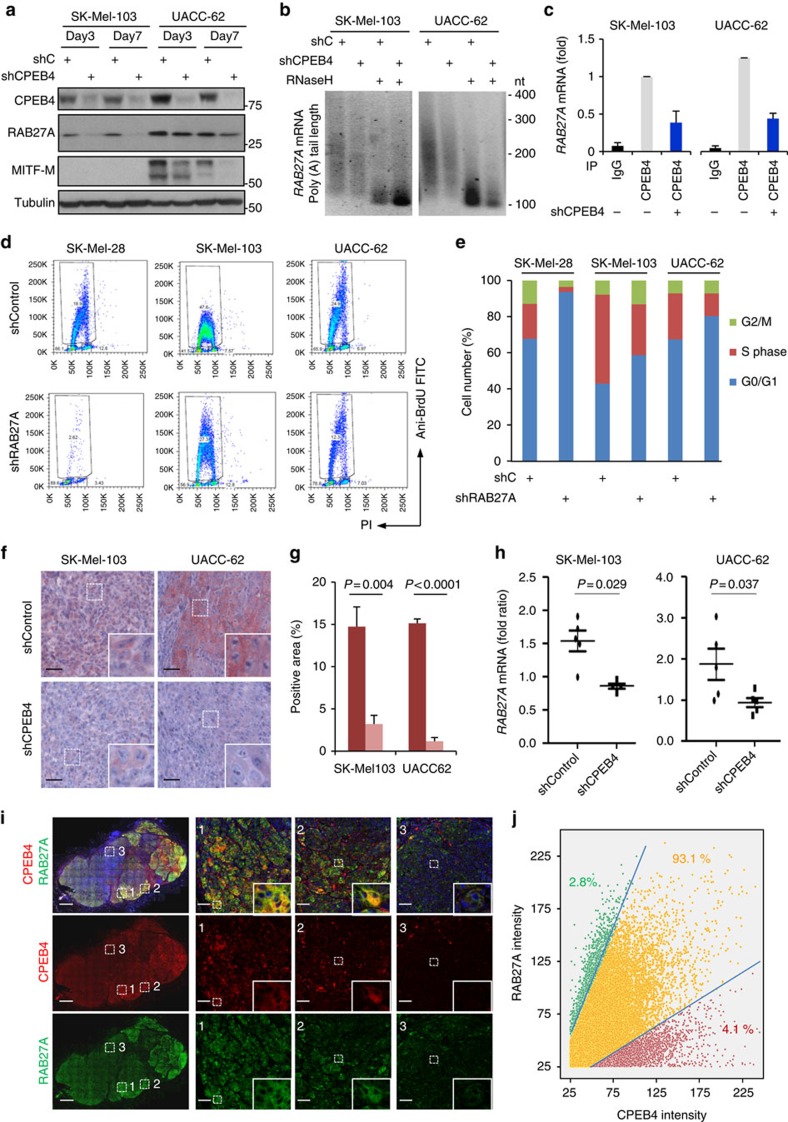
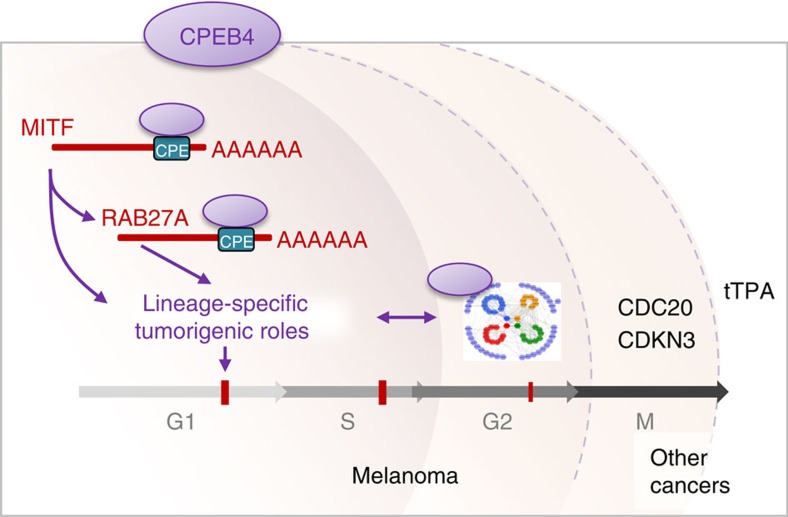
Nuclear 3'-end-polyadenylation is essential for the transport, stability and translation of virtually all eukaryotic mRNAs. Poly(A) tail extension can also occur in the cytoplasm, but the transcripts involved are incompletely understood, particularly in cancer. Here we identify a lineage-specific requirement of the cytoplasmic polyadenylation binding protein 4 (CPEB4) in malignant melanoma. CPEB4 is upregulated early in melanoma progression, as defined by computational and histological analyses. Melanoma cells are distinct from other tumour cell types in their dependency on CPEB4, not only to prevent mitotic aberrations, but to progress through G1/S cell cycle checkpoints. RNA immunoprecipitation, sequencing of bound transcripts and poly(A) length tests link the melanoma-specific functions of CPEB4 to signalling hubs specifically enriched in this disease. Essential in these CPEB4-controlled networks are the melanoma drivers MITF and RAB7A, a feature validated in clinical biopsies. These results provide new mechanistic links between cytoplasmic polyadenylation and lineage specification in melanoma.


Figures

Figure 1
Figure 1. CPEB4 is induced at early stages of melanoma development.
(a) CPEB4 mRNA expression in 27 solid tumours including melanoma extracted from the CCLE data set (CCLE_Expression_Entrez_2012-10-18.res). mRNA levels are normalized by inter-sample variability across the cell lines included in the data set (RMA-Log2). The number of cell lines from each cancer type is indicated in parenthesis. Box colours represent the P-values from pairwise comparisons between melanoma and each tumour type. (b) Representative micrographs of sections from the indicated lesions showing CPEB4 staining in pink. Nuclei are counterstained with hematoxylin. Scale bars, 200 μm (upper images); and 50 μm (lower images). (c) Quantification of CPEB4 staining intensity in the indicated lesion type scored from 0 (negative) to 3 (highest). The number of lesions per category is indicated in Supplementary Methods. (d) Percentage of CPEB4-positive cells in melanoma lesions (four independent areas were analysed by stained specimen, using hematoxylin as a reference to estimate total cell number per section; epidermal and stromal cells were excluded from the analysis). χ2-test P values (P) are indicated. NS, non-significant.
Figure 2
Figure 2. Essential cell-autonomous role of CPEB4 in melanoma growth.
(a) Representative examples of animals subcutaneously implanted with SK-Mel-28, SK-Mel-103 or UACC-62 cells expressing control shRNA (shC) or CPEB4 shRNA (sh1). Key melanoma-associated mutations in the indicated cell lines are listed in parenthesis. Panels on the left correspond to immunoblots for visualization of the efficiency of the CPEB4 shRNA-depleting constructs in the different cell lines. (b) Differential tumour growth upon subcutaneous implantation of cells in immunosuppressed mice in a. N=5 mice per group. (c, upper) Depletion of CPEB4 in the indicated cell lines upon lentiviral-driven transduction of two validated shRNA for CPEB4 (sh1 and sh2) shown by immunoblotting using cells expressing a shRNA control (shC) as a reference. (lower) Melanoma cell proliferation after transduction of control or CPEB4 shRNAs. Graphs depict relative cell numbers at the indicated time points obtained from three independent experiments in triplicate. (d) Representative images of SA-β-Gal staining (blue) of the indicated melanoma cell lines expressing control or CPEB4 shRNAs. Scale bars, 20 μm. (e) Percentage of SA-β-Gal-positive cells from d. Error bars represent s.e.m. from three independent experiments. Student's t-test and ANOVA P values are indicated or represented as ***P<0.001, **P<0.01. ANOVA, analysis of variance.
Figure 3
Figure 3. Increased sensitivity of melanoma cells to CPEB4 depletion.
(a) Immunoblots showing CPEB4 levels upon transduction of control or CPEB4 shRNAs in a panel of melanoma (red) and non-melanoma (black) cell lines. (b) Colony formation assays of the indicated tumour cell lines seeded at high or low density (5 × 10⁴ or 2–4 × 10³ cells, respectively). Bar graphs correspond to cell number estimated by crystal violet staining and represented with respect to shC-transfected cells. Data are plotted as means±s.e.m. of three independent experiments in duplicate. (c) Depletion of CPEB4 (by shRNA) in genetically matched pairs of human skin fibroblasts and melanocytes visualized by immunoblotting (upper) with respect to shC-transduced cells. The human melanoma cell line UACC-62 is included as a reference. Data are represented as means±s.e.m. of two experiments in triplicate. (d) Micrographs showing morphological changes driven by shCPEB4 in primary fibroblasts, melanocytes and UACC-62 melanoma cells. Scale bars, 20 μm (unless otherwise indicated). ***P<0.001, *P<0.05. NS, non-significant.
Figure 4
Figure 4. Cell cycle defects in CPEB4-depleted melanoma.
(a) Time-lapse analysis of aberrant mitosis in cell line SK-Mel-103 labelled with RFP-Cdt1 and GFP-Geminin fusion proteins (FUCCI system) and transduced with control or CPEB4 shRNAs (see Supplementary Movies 1 and 2 for real time imaging of this process in shC- and shCPEB4-transduced cells, respectively). (b) Quantification of cells undergoing normal or aberrant mitosis or blocked in G1 from experiments shown in a. (c) Confocal imaging of mitotic alterations of cultured UACC-62 melanoma cells expressing control or CPEB4 shRNA. DNA and spindles were visualized by DAPI (blue) and α-Tubulin (green) immunofluorescence, respectively. (d) Aberrant mitosis detected by confocal immunomicroscopy in xenografts generated with UACC-62 or SK-Mel-103 cells expressing control or CPEB4 shRNAs. Proliferating cells were identified by phospho-Histone 3 (red immunofluorescence). DAPI (blue) and α-Tubulin (green) were used to label DNA and spindles, respectively. (e) Cell cycle profiles of UACC-62 and HeLa cells infected with lentiviruses coding for control or CPEB4 shRNA (see depletion in the immunoblots of the upper panels). Shown are flow cytometry plots of the indicated cells processed to visualize BrdU incorporation. (f) Distribution of the indicated cell populations at the different phases of the cell cycle. The percentages of cells at the G0/G1, S or G2/M phases were determined by BrdU and PI staining.
Figure 5
Figure 5. RIP-Seq (RNA immunoprecipitation-sequencing) for the identification of CPEB4 targets in melanoma.
(a) Correlated results of Cuffdiff or EdgeR-based analysis of CPEB4 RIP-seq analyses in SK-Mel-103, using shCPEB4-derivatives as a reference. This comparison was performed in two independent replicates. Graph depicts differential expression changes (Log2 fold change, Log2FC) obtained with each method for replicate (1). Replicate (2) is shown in Supplementary Fig. 5c. (b) Differential expression of CPEB4-bound mRNAs in SK-Mel-103 versus the RWP1 pancreatic cancer cell line. RIP-seq data from RWP1 was obtained from ref. and analysed as for melanoma cells by Cuffdiff. Two replicates were processed for each cell line. Data in this panel correspond to Replicate (1) of melanoma and pancreatic cancers. Other replicates are depicted in Supplementary Fig. 5d. (c) Relative expression of CPEB4-bound mRNAs identified by RIP-seq in SK-Mel-103 cells and mined by GSEA across the CCLE data set. Graph represents the enrichment score in melanoma versus other tumours. Positive correlated genes in melanoma and negatively correlated in other tumours are highlighted in red and blue, respectively. (d) Heatmap from the GSEA analysis shown in c, represented for each of the indicated tumour cell types. Note the distinct clustering in melanoma. Pearson coefficient (P), Spearman rank correlation coefficient (r) and FDR values are indicated in the corresponding panels.
Figure 6
Figure 6. RIP-Seq identifies cell cycle regulators and lineage-specific oncogenes as novel CPEB4 targets.
(a) Interaction networks of the GO-terms (database 02.10.2015) enriched in the CPEB4-bound transcripts identified by RIP-seq in SK-Mel-103. Data were plotted using Cytoscape v3.2.1 and the ClueGO plug-in v2.1.7 (see GO-terms networks of RWP1 pancreatic cell line in Supplementary Fig. 6a). Numbers correspond to GO-gene sets further described in Supplementary Data 2. Node sizes represent the statistical significance of the terms (***P<0.0005; **P<0.005; *P<0.05). Supplementary Data 2 contains detailed information on the CPEB4-bound transcripts and the specific genes in the 117 identified clusters. Supplementary Data 3 lists GO-enriched categories for CPEB4-bound targets in RWP1 pancreatic cancer cells to demonstrate the minimum overlap with the melanoma SK-Mel-103. (b) IPA of functional categories enriched in CPE-containing transcripts identified by CPEB4 RIP-Seq in SK-Mel-103. (c) Protein–protein interaction network of the genes included in the IPA ‘cell cycle' and ‘cellular growth and proliferation' clusters of b analysed by STRING and Cytoscape for the visualization of signalling hubs recognized by CPEB4 in melanoma cells (see Supplementary Fig. 7 for validation of selected CPEB4 direct targets).
Figure 7
Figure 7. 3′-UTR map of CPEB4 targets.
Schematic representation of binding sites for cytoplasmic polyadenylation-associated factors located at the 3′-UTR of selected CPEB4 targets identified by RIP-seq in melanoma cells. The content and combination of these binding sites were identified and analysed by the customized algorithm described in ref. for the prediction of their potential regulation by cytoplasmic polyadenylation. ARE, AU-rich element; CPE, cytoplasmic polyadenylation element; CPENC, non-consensus CPE; HEX, polyadenylation hexanucleotide; HEXNC, non-consensus hexanucleotide; PBS, Pumilio-binding site.
Figure 8
Figure 8. CPEB4-driven control of the lineage-specific transcription factor MITF.
(a) Impact of CPEB4 depletion (by shRNA) on the protein levels of MITF and the indicated targets shown by immunoblotting in two independent melanoma cell lines. (b) Relative levels of MITF mRNA immunoprecipitated with antibodies for CPEB4 or rabbit IgG in UACC-62. Cells transduced with shCPEB4 were set as a reference for specificity. mRNA levels were normalized against expression in the inputs (that is, parental or shCPEB4-expressing cells) and are represented as means±s.e.m. from triplicates. (c) PAT (polyadenylation length test) of MITF 3′-UTR in shC or shCPEB4-transduced melanoma cells. RNase H was used for poly(A) tail removal to define the specificity of the amplification procedure as previously described. (d) Paraffin embedded sections of mouse xenografts generated with UACC-62 expressing shC or shCPEB4, and processed for immunohistochemical detection of MITF protein (brown signal). Nuclei were co-stained by hematoxylin. Scale bars, 50 μm. (e) Bar graphs depicting the staining intensity and fraction of MITF-positive cells per section in xenografts generated as in d. Data are represented as means±s.e.m. from N=5 tumours per group. (f) Relative expression of MITF mRNA in xenografts generated as in d determined by quantitative qRT-PCR. (g) MITF and CPEB4 mRNA expression in 471 melanoma specimens from the TCGA database. Melanomas are ranked by expression of CPEB4 (from left to right), which is represented by the black line. Grey lines indicate MITF expression in each sample and the moving average is represented by the red line. P value of Spearman correlation analyses is indicated. (h) Immunohistochemical detection of CPEB4 (pink) and MITF (brown) in consecutive sections of a representative metastatic melanoma specimen. Shown are three areas with low (1), intermediate (2) and high (3) CPEB4 staining. Note the parallel expression of both proteins. Stainings were repeated in five independent specimens obtaining similar results. Scale bars, 200 μm (left images); and 50 μm (right images). Student's t-test P values (P) are indicated in the corresponding panels.
Figure 9
Figure 9. RAB27A as a novel CPEB4-controlled melanoma driver.
(a) Immunoblots showing the downregulation of RAB27A protein expression in MITF-negative (SK-Mel-103) and MITF-positive (UACC-62) cell lines at the indicated times upon lentiviral-driven expression of control or CPEB4 shRNA. (b) RAB27A mRNA Poly(A) tail shortening visualized by PAT assays in CPEB4-depleted melanoma cells. RNase H was used as a reference control for poly(A) removal. nt, nucleotides. (c) RAB27A mRNA levels from RIP experiments performed with CPEB4 antibody or IgG control antibody in the indicated melanoma cells. Inputs were used to normalize mRNA expression in the immunoprecipitated fraction and data are presented as means±s.e.m. from triplicates. (d) BrdU incorporation in the indicated melanoma cell lines visualized by flow cytometry 4 days after lentiviral-driven expression of control or RAB27A shRNA. The corresponding cell cycle distribution is shown in e. (f) Micrographs of paraffin-embedded sections of xenografts generated with the indicated cell lines expressing shC or shRNA against CPEB4, and processed for the visualization of RAB27A (pink staining). Nuclei are counterstained with hematoxylin. Scale bars, 50 μm. (g) Quantification of RAB27A expression represented as a function of positive cells. (h) RAB27A mRNA downregulation determined by quantitative qRT-PCR in xenografts generated as in f. (i) Mosaic image corresponding to dual immunohistochemistry performed on human melanoma tumours (whole-lesion analysis) and visualized by confocal microscopy for single-cell quantification of CPEB4 (red) and RAB27A (green). Scale bars, 1,000 μm. Images in the right correspond to higher magnification of three selected areas of the lesion (labelled as 1, 2 and 3; scale bars, 100 μm) demonstrating the correlation between these two proteins. (j) Relative expression of CPEB4 and RAB27A quantified at a single-cell level by an intelligent matrix screening remote control tool (iMSRC) from images processed by the Definiens XD software. Data points were pseudo-coloured to separate cells with dual expression of CPEB4 and RAB27A (yellow) from those with dominance of one of the two proteins (green for RAB27A and red for CPEB4). Student's t-test P values (P) are indicated in the corresponding panels. iMSRC, intelligent matrix screening remote control.
Figure 10
Figure 10. Proposed mode of action of CPEB4 in melanoma.
Summary of newly identified roles of CPEB4 on lineage-specific melanoma drivers (MITF and RAB27), superseding a cohesive network of G2/M cell cycle modulators, both distinct from targets described in pancreatic cancer (the only other tumour type where CPEB4 function has been analysed as here, in a genome-wide manner).

References

    1. Di Giammartino D. C., Nishida K. & Manley J. L. Mechanisms and consequences of alternative polyadenylation. Mol. Cell 43, 853–866 (2011). - PMC - PubMed
    1. Weill L., Belloc E., Bava F. A. & Mendez R. Translational control by changes in poly(A) tail length: recycling mRNAs. Nat. Struct. Mol. Biol. 19, 577–585 (2012). - PubMed
    1. Mendez R. & Richter J. D. Translational control by CPEB: a means to the end. Nat. Rev. Mol. Cell Biol. 2, 521–529 (2001). - PubMed
    1. D'Ambrogio A., Nagaoka K. & Richter J. D. Translational control of cell growth and malignancy by the CPEBs. Nat. Rev. Cancer 13, 283–290 (2013). - PubMed
    1. Fernandez-Miranda G. & Mendez R. The CPEB-family of proteins, translational control in senescence and cancer. Ageing Res. Rev. 11, 460–472 (2012). - PubMed

Publication types