Clinical Trial
. 2016 Nov 18:6:36596.
doi: 10.1038/srep36596.

Assessment of Circulating LncRNAs Under Physiologic and Pathologic Conditions in Humans Reveals Potential Limitations as Biomarkers

Affiliations
Clinical Trial

Assessment of Circulating LncRNAs Under Physiologic and Pathologic Conditions in Humans Reveals Potential Limitations as Biomarkers

Kenny Schlosser et al. Sci Rep. .

Abstract

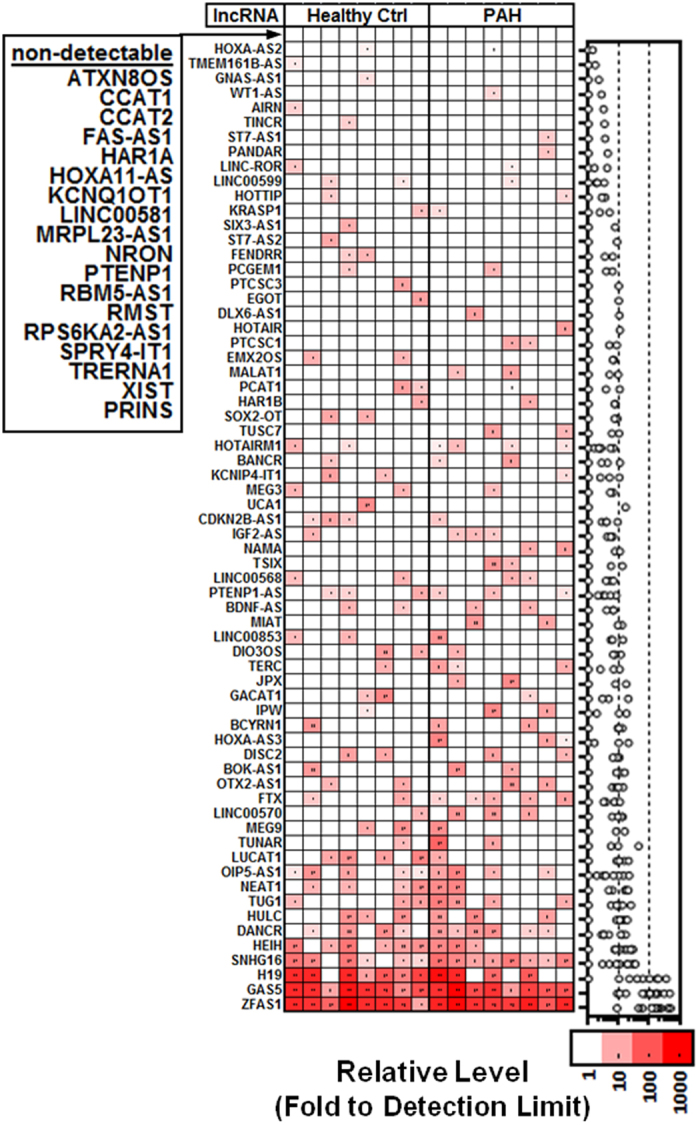
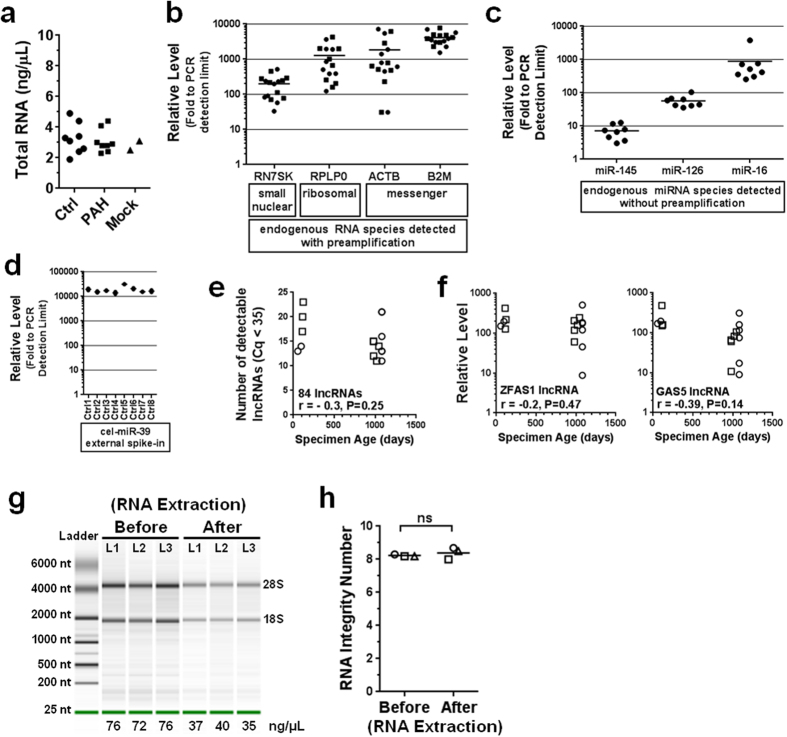
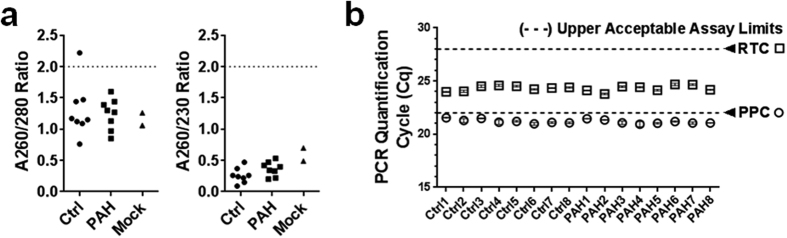
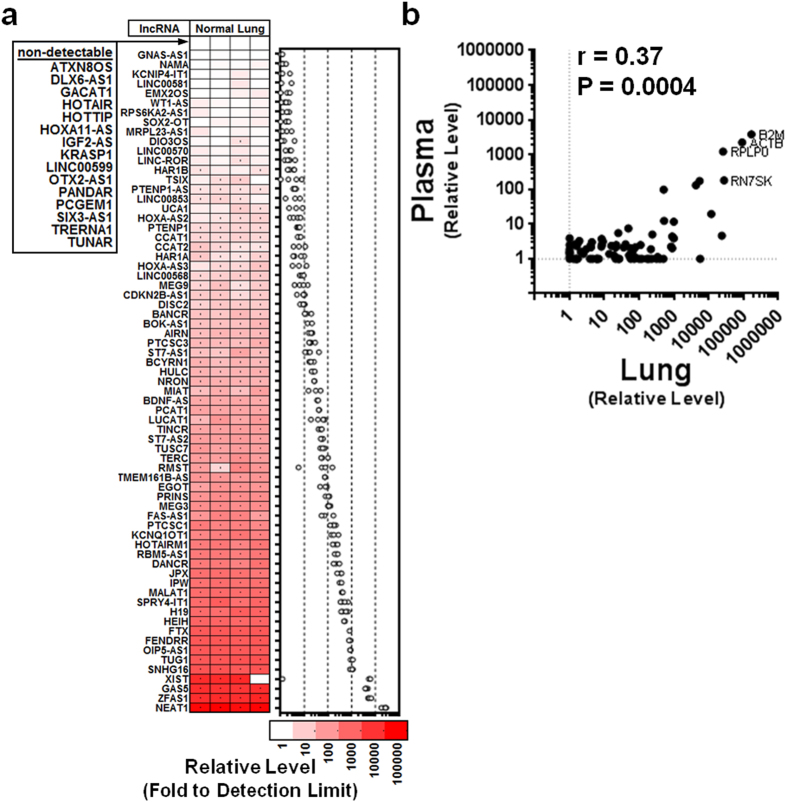
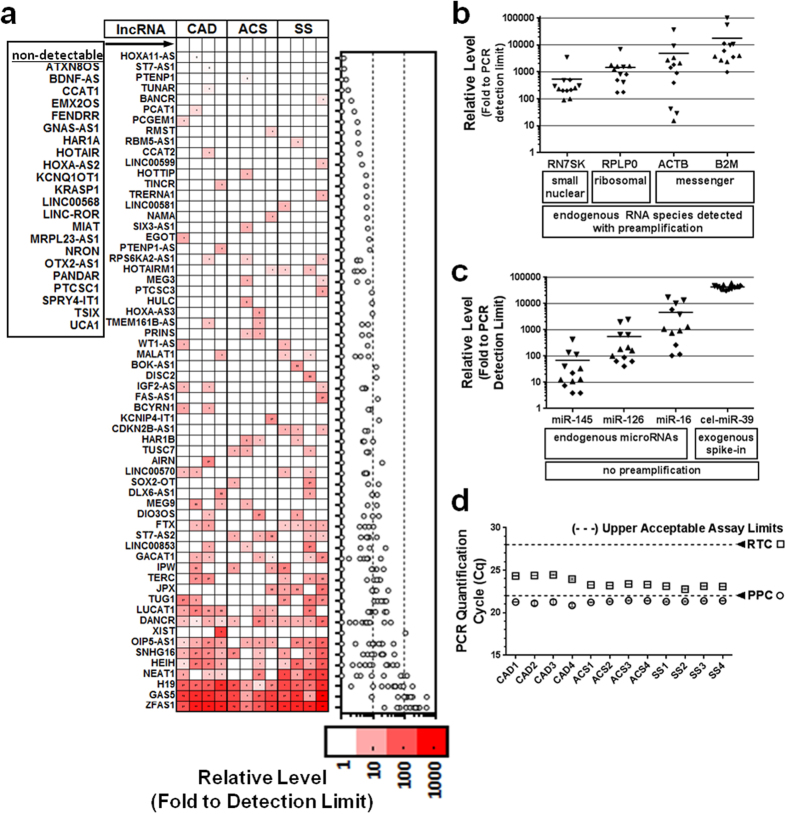
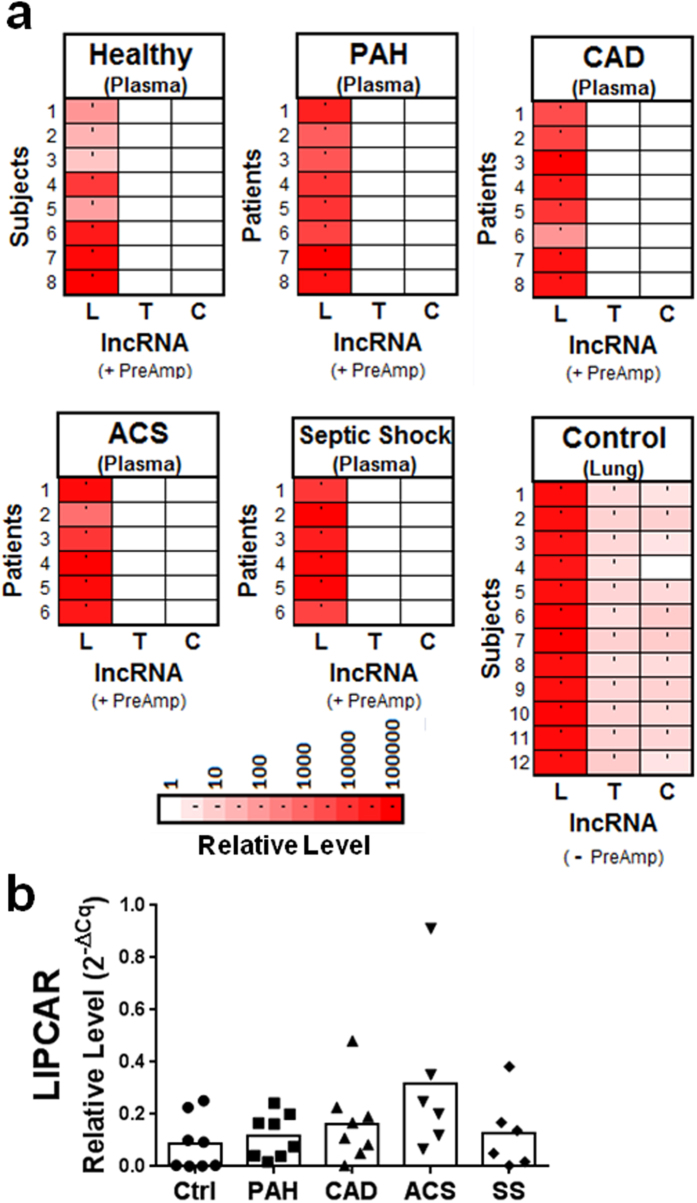
Long non-coding RNAs (lncRNA) are a new class of regulatory molecules with diverse cellular functions. Recent reports have suggested that extracellular lncRNAs are detectable in human plasma and may serve as biomarkers. Here, we sought to investigate circulating lncRNAs as potential biomarkers for pulmonary arterial hypertension (PAH). Eighty-four lncRNAs, representing some of the most abundant and functionally relevant candidates identified in cellular studies, were assessed via RT-qPCR in plasma from PAH and healthy subjects. However, despite preamplification, the majority of lncRNAs were surprisingly undetectable or sporadically detectable, and showed no differential changes. Systematic characterization of plasma/RNA quality and technical performance via internal and external controls revealed no evidence of RNA degradation or RT-qPCR inhibition, and most lncRNAs were robustly detectable in pulmonary tissue. In plasma, lncRNA levels were the lowest among several different RNA species examined, and this was generalizable to other chronic and acute vascular conditions including coronary artery disease, acute coronary syndrome, and septic shock. In addition, two of three previously reported circulating lncRNA biomarker candidates were not detectable in any of the plasma samples. This study reveals new insight on the relative levels of lncRNAs in circulation, which has important implications for their potential development as biomarkers.


Figures

Figure 1
Figure 1. Low and sporadic lncRNA detection in PAH and healthy subject plasma.
Heatmap showing color coded relative lncRNA plasma levels expressed fold to the PCR detection limit (Cq = 35; Relative Level = 1) after log transformation. Each column represents a unique subject and each row represents a different lncRNA, which have been arranged arbitrarily in ascending (mean) abundance. LncRNAs that were not detected in any subjects are listed next to the heatmap. Right graph shows relative lncRNA levels of individual subjects (circles).
Figure 2
Figure 2. Characterization and confirmation of RNA quality.
(a) Concentration of total RNA extracted from plasma as measured by Nanodrop spectrophotometry. Two mock RNA extractions performed with ddH2O instead of plasma, highlight the lower limit of detection. (b) Relative levels of other endogenous plasma RNA species that were extracted and measured in parallel using the same pre-amplification and RT-PCR platform as the lncRNAs. (c) Relative levels of several representative miRNAs that were detected without pre-amplification from the same extracted total RNA. (d) A fixed quantity of synthetic 22 nt miRNA mimic (cel-miR-39) with no homology to mammalian miRNAs was spiked into plasma samples just after chemical denaturation of the endogenous RNases. Relative levels are shown for duplicate measurements in eight control subjects. (e) No significant correlation observed between the age of plasma specimens and the number of detected lncRNAs. Pearson correlation coefficient and p-value are shown. (f) No significant correlation observed between plasma specimen age and two specific lncRNAs that were detectable in all subjects. (g) Agilent bioanalzyer electropherogram showing fragment patterns of RNA derived from three different lung tissue specimens (L1-L3) before and after mock RNA extractions. 18s and 28s ribosomal bands are indicated. (h) Agilent bioanalyzer RNA integrity numbers are shown for each RNA sample (L1-L3) before and after the mock extractions. Integrity levels vary from 0 (highly degraded) to 10 (highly intact). Circles denote control subjects and squares denote PAH patients.
Figure 3
Figure 3. Internal reverse transcription and PCR positive controls confirm no appreciable reaction inhibition, despite low absorbance ratios.
(a) At low RNA concentrations, typical UV absorbance ratios are not representative of RNA purity. For comparison, 2 mock RNA extractions performed with ddH2O instead of plasma are shown. (b) The reverse transcription control (RTC) and positive PCR control (PPC) are fixed quantities of synthetic RNA (with no homology to eukaryotic sequences) and DNA molecules that were integrated into the reverse transcription and PCR reactions of each subject, respectively, and quantified in parallel with the lncRNAs. Cq values for the RTC and PPC of each subject were below manufacturer guidelines (dotted lines), indicative of efficient reverse transcription and PCR reactions.
Figure 4
Figure 4. Majority of lncRNAs are robustly expressed in human lung tissue.
(a) Heatmap showing color coded relative expression levels of the 84 lncRNAs in normal lung tissue specimens from 4 human donors (without preamplification). Each column represents a unique subject and each row represents a different lncRNA, which have been arranged arbitrarily in ascending (mean) abundance. (b) The levels of lncRNA and other small RNA species in lung tissue show a small but statistically significant correlation with their mean plasma levels (n = 4 lung samples; n = 8 plasma samples). Spearman correlation coefficient is shown.
Figure 5
Figure 5. Low and sporadic plasma lncRNA levels are generalizable to other chronic and acute vascular conditions.
(a) Heatmap showing of relative expression levels of the 84 lncRNAs in patients with coronary artery disease (CAD), acute coronary syndrome (ACS) or septic shock (SS) (n = 4 patients/group). Color coded relative lncRNA levels are expressed fold to the PCR detection limit after log transformation. Each column represents a unique subject and each row represents a different lncRNA, which have been arranged arbitrarily in ascending (mean) abundance. (b) Relative levels of other endogenous plasma RNA species that were extracted and measured in parallel using the same pre-amplification and RT-PCR platform as the lncRNAs. (c) Relative levels of several representative endogenous miRNAs and an exogenous spiked-in miRNA mimic (cel-miR-39) that were detected without pre-amplification from the same extracted total RNA. (d) Internal reverse transcription (RTC) and positive PCR (PPC) controls were quantified in parallel with the lncRNAs. Cq values for the RTC and PPC of each subject were below manufacturer guidelines (dotted lines), indicative of efficient reverse transcription and PCR reactions.
Figure 6
Figure 6. Assessment of previously reported plasma lncRNA biomarkers.
(a) Heatmaps showing relative levels of Lipcar (L), Tapsaki (T) and Coromarker (C) in plasma from five different groups of subjects or patients, and normal lung tissue specimens. Color coded relative lncRNA levels are expressed fold to the PCR detection limit after log transformation. Each row represents a different subject or patient. Plasma lncRNA levels were quantified after pre-amplification (+PreAmp), while lung levels were quantified without the need for pre-amplification (−PreAmp). (b) No significant differences in plasma Lipcar levels observed between groups (Kruskal-Wallis non-parametric test and Dunn’s multiple comparison test). Lipcar levels were normalized to B2M.

References

    1. Djebali S. et al.. Landscape of transcription in human cells. Nature 489, 101–108, doi: 10.1038/nature11233 (2012). - DOI - PMC - PubMed
    1. Kapranov P. et al.. Examples of the complex architecture of the human transcriptome revealed by RACE and high-density tiling arrays. Genome Res 15, 987–997, doi: 10.1101/gr.3455305 (2005). - DOI - PMC - PubMed
    1. Carninci P. et al.. The transcriptional landscape of the mammalian genome. Science 309, 1559–1563, doi: 10.1126/science.1112014 (2005). - DOI - PubMed
    1. Nagano T. & Fraser P. No-nonsense functions for long noncoding RNAs. Cell 145, 178–181, doi: 10.1016/j.cell.2011.03.014 (2011). - DOI - PubMed
    1. Ponting C. P., Oliver P. L. & Reik W. Evolution and functions of long noncoding RNAs. Cell 136, 629–641, doi: 10.1016/j.cell.2009.02.006 (2009). - DOI - PubMed

Publication types

Grants and funding