. 2016 Nov 18:6:36663.
doi: 10.1038/srep36663.

Inhibiting MDSC differentiation from bone marrow with phytochemical polyacetylenes drastically impairs tumor metastasis

Affiliations

Inhibiting MDSC differentiation from bone marrow with phytochemical polyacetylenes drastically impairs tumor metastasis

Wen-Chi Wei et al. Sci Rep. .

Abstract

Myeloid-derived suppressor cells (MDSCs) are implicated in the promotion of tumor metastasis by protecting metastatic cancerous cells from immune surveillance and have thus been suggested as novel targets for cancer therapy. We demonstrate here that oral feeding with polyacetylenic glycosides (BP-E-F1) from the medicinal plant Bidens pilosa effectively suppresses tumor metastasis and inhibits tumor-induced accumulation of granulocytic (g) MDSCs, but does not result in body weight loss in a mouse mammary tumor-resection model. BP-E-F1 is further demonstrated to exert its anti-metastasis activity through inhibiting the differentiation and function of gMDSCs. Pharmacokinetic and mechanistic studies reveal that BP-E-F1 suppresses the differentiation of gMDSCs via the inhibition of a tumor-derived, G-CSF-induced signaling pathway in bone marrow cells of test mice. Taken together, our findings suggest that specific plant polyacetylenic glycosides that target gMDSC differentiation by communicating with bone marrow cells may hence be seriously considered for potential application as botanical drugs against metastatic cancers.


Figures
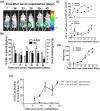
Figure 1
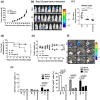
Figure 1. Change in myeloid-derived suppressor cell populations and G-CSF level in blood and spleen tissues of murine 4T1 tumor-bearing mice.
Test mice were implanted orthotopically with 5 × 105 4T1-luc2 cells and monitored weekly by non-invasive bioluminescence imaging (BLI). (a) Representative weekly BLI of tumor-bearing mice. (b) Quantitation of BLI of test tumors (a) (black bar) and expression of serum G-CSF level (white bar) in tumor-bearing mice. (c) Population distribution of granulocytic myeloid derived suppressor cells (gMDSCs) and monocytic myeloid derived suppressor cells (mMDSCs) in blood cells (dark line) and splenocytes (dotted line) in tumor-bearing mice, analyzed by flow cytometry. (d) Weight of tumor mass (dark line) and spleen (dotted line) in tumor-bearing mice. (e) Population of gMDSCs (solid line/close circle) and mMDSCs (dotted line/open circle) in tumor tissues were determined by flow cytometry analysis.
Figure 2
Figure 2. Correlation between expression levels of gMDSCs, G-CSF and the rate of tumor growth and metastasis.
Test mice were orthotopically implanted with 5 × 105 4T1-luc2 cells and primary tumors were resected at day 21 post tumor implantation. (a) Quantitative data of bioluminescence imaging (BLI, black bar) and serum G-CSF level (white bar) in tumor-resected mice, scored between day 7 and day 35. (b) Correlation between population frequency of gMDSCs and serum G-CSF level in tumor-resected mice. The expression levels of gMDSCs and G-CSF in test mice were determined at day 14 post tumor resection. (c) Correlation between survival time (day) and serum G-CSF level. The expression data on G-CSF in test mice were determined at day 21 post tumor resection. (d) Test mice were co-injected orthotopically with 4T1 cells (5 × 105) and granulocytic MDSCs and primary tumors were resected at day 18 post tumor implantation. Tumor mass of two test groups are shown. (e) The incidence of metastasis free mice treated with 4T1 only (solid circle) versus 4T1 plus MDSC (solid square) is presented.
Figure 3
Figure 3. Effect of the ethanol-extracted fraction of Bidens pilosa on the function and differentiation of MDSCs and on tumor metastasis.
(a) The population of granulocytic MDSCs in treated bone marrow cells was determined by flow cytometry. Cytotoxicity of an ethanol-extracted fraction of B. pilosa (BP-E) on bone marrow cells, revealed by MTT assay at 24 hours post treatment. (b) Cells were treated at serial concentrations (12.5 to 100 μg/mL) of BP-E for 24 hours and ROS expression in MDSCs was measured by incubating cells with H2DCFDA fluorescent probes. Ex vivo cytotoxicity of BP-E on bone marrow cells, revealed by MTT assay for 24 hours. (c) Tumor volume of untreated mice and mice treated with BP-E. (d) BLI from untreated and BP-E treated mice at 7 days post tumor resection. (e) The incidence of metastasis free mice in the control and BP-E treatment groups. (f) Survival rates of test mice. (g) Weight of spleen tissue in test mice on day 21 post tumor resection. (h) Population of granulocytic and monocytic MDSCs in spleen tissues of test mice.
Figure 4
Figure 4. Effect of the BP-E-F1 on ROS expression in MDSCs and on differentiation of MDSCs from bone marrow cells.
(a) HPLC profiling with an absorbance of UV 235nm of BP-E separated into 4 major sub-fractions (F1, F2, F3, and F4). (b) Cell number of MDSCs differentiated from bone marrow cells in treated cells was determined by flow cytometry analysis. (c) Population of granulocytic MDSCs (CD11b+Ly6G+) differentiated from bone marrow cells in treated mice was determined by flow cytometry analysis. (d) Cells were treated with four sub-fractions (F1, F2, F3, and F4) at 10 μg/mL for 24 hours and ROS expression in MDSCs was measured by incubating cells with H2DCFDA fluorescent probes.
Figure 5
Figure 5. Chemical identification of F1 phytochemicals.
(a) Chromatograph of F1 fraction by a RP-18 UPLC column. (b) Chemical structure of 3 major compounds (2-β-D-glucopyranosyloxy-1-hydroxy-5(E)-tridecene-7,9,11-triyne, 2-D-glucopyranosyloxy-1-hydroxytrideca-5,7,9,11-tetrayne, and 3-β-D-glucopyranosyloxy-1-hydroxy-6(E)-tetradecene-8,10,12-triyne) in F1 identified by spectroscopic methods. (c,d) Spectrum graph of 3 compounds in F1 fraction in MS/MS analysis.
Figure 6
Figure 6. Effect of BP-E-F1 on tumor metastasis.
(a) Tumor volume in control and BP-E-F1 group mice. (b) BLIs of all test mice at 23 days post tumor resection. (c) Quantitative data of BLIs in whole bodies of all test mice. (d) The incidence of metastasis free control, BP-E-F1, and docetaxol-treated mice. (e) Body weight of all test mice. (f) Representative BLI of liver, lungs, and spleen of test mice at 23 days post tumor resection. (g) Population of granulocytic and monocytic MDSCs in preferred organs of test mice as determined by flow cytometry.
Figure 7
Figure 7. BP-E-F1 inhibits effects of MDSCs on tumor growth and metastasis.
(a) Tumor volume of control, BP-E-F1, and BP-E-F1 + MDSC group mice. (b) Tumor weight of al test groups at 18 days post tumor implantation. (c) The metastasis free mice in all test groups. (d) BLIs of all test groups at 14 days post tumor resection.

References

    1. Plaks V., Koopman C. D. & Werb Z. Cancer. Circulating tumor cells. Science 341, 1186–1188 (2013). - PMC - PubMed
    1. Peeters D. J. et al.. Detection and prognostic significance of circulating tumour cells in patients with metastatic breast cancer according to immunohistochemical subtypes. Br J Cancer 110, 375–383 (2014). - PMC - PubMed
    1. Hunter K. W., Crawford N. P. & Alsarraj J. Mechanisms of metastasis. Breast Cancer Res 10 Suppl 1, S2 (2008). - PMC - PubMed
    1. Marino N. et al.. Breast cancer metastasis: issues for the personalization of its prevention and treatment. Am J Pathol 183, 1084–1095 (2013). - PMC - PubMed
    1. Redig A. J. & McAllister S. S. Breast cancer as a systemic disease: a view of metastasis. J Intern Med 274, 113–126 (2013). - PMC - PubMed

Publication types

LinkOut - more resources