. 2016 Jul-Sep;26(3):316-327.
doi: 10.4103/0971-3026.190421.

Magnetic resonance imaging spectrum of perinatal hypoxic-ischemic brain injury

Affiliations

Magnetic resonance imaging spectrum of perinatal hypoxic-ischemic brain injury

Binoj Varghese et al. Indian J Radiol Imaging. 2016 Jul-Sep.

Erratum in

Abstract

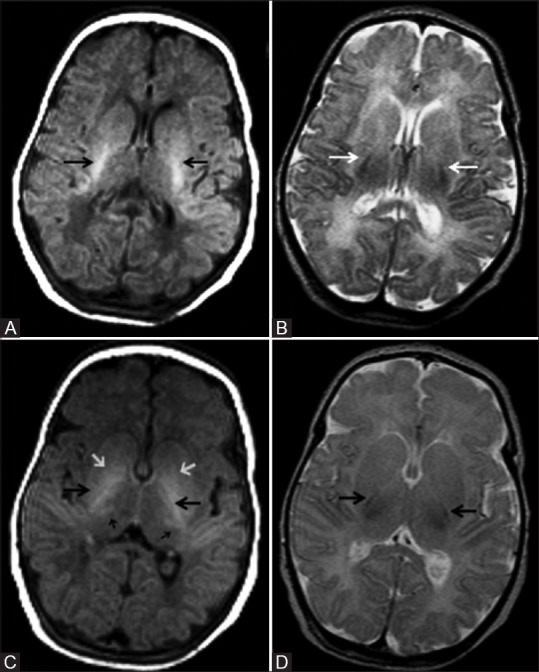
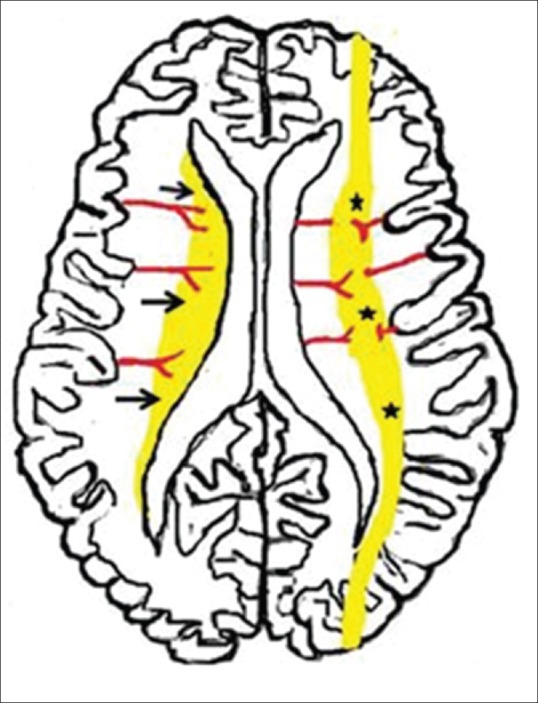
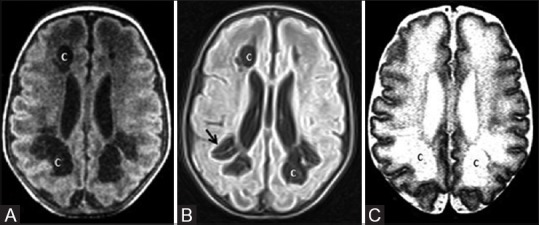
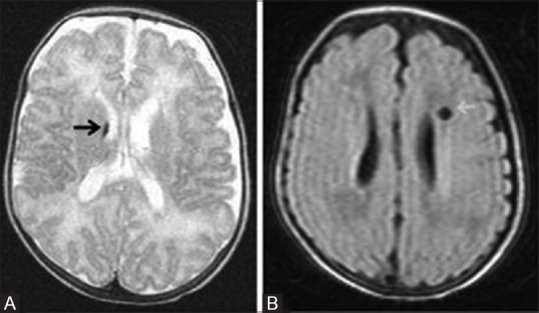
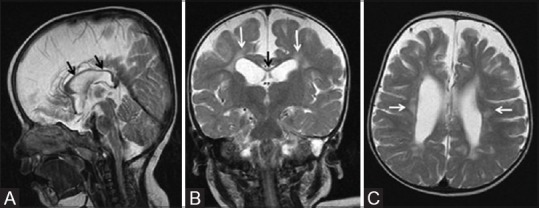
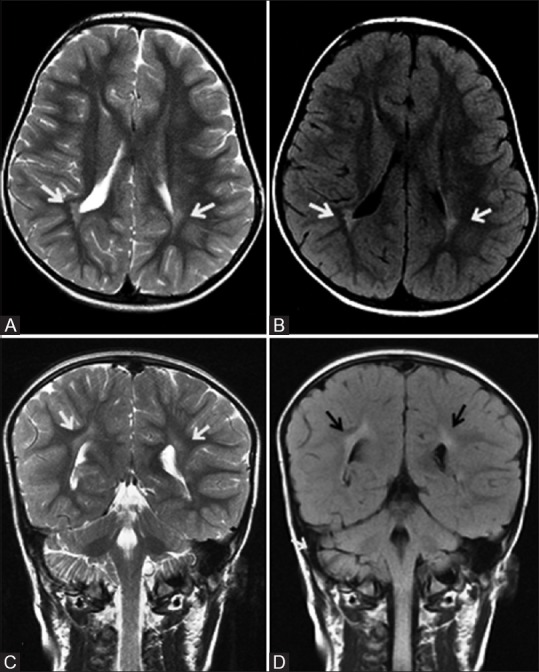
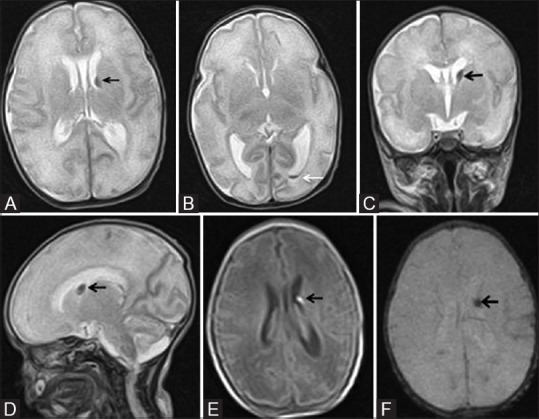
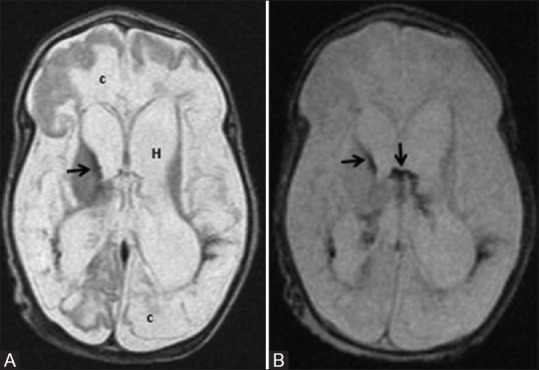
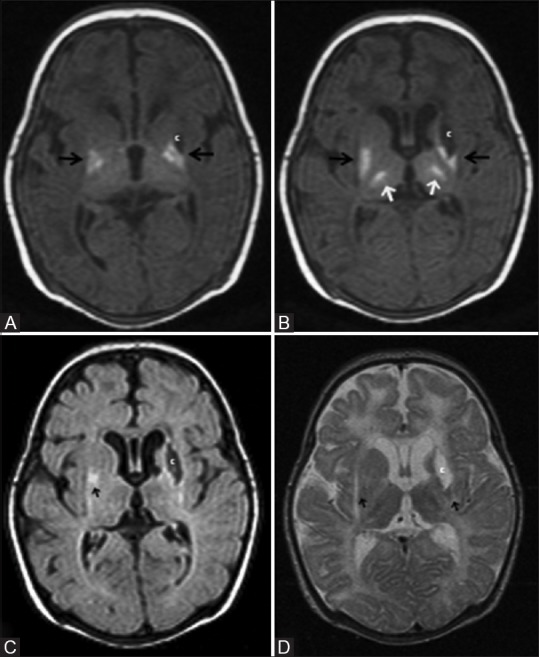
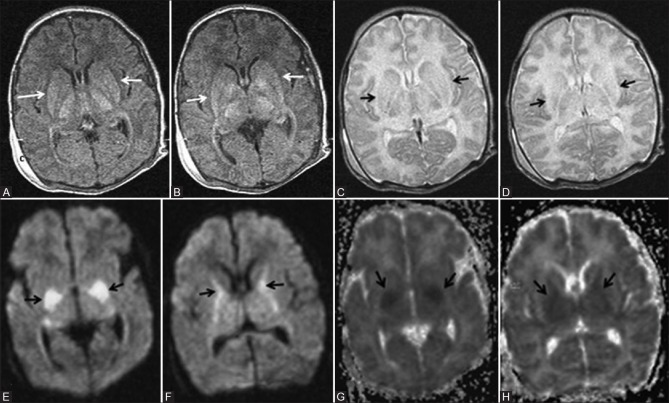
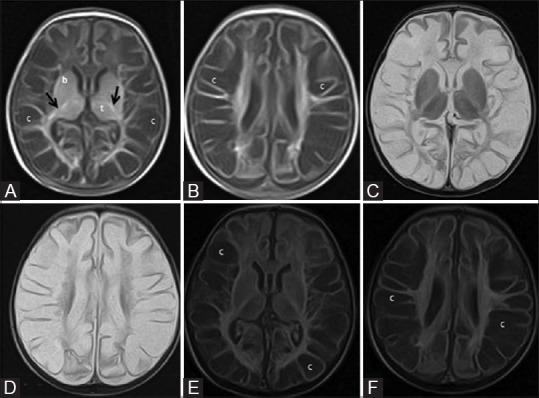
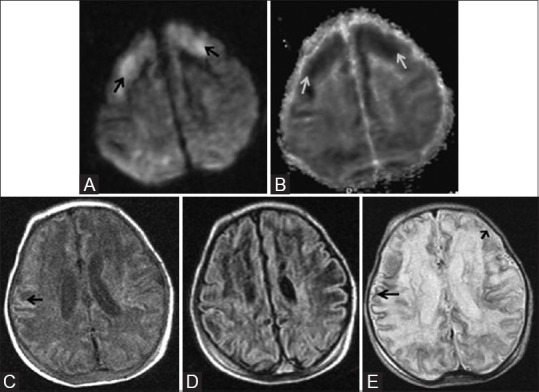
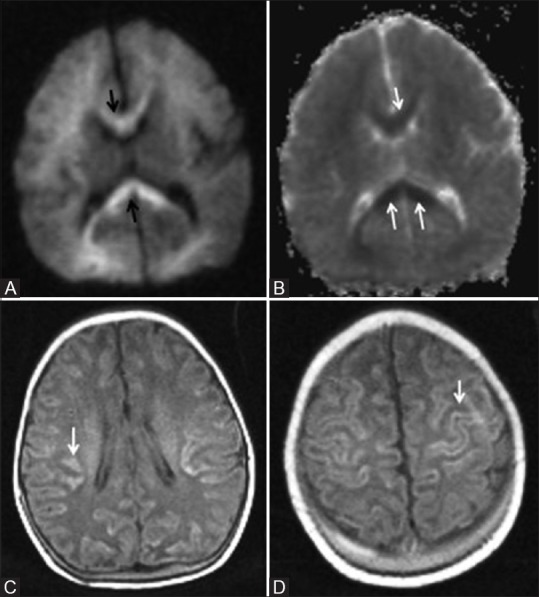
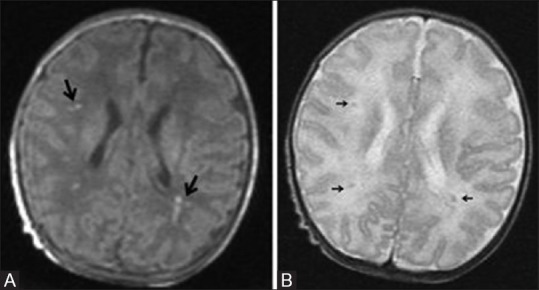
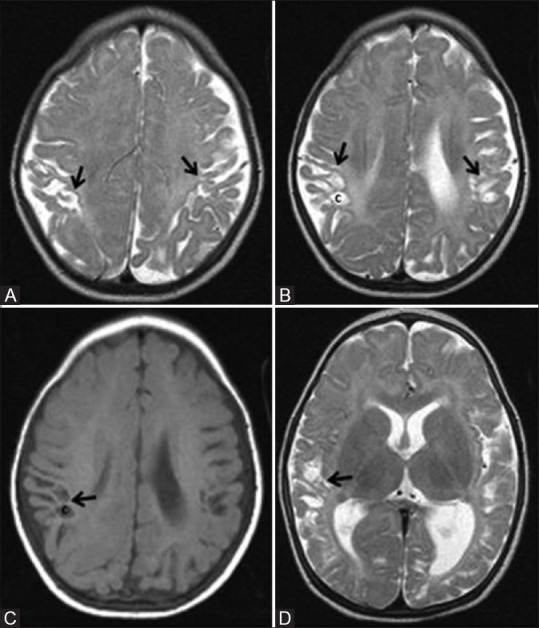
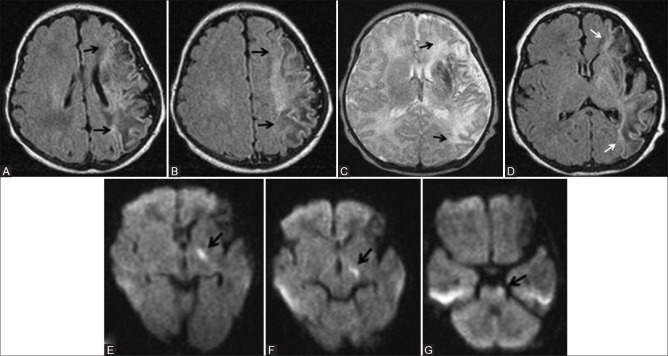
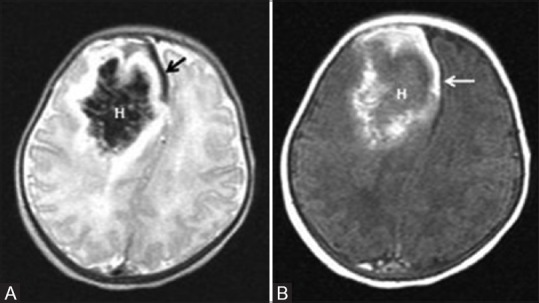
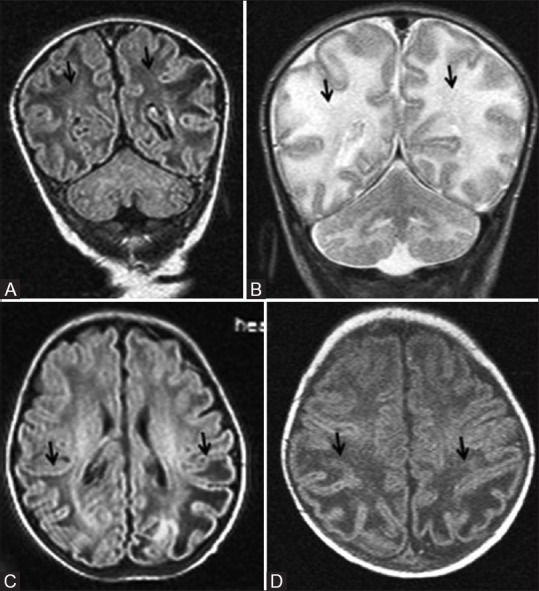
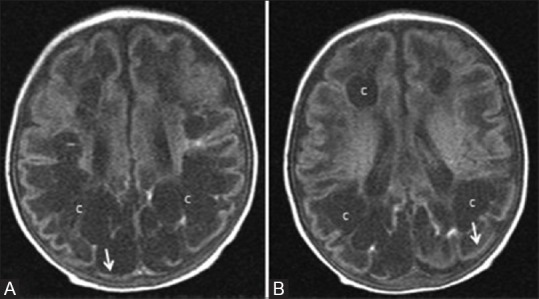
Perinatal hypoxic-ischemic brain injury results in neonatal hypoxic-ischemic encephalopathy and serious long-term neurodevelopmental sequelae. Magnetic resonance imaging (MRI) of the brain is an ideal and safe imaging modality for suspected hypoxic-ischemic injury. The pattern of injury depends on brain maturity at the time of insult, severity of hypotension, and duration of insult. Time of imaging after the insult influences the imaging findings. Mild to moderate hypoperfusion results in germinal matrix hemorrhages and periventricular leukomalacia in preterm neonates and parasagittal watershed territory infarcts in full-term neonates. Severe insult preferentially damages the deep gray matter in both term and preterm infants. However, associated frequent perirolandic injury is seen in term neonates. MRI is useful in establishing the clinical diagnosis, assessing the severity of injury, and thereby prognosticating the outcome. Familiarity with imaging spectrum and insight into factors affecting the injury will enlighten the radiologist to provide an appropriate diagnosis.

Keywords: Cortical highlighting; germinal matrix hemorrhage; hypoxic ischemic encephalopathy; hypoxic ischemic injury; periventricular leukomalacia.


Figures

Figure 1 (A-D)
Figure 1 (A-D)
(A, B): Axial magnetic resonance imaging (MRI) of a 5 day old full-term neonate at the level of internal capsule. (A) T1 weighted image (WI) shows normally increased signal intensity (SI) of the posterior limb of internal capsule relative to the basal ganglia and thalamus; (B) Corresponding T2WI shows normal hypointense signal of the posterior limb of internal capsule; (C, D): Just above (A, B), shows normal variation in SI of the basal ganglia and thalamus. (C) T1WI shows normally increased SI of the posterior limb of internal capsule (large black arrow) and ventrolateral thalamus (small black arrows). Note the moderate hyperintensity of globus pallidus, which is a normal variation (small white arrow). (D) Corresponding T2WI shows normal hypointense signal of the posterior limb of internal capsule
Figure 2
Figure 2
Diagrammatic illustration shows usual patterns of hypoxic ischemic brain injury in mild-to-moderate hypoperfusion in preterm and term neonates. Premature neonatal brain (left half) shows a periventricular border zone (black arrows) of white matter injury due to ventriculopetal vasculature The term neonate (right half) shows a more peripheral border zone (black stars) injury involving subcortical white matter and parasagittal cortex due to a ventriculofugal vasculature
Figure 3 (A-C)
Figure 3 (A-C)
A 31-day-old infant born preterm (31 weeks) shows mild-to-moderate hypoxic ischemic injury. The infant also had refractory hypoglycemia. (A) Axial T1WI at the level of lateral ventricles shows frontal and posterior periventricular white matter cysts. (B) Axial fluid-attenuated inversion recovery (FLAIR) and T2WI at the level of lateral ventricles show frontal and posterior periventricular white matter cysts (C) with gliosis (arrows)
Figure 4 (A and B)
Figure 4 (A and B)
A 76-day-old infant born preterm (30 weeks + 4 days) with maternal h/o pre-eclampsia and born by lower segment Cesarian section (LSCS) shows mild-to-moderate hypoxic ischemic injury to the brain. (A) Axial T2WI at the level of lateral ventricles shows germinal matrix hemorrhage at right caudothalamic groove (black arrow). (B) Axial FLAIR image at the level of lateral ventricles shows left periventricular white matter cyst (white arrow)
Figure 5 (A and B)
Figure 5 (A and B)
A 3½-year-old child with cerebral palsy, born preterm with low birth weight, shows features of periventricular leukomalacia as sequelae to hypoxic ischemic brain injury. (A, B) Axial T2WI at the level of lateral ventricles shows significant reduction in volume and gliosis of the periventricular white matter. Also note mild dilatation and wavy margins of the lateral ventricle (black arrows)
Figure 6 (A-C)
Figure 6 (A-C)
An 18-month-old child born preterm at 32 weeks of gestation with prolonged mild-to-moderate hypoxic ischemic injury. (A) Mid-sagittal plane T2WI shows thinning of corpus callosum (black arrows). Coronal T2WI (B) and axial T2WI (C) show thinning of corpus callosum (black arrows), lateral ventriculomegaly, and volume loss with hyperintensity (gliosis) of the periventricular white matter (white arrow)
Figure 7 (A-D)
Figure 7 (A-D)
A 4-year-old child, born preterm with history of developmental delay, showing periventricular leukomalacia. Axial T2 (A) and FLAIR (B) images at the level of lateral ventricles show peritrigonal white matter hyperintensity extending to ependymal margin (arrows). Coronal T2 (C) and FLAIR (D) images at the level of atrium of lateral ventricles show peritrigonal white matter hyperintensity extending to ependymal margin (arrows)
Figure 8 (A-C)
Figure 8 (A-C)
A 2-year-old child, born preterm, showing terminal zones of myelination. Axial T2 (A) and FLAIR (B) images at the level of lateral ventricles shows peritrigonal white matter hyperintensity (arrows). (C) Coronal FLAIR image at the level of atrium of lateral ventricles shows peritrigonal white matter hyperintensity (arrows) with a thin band of hypointensity representing myelinated white matter, separating from high signal intensity ventricular ependyma
Figure 9 (A-F)
Figure 9 (A-F)
A 24-day-old neonate born preterm (32 weeks) with germinal matrix intraventricular hemorrhage (GM-IVH) grade II. (A, B) Axial T2WI at the level of lateral ventricles show left germinal matrix hemorrhage (black arrow) with extension in to the occipital horn (white arrow) and mild ventricular dilatation. Coronal (C) and sagittal (D) T2WI show left germinal matrix hemorrhage (black arrow). (E) Axial TIWI at the level of lateral ventricles shows T1 hyperintensity at left germinal matrix hemorrhage (black arrow). (F) Axial gradient image shows corresponding subependymal blooming area (black arrow)
Figure 10 (A and B)
Figure 10 (A and B)
A 58-day-old infant born preterm with neonatal seizures shows features of prolonged mild-to-moderate hypoxic ischemic injury. Axial T2WI (A) and GRE image (B) at the level of lateral ventricles show germinal matrix hemorrhage with intraventricular extension (black arrows), hydrocephalus (H) and cystic encephalomalacia (c)
Figure 11 (A-D)
Figure 11 (A-D)
A 29-day-old term neonate, with severe hypoxic ischemic encephalopathy (stage III) at birth, shows basal ganglia thalamic pattern of injury. (A, B) Axial T1WI at the level of lateral and third ventricles show hyperintensity at the bilateral ventrolateral thalami and posterior putamina, and T1 hypointensity (cyst) at left globus pallidus. Also note the nonvisualization of myelination (T1 hyperintensity) at the posterior limb of internal capsule. Axial FLAIR (C) and (D) T2WI at the level of lateral ventricles show cerebrospinal fluid (CSF) intensity cyst (T2 hyperintensity and suppression of signals on FLAIR) with peripheral gliosis at the left globus pallidus. Note the subtle T2 hyperintensity at the bilateral posterior putamina and ventrolateral thalami and the minimal cystic changes at the bilateral frontal periventricular white matter
Figure 12 (A-H)
Figure 12 (A-H)
A 12-day-old full-term neonate; HIE stage II—severe hypoxic ischemic injury involving deep grey matter structures. (A, B) Axial T1WI at the level of basal ganglia shows abnormal T1 hyperintensity of the ventrolateral thalamus and posterior putamen (black arrows). Note the absence of normal T1 hyperintensity of the posterior limb of internal capsule. (C, D) Axial T2WI at the level of basal ganglia shows abnormal T2 hyperintensity of the thalamus and putamen (black arrows). Note the absence of normal T2 hypointense signal of the posterior limb of internal capsule. (E, F) Axial DWI at the level of basal ganglia shows diffusion restriction involving the posterior putamina and internal capsules (black arrows). (G, H) Axial ADC maps at the level of basal ganglia show corresponding hypointensity in the posterior putamen and internal capsules, denoting diffusion restriction (black arrows)
Figure 13 (A-F)
Figure 13 (A-F)
A 24-day-old term neonate with low birth weight, CSF proven meningitis, and meconium-stained amniotic fluid showing prolonged severe hypoxic ischemic injury; mixed pattern involving deep grey matter and white matter. Axial T1WI at the level of basal ganglia (A) and lateral ventricles (B). Note the abnormal T1 hyperintensity of the basal ganglia and thalami (compare with Figure 1) and T1 hypointensity of cystic changes in the periventricular and subcortical white matter. Also note the false positive T1 hyperintensity of the posterior limb of internal capsule. Axial T2WI at the level of basal ganglia (C) and lateral ventricles (D). Note the abnormal T2 hypointensity of the basal ganglia and thalami (compare with Figure 1) and T2 hyperintensity at the level of posterior limb of internal capsule. Also note the T2 hyperintensity of cystic changes in the periventricular and subcortical white matter. (E, F) Axial FLAIR images at the level of basal ganglia and lateral ventricles. Note the cystic changes in the periventricular and subcortical white matter
Figure 14 (A-E)
Figure 14 (A-E)
An 11-day-old full-term neonate with h/o birth asphyxia and neonatal seizures shows features of prolonged mild-to-moderate hypoxic–ischemic injury. Axial diffusion weighted (A) and ADC map (B) images above the level of lateral ventricles show diffusion restriction (DWI hyperintensity, black arrow, and ADC map hypointensity, white arrow) involving the cortex and subcortical white matter of bilateral frontal lobes. Axial T1WI (C) and FLAIR image (D) at the level of lateral ventricles shows subtle cortical highlighting (black arrow) at the right parietal lobe. (E) Axial T2WI at the level of lateral ventricles shows subtle low signal intensity of the cortex (black arrow) at the right parietal lobe. Also note the loss of gray-white differentiation and abnormal hyperintensity of cortex and subcortical white matter at left frontal lobe (small black arrow)
Figure 15 (A-D)
Figure 15 (A-D)
An 8-day-old term neonate with history of perinatal depression and prolonged mild-to-moderate hypoxic ischemic injury. Axial DW (A) and ADC (B) images show restricted diffusion in the corpus callosum (arrow) and faint restriction in frontal and parietal deep white matter. (C, D) Axial T1WI show cortical highlighting (arrow) in the frontoparietal lobes involving perirolandic region
Figure 16 (A and B)
Figure 16 (A and B)
A 20-day-old full-term neonate presenting with seizures shows mild hypoxic ischemic brain injury. Axial T1 (A) and T2 (B) WI at the level of lateral ventricles show few punctuate T1 hyperintensities (large black arrows) and subtle T2 hypointensities (small black arrows) representing astrogliosis in the parasagittal subcortical white matter. No blooming in the gradient images rules out hemorrhage
Figure 17 (A-D)
Figure 17 (A-D)
A 7-month-old infant with h/o term birth, low birth weight, HIE stage II, and neonatal seizures shows features of mild-to-moderate hypoxic–ischemic injury involving the parasagittal border zone. Axial T2WI above (A) and at (B) lateral ventricles show gliosis and volume loss involving bilateral parasagittal gyri and subcortical white matter (ulegyria, black arrow). Also note few cysts in the subcortical white matter (C). Axial T1WI (C) at the level of lateral ventricles and Axial T2WI (D) at basal ganglia level show volume loss and cysts (c) involving bilateral parasagittal cortex and subcortical white matter. Also note the uninvolved basal ganglia and thalamus
Figure 18 (A-G)
Figure 18 (A-G)
A 10-day-old full-term neonate with perinatal left middle cerebral artery territory infarction. (A, B) Axial T1WI at and above the level of lateral ventricles show T1 hypointense (edema) and hyperintense (astrogliosis) areas involving left the middle cerebral artery (MCA) territory. No blooming in the gradient images rules out haemorrhage. (C, D) Axial T2 and FLAIR images at the level of lateral ventricles show predominant T2 hyperintensity and few hypointense areas involving the left MCA territory. No blooming in the gradient images rules out hemorrhage. (E-G) Axial DWI at the level of lateral ventricles, midbrain and pons show diffusion restriction involving left corticospinal tract
Figure 19 (A and B)
Figure 19 (A and B)
A 6-day-old term neonate, with history of perinatal depression. Axial T2 (A) and Axial T1 (B) WI show parenchymal subacute hematoma (H) in the right frontal lobe with mass effect. Also note subacute SDH in the right frontal region and anterior interhemispheric fissure (arrow)
Figure 20 (A-D)
Figure 20 (A-D)
A 22-day-old early term neonate with documented hypoglycemia and seizures. Coronal FLAIR (A) and T2WI (B) images at the level of parietooccipital lobes show cystic changes and edema (black arrows) involving white matter and increased gray-white differentiation. Axial FLAIR (C) at lateral ventricular level and T1WI (D) above lateral ventricles show white matter cystic changes and edema confined to parietooccipital lobes (black arrows)
Figure 21 (A and B)
Figure 21 (A and B)
An 8-month-old infant born late preterm (36 weeks 3 days), small for gestational age with symptomatic hypoglycemia and hypoxic brain injury. (A, B) Axial T1WI at the level of lateral ventricles show cystic changes (c) involving frontal and parietooccipital white matter. Note the predominant involvement of parietooccipital region and cortical thinning (arrows)

References

    1. Graham EM, Ruis KA, Hartman AL, Northington FJ, Fox HE. A systematic review of the role of intrapartum hypoxia-ischemia in the causation of neonatal encephalopathy. Am J Obstet Gynecol. 2008;199:587–95. - PubMed
    1. Chalak LF, Rollins N, Morriss MC, Brion LP, Heyne R, Sánchez PJ. Perinatal Acidosis and Hypoxic-Ischemic Encephalopathy in Preterm Infants of 33 to 35 Weeks' Gestation. J Pediatr. 2012;160:388–94. - PMC - PubMed
    1. Lawn JE, Cousens S, Zupan J. 4 million neonatal deaths: When? Where? Why? Lancet. 2005;365:891–900. - PubMed
    1. Vannucci RC, Perlman JM. Interventions for Perinatal Hypoxic-Ischemic Encephalopathy. Pediatrics. 1997;100:1004–114. - PubMed
    1. Barkovich AJ. The encephalopathic neonate: Choosing the proper imaging technique. Am J Neuroradiol. 1997;18:1816–20. - PMC - PubMed