. 2005 Jan 25:1:1-19.
doi: 10.2142/biophysics.1.1. eCollection 2005.

Mechanism of muscle contraction based on stochastic properties of single actomyosin motors observed in vitro

Affiliations

Mechanism of muscle contraction based on stochastic properties of single actomyosin motors observed in vitro

Kazuo Kitamura et al. Biophysics (Nagoya-shi). .

Abstract

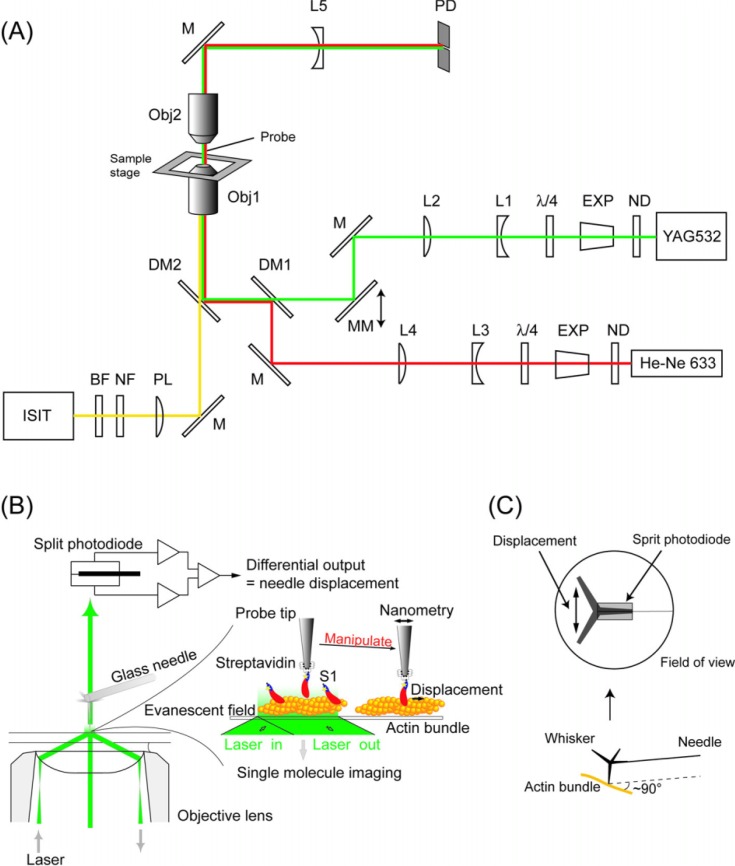
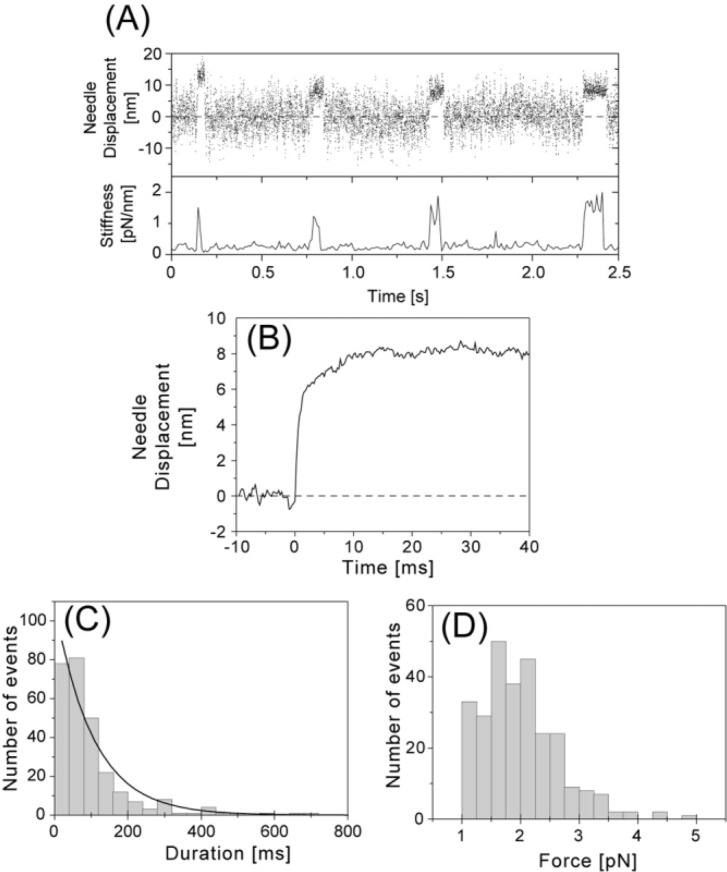
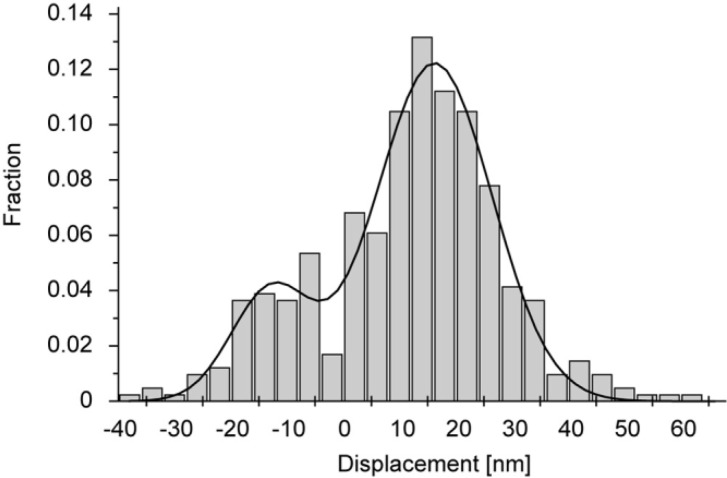
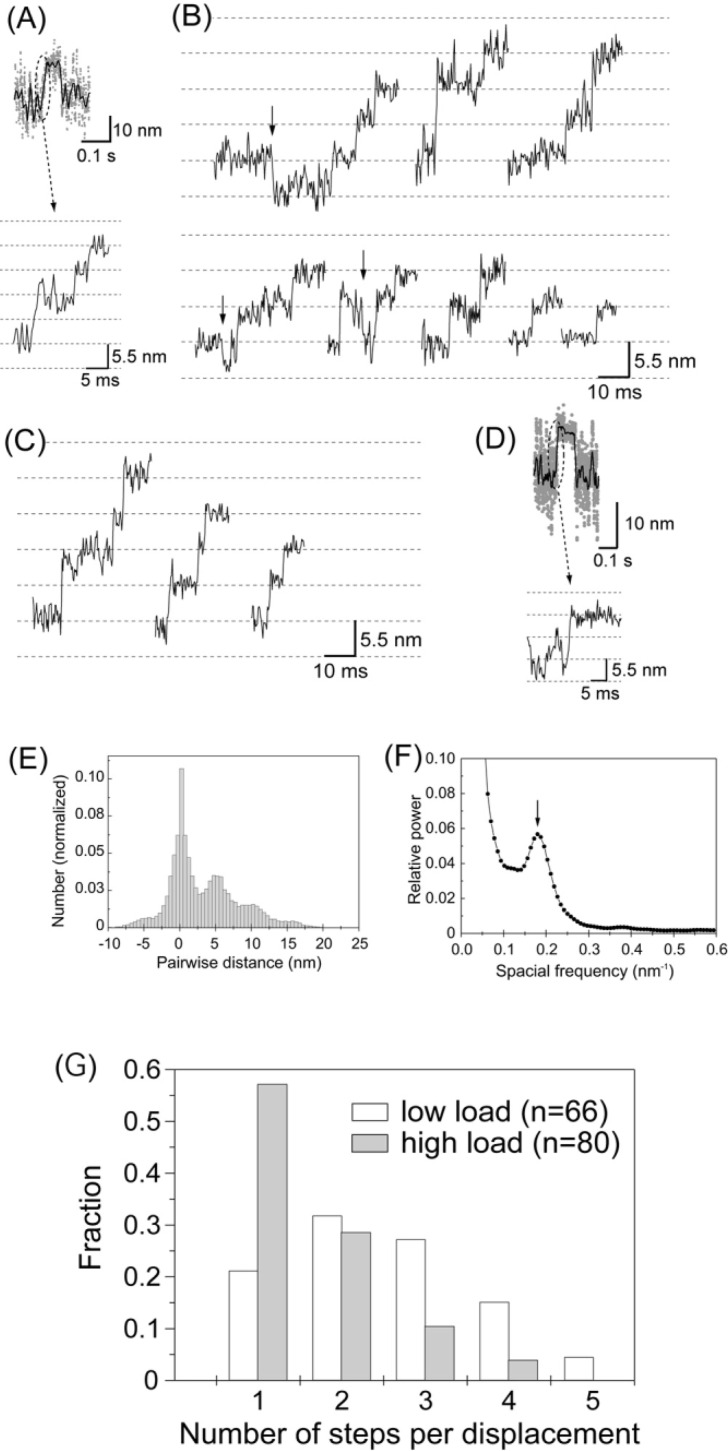
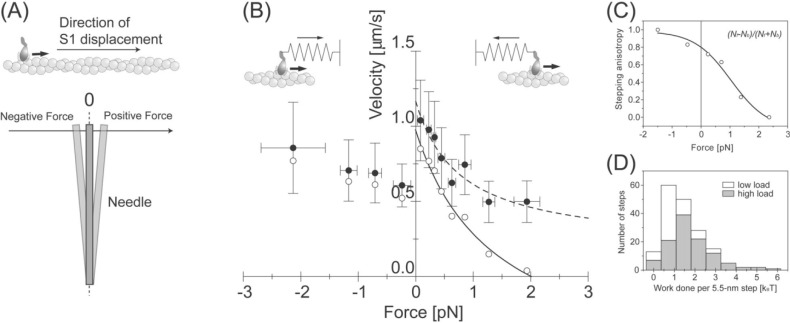
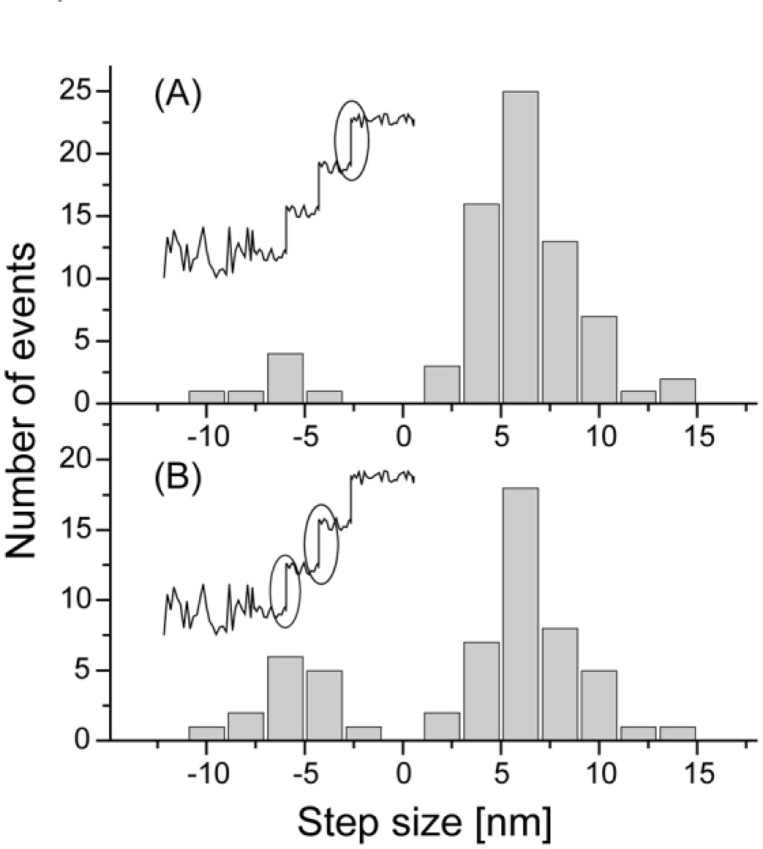
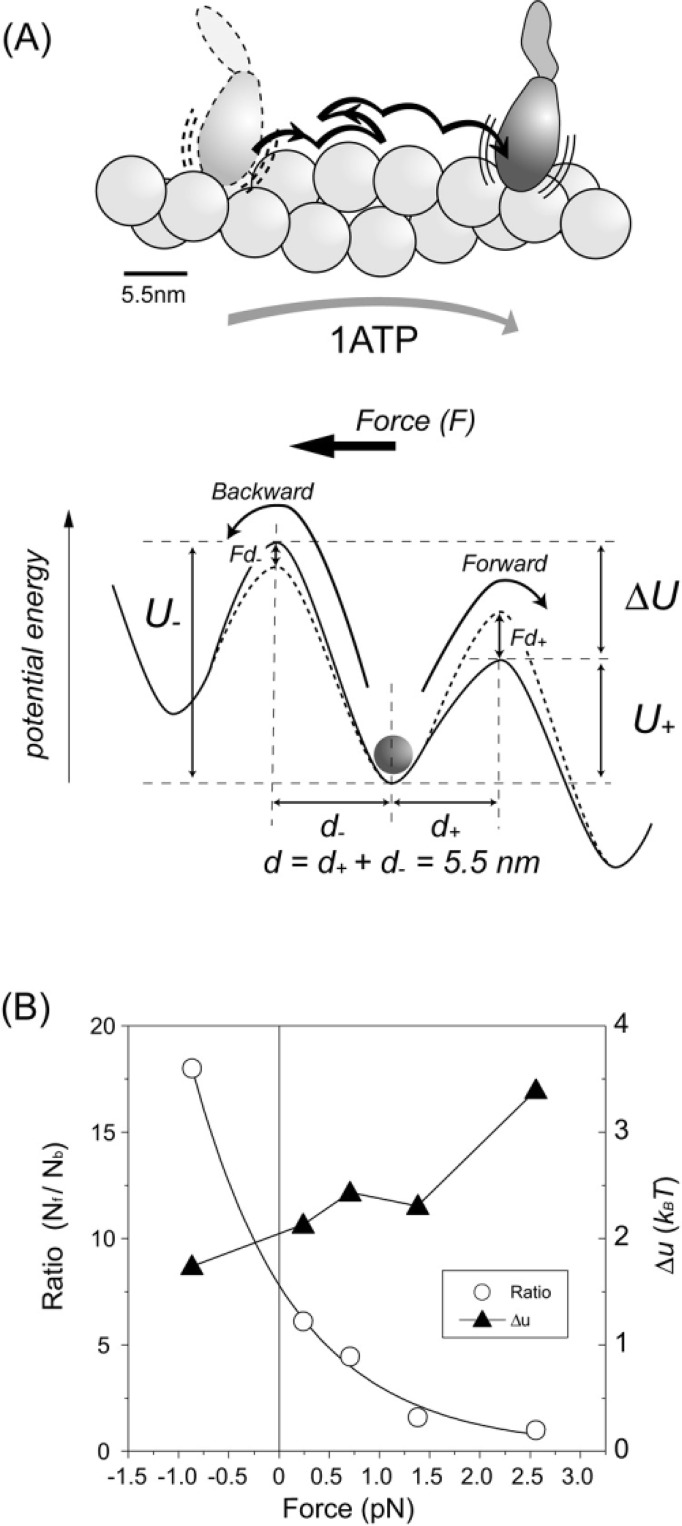
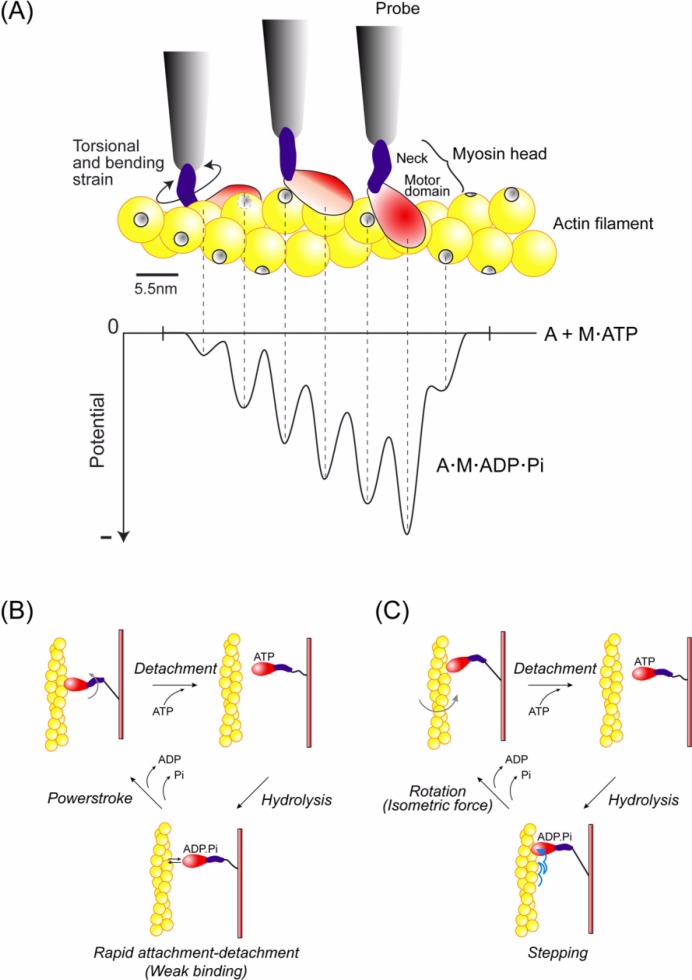
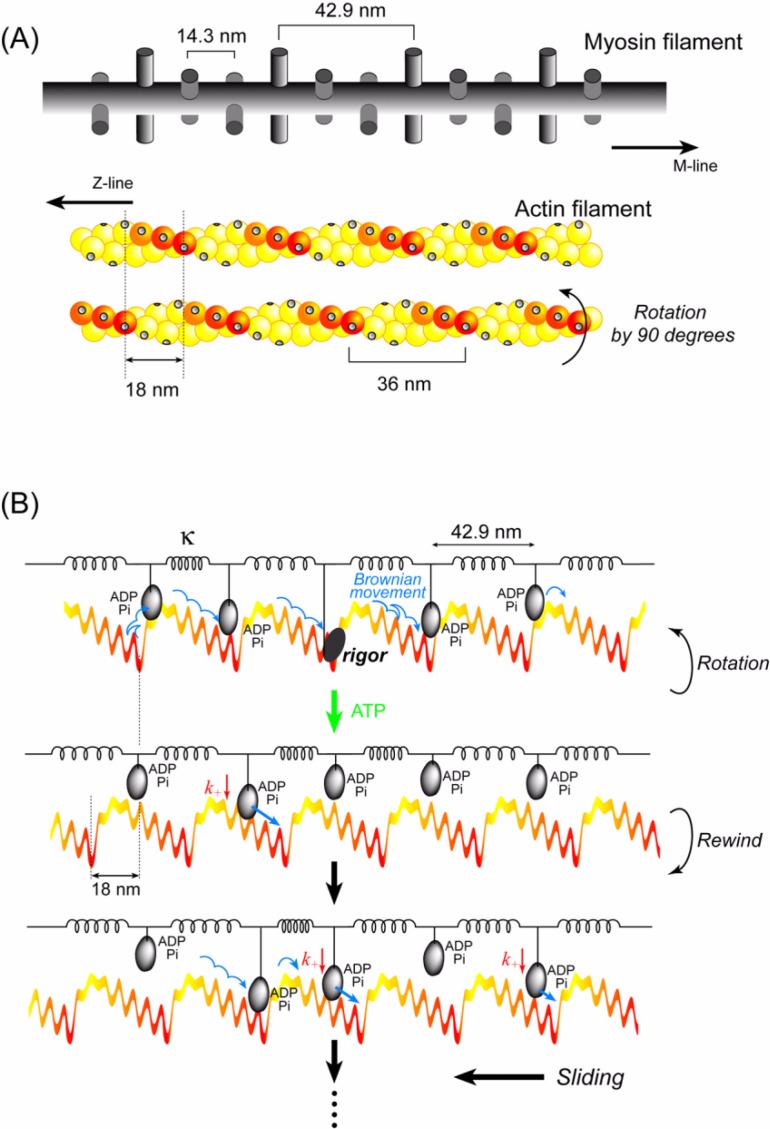
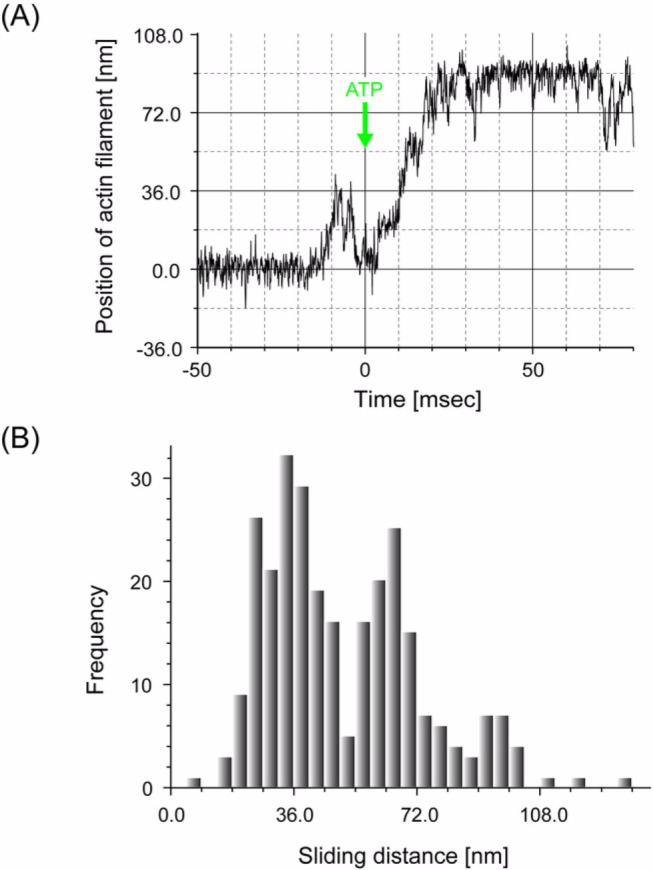
We have previously measured the process of displacement generation by a single head of muscle myosin (S1) using scanning probe nanometry. Given that the myosin head was rigidly attached to a fairly large scanning probe, it was assumed to stably interact with an underlying actin filament without diffusing away as would be the case in muscle. The myosin head has been shown to step back and forth stochastically along an actin filament with actin monomer repeats of 5.5 nm and to produce a net movement in the forward direction. The myosin head underwent 5 forward steps to produce a maximum displacement of 30 nm per ATP at low load (<1 pN). Here, we measured the steps over a wide range of forces up to 4 pN. The size of the steps (∼5.5 nm) did not change as the load increased whereas the number of steps per displacement and the stepping rate both decreased. The rate of the 5.5-nm steps at various force levels produced a force-velocity curve of individual actomyosin motors. The force-velocity curve from the individual myosin heads was comparable to that reported in muscle, suggesting that the fundamental mechanical properties in muscle are basically due to the intrinsic stochastic nature of individual actomyosin motors. In order to explain multiple stochastic steps, we propose a model arguing that the thermally-driven step of a myosin head is biased in the forward direction by a potential slope along the actin helical pitch resulting from steric compatibility between the binding sites of actin and a myosin head. Furthermore, computer simulations show that multiple cooperating heads undergoing stochastic steps generate a long (>60 nm) sliding distance per ATP between actin and myosin filaments, i.e., the movement is loosely coupled to the ATPase cycle as observed in muscle.

Keywords: Brownian motion; loose coupling; molecular motor; preferential landing; single molecule.


Figures

Figure 1
Figure 1
(A) Schematic drawing of the experimental apparatus. The system was built on an inverted microscope. A green laser (YAG532) was used as the light source for both single molecule imaging (objective-type TIRFM) and nanometry (bright field illumination) by changing the incident angle of the laser by moving the mirror, MM. The fluorescent image of single Cy3-BDTC-S1 molecules was collected by the lower objective (Obj1), magnified by a projection lens (PL), and detected by an intensified-SIT camera (ISIT) under TIR illumination mode. The magnified image of the probe was obtained by the upper objective (Obj2) and a concave lens (L5) under bright field illumination mode. Displacement of the needle was monitored using a split-photodiode (PD). The red laser (He-Ne 633) was used for monitoring the probe position during single molecule manipulation (See text for details). ND, neutral density filters; Exp, beam expanders; λ/4, quarter-wave plates; L1&3, concave lens; L2&4, convex lens; DM1&2, dichroic mirrors; NF, notch filter; and BF, bandpass filter. (B) Imaging and nano-manipulation of single S1 molecules. A single S1 molecule, which had been biotinylated and fluorescently labeled by Cy3 at its regulatory light chain, was specifically attached to the tip of a scanning probe through a biotin-streptavidin bond and observed as a single fluorescent spot. The displacement produced when the S1 molecule was brought into contact with an actin bundle bound to a glass surface in the presence of ATP was determined by measuring the position of the needle with sub-nanometer accuracy. The S1 was rigidly attached to a fairly large scanning probe, so it was assumed to stably interact with an actin filament without diffusing away just like in muscle. (C) The schematics of the measurement geometry. A ZnO whisker crystal, whose length was 5–10 µm and radius of curvature of the tip was ∼15 nm, was attached to the tip of a very fine glass microneedle, 100 µm long and 0.3 µm in diameter. The glass needle was set perpendicular to the longitudinal axis of the actin bundle (Lower). The magnified image of the whisker + needle was projected onto the split-photodiode to measure the nanometer displacement (Upper).
Figure 2
Figure 2
Imaging of single Cy3-labeled S1 (Cy3-BDTC-S1) molecules captured on the tip of the scanning probe under TIRFM. (A) Fluorescence image of a Cy3-BDTC-S1 molecule captured on the tip of the probe (arrow). The S1 molecules were clearly observed as fluorescent spots. Bar=5 µm. (B and C) Typical time trajectories of the fluorescence intensity of a single (B) and double (C) Cy3-BDTC-S1 molecule captured onto the tip of the probe. Arrows indicate photo-bleaching. (D and E) Distributions of fluorescence intensities from Cy3-BDTC-S1 captured onto the tip of the probe (D) and adhering to the glass surface (E) were well fitted with Gaussian distributions centered at 230±88 and 290±76 (mean±s.d.), respectively.
Figure 3
Figure 3
Displacements and forces produced by single S1 molecules at high needle stiffness (0.1–0.6 pN/nm). (A) Representative recording of the generation of displacements by a single S1 molecule (Upper, 2 kHz bandwidth) and changes in the stiffness (Lower). The stiffness was calculated from the variance of the fluctuations of the needle. The stiffness of the needle was 0.21 pN/nm at 1 µM ATP and 20°C. (B) Needle displacement averaged over all observed events at high needle stiffness (n=274). The rising phases of the displacements were synchronized at the starting position by eye and the data at each sampling point was averaged. Mean needle displacement was 8.1 nm and when corrected to S1 displacement, 9.2 nm. (C) Histogram of displacement duration. The solid line shows a single exponential fitted to the distribution by a least squares fit. Time constant was 110 ms. (D) Histogram of forces. The forces were obtained by multiplying the stiffness of the needle by the individual needle displacements. Mean force at the plateau was 2.0 pN. Forces less than 1 pN were excluded in the histogram and from the averaging process.
Figure 4
Figure 4
Stiffness during the attachment of an acto-S1. The system stiffness was measured for individual displacements and the mean vaules were plotted against the plateau levels of displacements (see Fig. 1A). The data represents mean±s.e.m. Note that the system stiffness is constant over the range of displacement observed.
Figure 5
Figure 5
A histogram of needle displacements caused by single S1 molecules at low needle stiffness (n=135). The solid line indicates a double Gaussian with peaks at 14 nm and −13 nm fit to the data. The standard deviation of each Gaussian was similar to that of the thermal vibration of the needle used in solution.
Figure 6
Figure 6
Stepwise movements in the rising phase of the displacements. (A) The rising phase of the displacement record plotted on an expanded timescale. (B) Representative traces of stepwise movements in the rising phase at high needle stiffness (2 kHz bandwidth). Some backward steps were observed as indicated by arrows. (C) Stepwise movements in the rising phase at low needle stiffness (0.01–<0.1 pN/nm) from Kitamura et al.. (D) The rising phase of the displacement that took place so rapidly that the steps were unclear. (E) Histogram of the pairwise distance for all the data points of stepwise movements in the rising phase at high needle stiffness (number of rising phases=80). (F) Power spectrum of the histogram of pairwise distance shown in (E). An obvious peak was observed at 0.18 nm−1 corresponding to the spatial periodicity of 5.6 nm in the histogram. (G) Histogram of the number of steps per displacement. The steps were counted by eye. Steps of ∼5.5×N nm were counted as N steps. White and gray bars indicate the results obtained at low and high needle stiffness, respectively.
Figure 7
Figure 7
Load dependent properties of the 5.5-nm steps. (A) The definition of the direction of the forces. When the S1 was pulled by the needle against its proceeding direction, determined by the direction of major displacement as shown in Fig. 4, the force was defined as positive. (B) Force-velocity curve of individual S1 molecules. The velocity was obtained by dividing the step size, 5.5 nm, by the dwell time (Filled circles). Bars indicate the standard deviations for 10–30 steps. Open circles indicate the velocity corrected by the anisotropy of the stepping direction. The solid line shows the Hill’s curve fitted to the corrected velocity. (C) Load dependence of the stepping anisotropy. (D) Histogram of work done by each 5.5-nm step at low (white bars) and at high needle stiffness (gray bars). Average work done per 5.5-nm step at higher needle stiffness was 1.8 kBT.
Figure 8
Figure 8
Histograms of the step size just before the final plateau (A) and the remaining steps at the rising phase (B). Plateaus were determined as the greatest displacement achieved before myosin detaches from actin causing the displacement to return to zero.
Figure 9
Figure 9
Potential profile for biased Brownian steps. (A) Biased Brownian steps of a myosin head along an actin filament (Upper) and asymmetric potential of the activation energy (Lower). (B) Ratio of forward and backward steps at various loads (open circles) and difference between the maximum potential barriers for forward and backward steps, Δu (filled triangles) (Supplement Movie 1).
Figure 10
Figure 10
Stepping model based on preferential landing of the myosin head. (A) Potential slope along the actin half helical pitch due to the steric compatibility between the orientations of the binding sites of actin and the myosin head (see text for detail). (B) Mechanochemical coupling for the conventional model. The myosin head undergoes rapid attachment-detachment cycles with actin after ATP hydrolysis and then swings its neck domain (lever arm) to perform a powerstroke, coupled to Pi release. (C) Mechanochemical coupling for the present model. The myosin head undergoes steps in the forward direction during attachment-detachment cycles. Coupled to Pi release, the head rotates the actin filamen– (see Fig. 11) and stops the step, and isometric force may be generated,.
Figure 11
Figure 11
Cooperative action of multiple heads undergoing stochastic steps. (A) Schematic diagrams of actin and myosin filaments in skeletal muscle. The actin filament has a helical structure with a half pitch of 36 nm. The myosin filament also has a helical structure with a pitch of 43 nm and a subunit repeat of 14.3 nm. Myosin heads on a myosin filament project toward an actin filament at 43 nm intervals. In skeletal muscle, the actin and myosin filaments are arranged in a hexagonal lattice and one actin is surrounded by three myosin filaments. Therefore, the number of myosin molecules project toward one actin filament 0.7 µm long (length when fully overlapped with myosin filaments) is approximately 50. When the actin filament is rotated 90°, the relative position between the actin helical pitches and the myosin heads shifts by approximately 3 actin monomers. The actin slopes along the actin helical pitches are represented by a color gradient. (B) Qualitative explanation of the cooperative action of myosin heads on a thick filament. The myosin filament is equivalently represented by a row of myosin heads connected with springs at intervals of 43 nm. The actin filament is represented by straight, periodic, saw-tooth shape potentials along the half helical pitches as shown in Fig. 10. Cooperative action of the myosin heads causes a long (>60 nm) sliding distance of an actin filament per ATP (see text for detail).
Figure 12
Figure 12
Computer simulation of multiple head cooperative activity undergoing stochastic steps. We simulated cooperative action of myosin heads under a periodic and asymmetric potential as shown in Fig. 11B by numerically solving the Langevin equation, 0=ρdxi/dtdU(xi,t)/dx+F(t)Ai,where xi is the position of i-th myosin head; ρ is a drag coefficient; F(t) is the random force obeying a Gaussian white noise characterized by the ensemble average, <F(t)>=0 and <F(t)F(s)>=2 kBTδ(ts); Ai is the interaction force between the neighboring heads described as κ(xixi−1)−κ(xi+1xi), where κ is the spring constant connecting the heads. The potential slope along the actin helical pitch (Fig. 10B) was simplified to be a straight saw-tooth shaped potential. Instead, the drag coefficient was set to be larger than it is in solution so that the velocity of the heads was equal to the maximum velocity in Fig. 7. Other parameters were chosen such that 1) the spring constant (κ) connecting the head was 0.1 pN/nm, which is approximately one tenth as large as that of a rigor crossbridge; 2) the ratio of potential rise to decline was 1 to 6 and the depth of the potential at the bottom was 2 kBT; 3) the pitch of the potential and the average intervals of myosin heads were 36 nm and 43 nm, respectively; 4) the number of heads interacting with the actin filament was 11 (∼20% overlap between actin and myosin filaments); 5) the rotation angle of the actin filament was 90°; and 6) the rate constant (k+) that the heads rebind to actin after the rewinding of the actin filament was 100 s−1head−1. The potential slope was assumed to be smaller than that estimated in the present experiment (see Fig. 10). The strain exerted on the neck domain would be much smaller during free shortening at zero load in muscle because the head is tethered to the myosin filament via a flexible α-helix (S2), while the head is directly attached at its tail end to the probe in the present measurement system. Thus, the potential slope depending on the strain would be smaller. (A) A typical time course of the movement of an actin filament. (B) Histogram of the sliding distance of actin filaments per ATP. The average sliding distance of actin filaments was 58.4 nm per ATP.

Similar articles

Cited by

References

    1. Huxley HE, Hanson J. Changes in the cross-striations of muscle during contraction and stretch and their structural interpretation. Nature. 1954;173:973–976. - PubMed
    1. Huxley AF, Niedergerke R. Structural changes in muscle during contraction; interference microscopy of living muscle fibres. Nature. 1954;173:971–973. - PubMed
    1. Huxley HE. The mechanism of muscular contraction. Science. 1969;164:1356–1365. - PubMed
    1. Huxley AF, Simmons RM. Proposed mechanism of force generation in striated muscle. Nature. 1971;233:533–538. - PubMed
    1. Yanagida T. Angles of nucleotides bound to cross-bridges in glycerinated muscle fiber at various concentrations ε-ATP, ε-ADP and ε-AMPPNP detected by polarized fluorescence. J. Mol. Biol. 1981;146:539–560. - PubMed