. 2007 Aug 31:3:37-45.
doi: 10.2142/biophysics.3.37. eCollection 2007.

Ratio of membrane proteins in total proteomes of prokaryota

Affiliations

Ratio of membrane proteins in total proteomes of prokaryota

Ryusuke Sawada et al. Biophysics (Nagoya-shi). .

Abstract

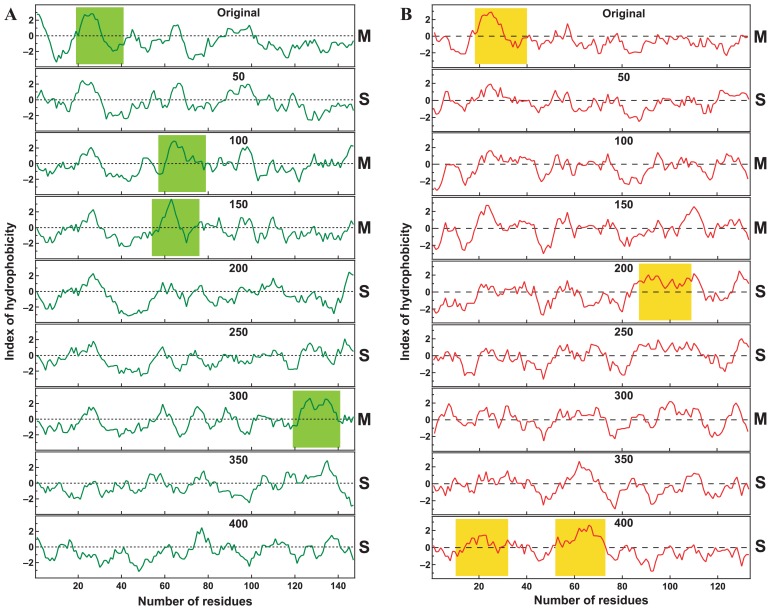
The numbers of membrane proteins in the current genomes of various organisms provide an important clue about how the protein world has evolved from the aspect of membrane proteins. Numbers of membrane proteins were estimated by analyzing the total proteomes of 248 prokaryota, using the SOSUI system for membrane proteins (Hirokawa et al., Bioinformatics, 1998) and SOSUI-signal for signal peptides (Gomi et al., CBIJ, 2004). The results showed that the ratio of membrane proteins to total proteins in these proteomes was almost constant: 0.228. When amino acid sequences were randomized, setting the probability of occurrence of all amino acids to 5%, the membrane protein/total protein ratio decreased to about 0.085. However, when the same simulation was carried out, but using the amino acid composition of the above proteomes, this ratio was 0.218, which is nearly the same as that of the real proteomic systems. This fact is consistent with the birth, death and innovation (BDI) model for membrane proteins, in which transmembrane segments emerge and disappear in accordance with random mutation events.

Keywords: comparative proteomics; large-scale genome comparison; membrane protein prediction; protein world; sequence simulation.


Figures

Figure 1
Figure 1
Ratio of membrane proteins to total proteins for various organisms was estimated by prediction systems SOSUI and SOSUIsignal, leading to an average constant value of 0.23. (A) Number of membrane proteins is plotted as a function of total ORFs for 248 prokaryota. The solid blue line was obtained by least square deviation analysis: y=0.228x, with an R2-value of 0.933. (B) The distribution of the deviation from the constant ratio calculated by equation (4) is shown for all organisms. A Gaussian distribution fitted to the data points is represented as a solid blue line. Skewness, kurtosis and standard deviation of distribution are 0.347, 2.404 and 1.561, respectively.
Figure 2
Figure 2
Ratio of membrane proteins to total proteins for randomized proteomes also was found to be constant for all organisms, but the average value was 0.085, which is much smaller than the corresponding value for the real proteomes. (A) The solid green line represents the variation in this ratio for Escherichia coli K12, plotted as a function of the randomized simulation up to the 1000-th step. The dotted green line represents the average of the set of membrane protein/total protein ratios of E. coli K12, from mutation steps 300 to 1000, this value being 0.084. (B) Numbers of membrane proteins at the 400-th mutational step are plotted as a function of the numbers of all proteins coded in total genomes. The solid green line is obtained by least square deviation analysis: y=0.085x, with an R2-value of 0.985. Gray closed triangles and solid line indicate the result of Fig. 1A for comparison. (C) The distribution of the deviation from the constant ratio at the 400-th mutational step is shown for all organisms. A Gaussian distribution fitted to the data points is represented as a green line. Skewness, kurtosis and standard deviation of distribution are 0.177, 3.106 and 0.362, respectively. Gray closed triangles and solid line indicate the result of Fig. 1B for comparison.
Figure 3
Figure 3
The average membrane protein/total protein ratio for randomized proteomes, using the amino acid compositions observed in the real proteomes, was 0.22. (A) The solid red line represents the variation of this ratio for the case of Escherichia coli K12. A dotted green line represents the average the set of membrane protein/total protein ratios in the simulation of the point mutations for the proteome of E. coli K12, this value being 0.247. The result of the simulation in Fig. 2A is shown with solid and dotted gray lines for comparison. (B) Numbers of membrane proteins at the 400-th mutational step is plotted as a function of the numbers of total proteins. The solid orange line was obtained by the least square deviation analysis: y=0.218x, with an R2-value of 0.891. Gray closed triangles and solid line indicate the result of Fig. 1A for comparison. (C) The distribution of deviation from the constant ratio at the 400-th mutational step is shown for all organisms. A Gaussian distribution fitted to the data points is represented by an orange line. Skewness, kurtosis and standard deviation of distribution are −0.040, 3.897 and 1.715, respectively. Gray closed triangles and solid line indicate the result of Fig. 1B for comparison.
Figure 4
Figure 4
Time dependences of the hydropathy plots for amino acid sequences during the simulations. Amino acid sequences which RefSeq accession numbers are NP_417851.3 and NP_417093.1 were used for the hydropathy plots of (A) and (B), respectively. Indexes of hydropathy for amino acid sequences were plotted using seven residues windows.
Figure 5
Figure 5
Ratio of membrane proteins to total proteins (A) and the distribution of the deviation from this constant ratio (B) are shown for five sets of proteomes of varying amino acid compositions. The values at the 400-th mutational step of the simulations were used for the analysis. (A) The average membrane protein/total protein ratio decreased in accordance with the decrease in the contribution of the amino acid composition from the real proteomes. The factor α in equation (5), which represents the contribution of the real proteomes, was varied in order to study the relationship between the membrane protein/total protein ratio and the amino acid composition. The results for α values 0.00, 0.25, 0.50, 0.75 and 1.00 are represented by red, orange, green, sky-blue and blue lines, respectively. The average ratios for α values 0.00, 0.25, 0.50, 0.75 and 1.00 were 0.218, 0.183, 0.148, 0.114 and 0.085, respectively, and the corresponding R2-values were 0.891, 0.930, 0.959, 0.981 and 0.985, respectively. (B) Distributions of deviation from these (essentially constant) ratios are shown for α values 0.00, 0.25, 0.50, 0.75 and 1 by the corresponding colors to the graph of (A). All of the distributions could be fitted well with a Gaussian distribution, and the values of the standard deviations increased gradually in accordance with the increase in α: standard deviations of 0.359, 0.465, 0.864, 1.251 and 2.038 were observed for α values 0.00, 0.25, 0.50, 0.75 and 1, respectively. (C) The average membrane protein/total protein ratio and the standard deviation of the distribution from the average ratio are plotted as a function of the factor α of the real proteomes to the amino acid compositions. Membrane protein ratio and standard deviation are indicated by the green closed circle and blue closed triangles, respectively. The standard deviation is shown in the logarithmic scale. The observation of a very good correlation indicates that the membrane protein/total protein ratio is determined by the amino acid composition.
Figure 6
Figure 6
The number density of hydrophobic amino acids (A) and amphiphilic amino acids (B) were calculated for five sets of proteomes. It is already known that hydrophobic and amphiphilic clusters in amino acid sequences directly affect the membrane translocation of proteins. The distribution of both parameters systematically changed according to the variation of the factor α. Hydrophobic amino acids in this diagram include isoleucine, leucine, methionine, phenylalanine and valine, and amphiphilic amino acids are arginine, glutamine, glutamate, histidine and lysine. Because both types contain five amino acids, the probability of occurrence of both types of amino acids is 0.25 for the system of the uniform amino acid composition.
Figure 7
Figure 7
Changes in an amino acid sequence gives rise to the transformation between soluble and membrane proteins. The rate constants, km→s and ks→m, can be defined as the numbers of transformations from soluble to membrane proteins and of the inverse process per a given number of mutations, respectively.
Figure 8
Figure 8
Flow chart of the simulation of point mutations for total proteomes.

Similar articles

Cited by

References

    1. Chothia C, Gough J, Vogel C, Teichmann SA. Evolution of the protein repertoire. Science. 2003;300:1701–1703. - PubMed
    1. Koonin EV, Wolf YI, Karev GP. The structure of the protein universe and genome evolution. Nature. 2002;420:218–223. - PubMed
    1. Qian J, Luscombe NM, Gerstein M. Protein family and fold occurrence in genomes: power-law behaviour and evolutionary model. J Mol Biol. 2001;313:673–681. - PubMed
    1. Huynen MA, van Nimwegen E. The frequency distribution of gene family sizes in complete genomes. Mol Biol Evol. 1998;15:583–589. - PubMed
    1. Vogel C, Teichmann SA, Pereira-Leal J. The relationship between domain duplication and recombination. J Mol Biol. 2005;346:355–365. - PubMed