

Intermolecular interaction of phosphatidylinositol with the lipid raft molecules sphingomyelin and cholesterol
- PMID: 27857570
- PMCID: PMC5036605
- DOI: 10.2142/biophysics.4.1
Intermolecular interaction of phosphatidylinositol with the lipid raft molecules sphingomyelin and cholesterol
Abstract
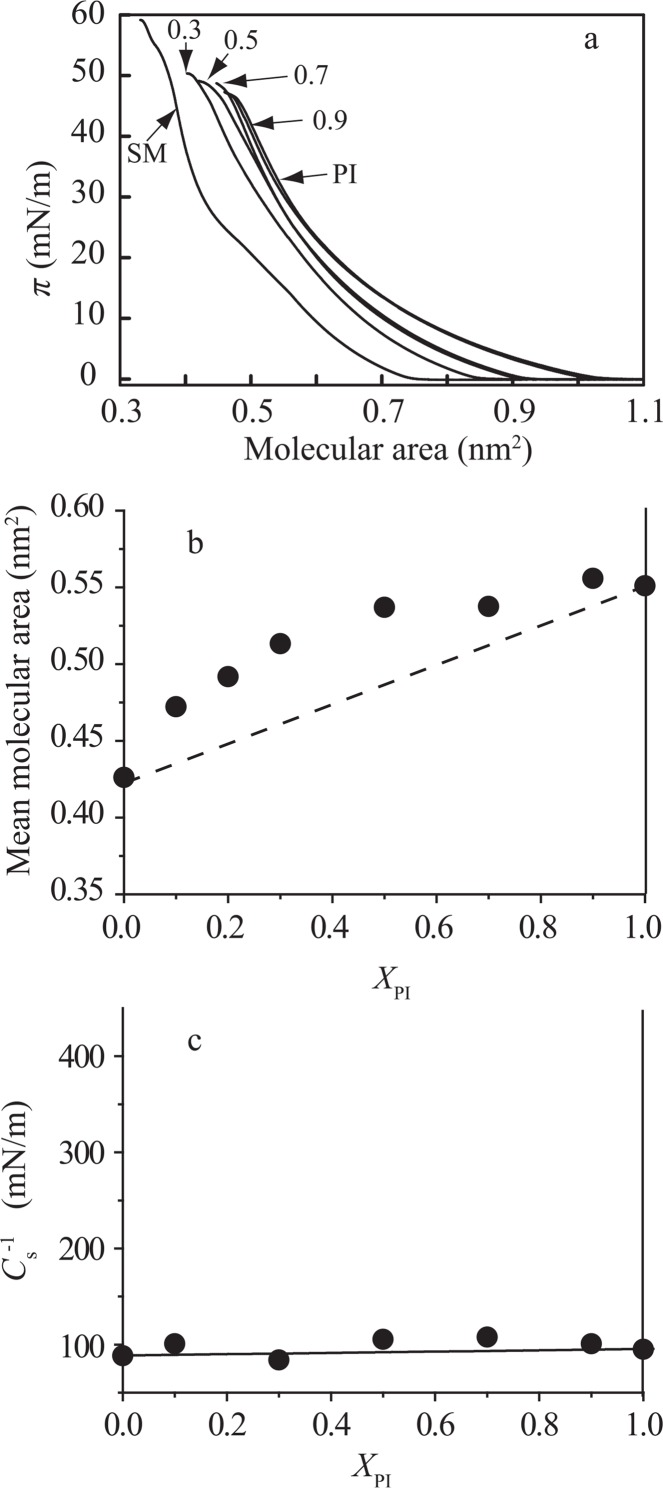
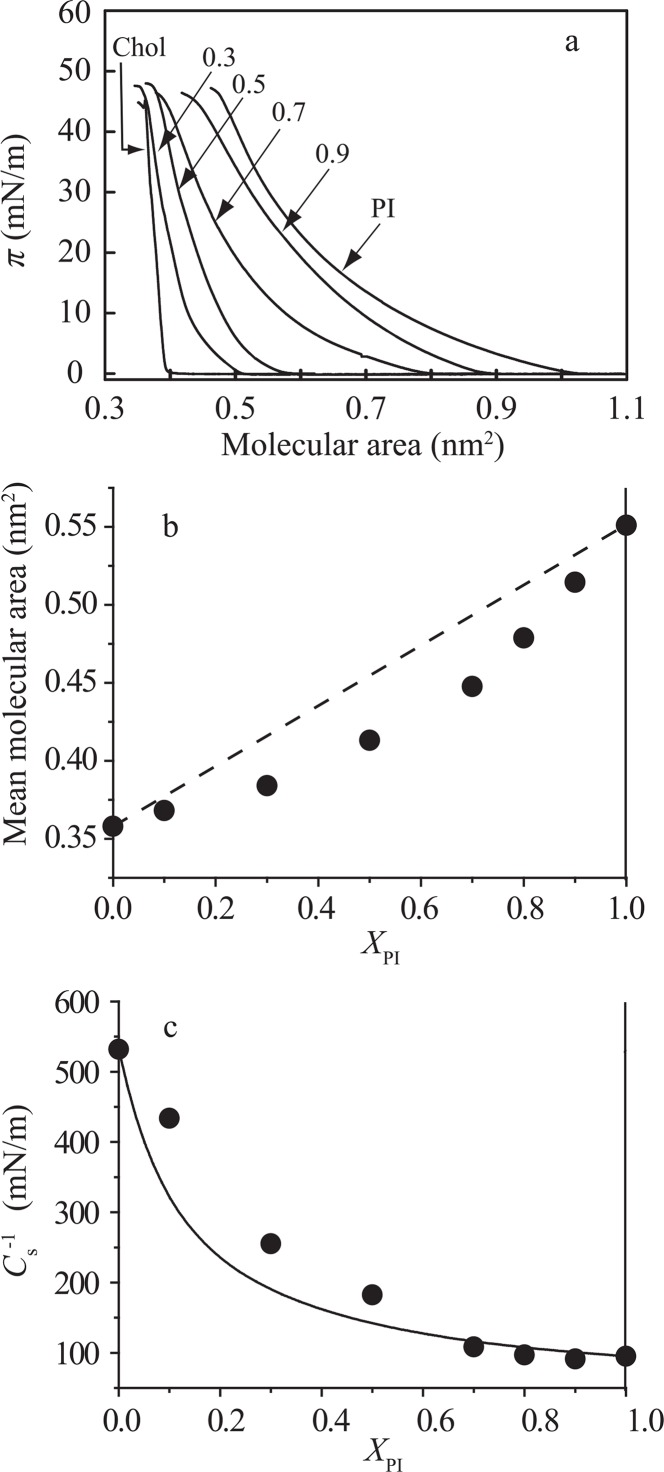
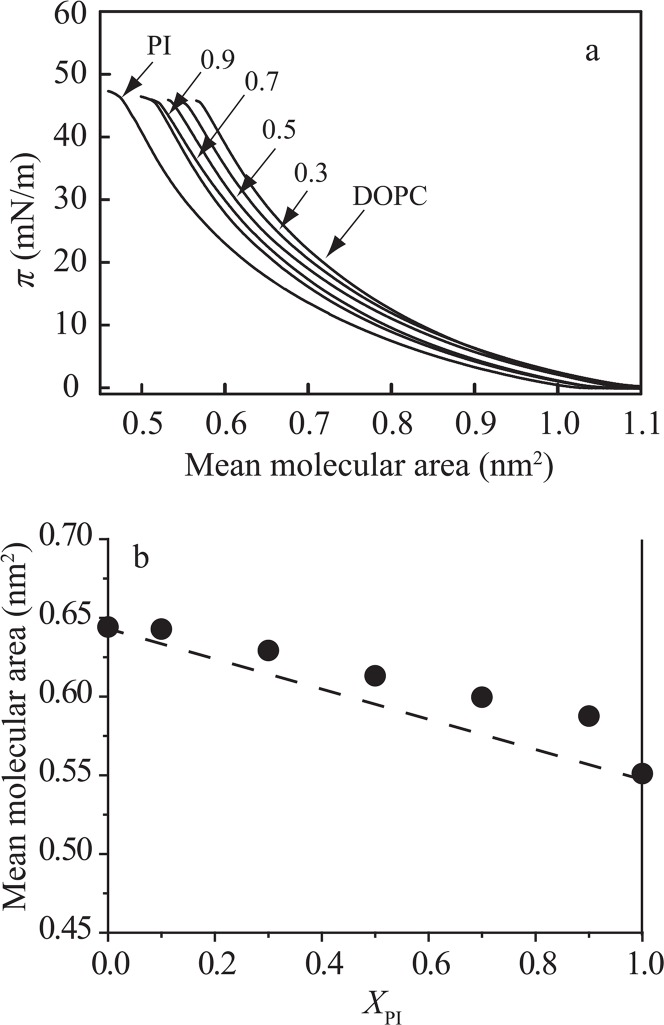
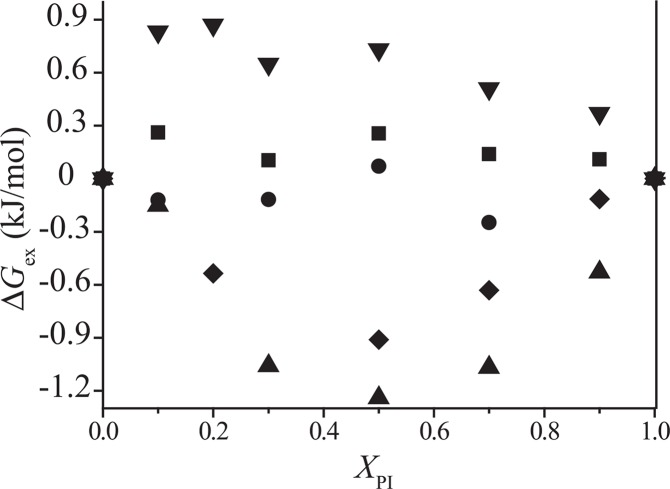
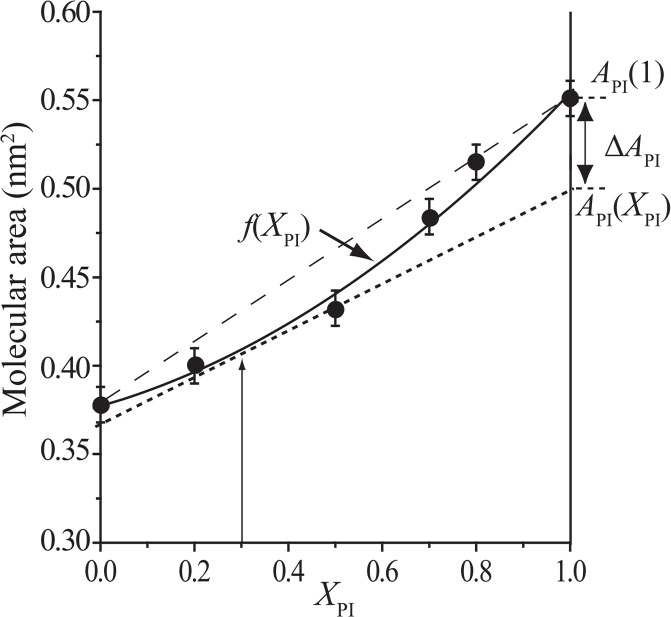
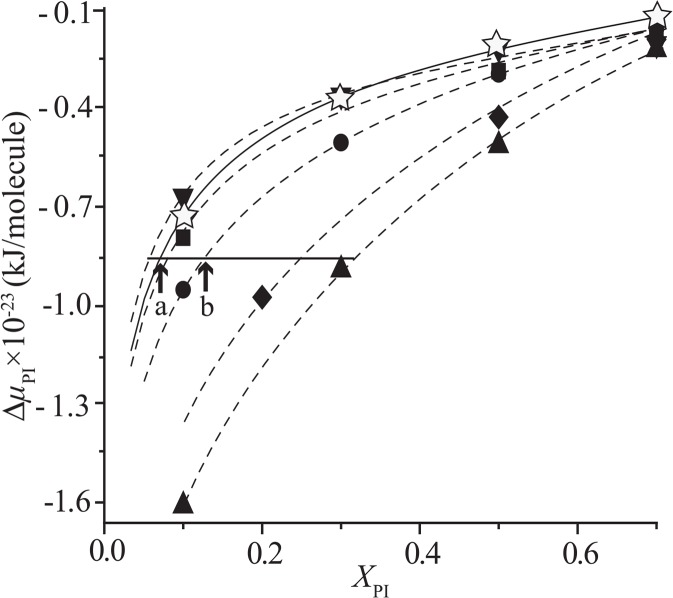
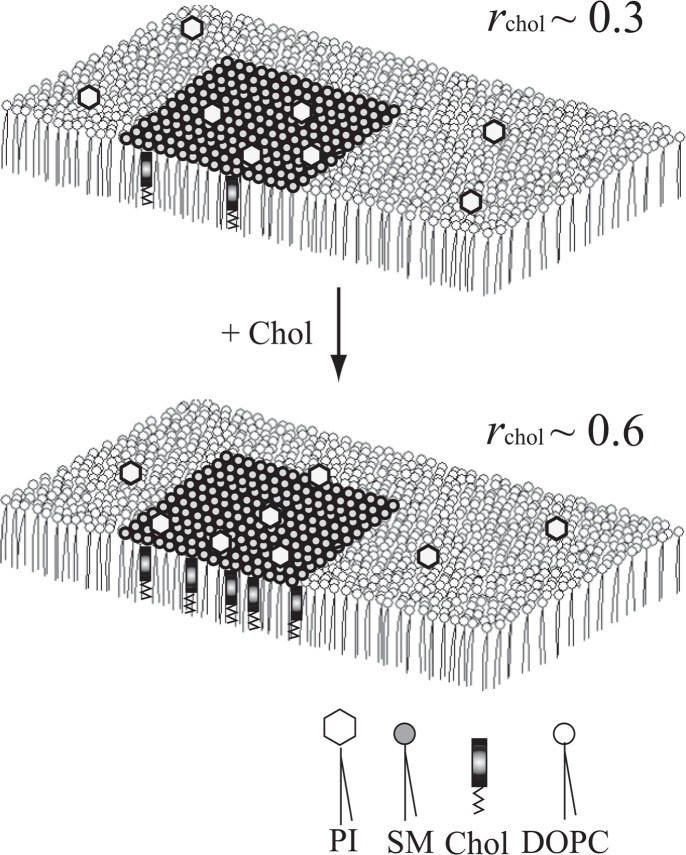
Diacylphosphatidylinositol (PI) is the starting reactant in the process of phosphatidylinositide-related signal transduction mediated through the lipid raft domain. We investigated intermolecular interactions of PI with major raft components, sphingomyelin (SM) and cholesterol (Chol), using surface pressure-molecular area (π-A) isotherm measurements. The classical mean molecular area versus composition plot showed that the measured mean molecular areas are smaller in PI/Chol mixed monolayers and larger in PI/SM mixed monolayers than those calculated on the basis of the ideal additivity. These results indicate that PI interacts attractively with Chol and repulsively with SM. In addition, we energetically evaluated the interaction of PI with SM/Chol mixtures and found that the mixing energy of PI/SM/Chol ternary monolayers decreased as the molar ratio of Chol to SM increased. In order to quantitatively analyze the distribution of PI we calculated the chemical potentials of mixing of PI into the SM/Chol mixed monolayer and into the dioleoylphosphatidylcholine (DOPC) monolayer, which was used as a model for the fluid matrix, on the basis of partial molecular area analysis. Analysis using the chemical potential of mixing of PI suggested that partition of PI molecules between these two monolayers can be changed by a factor of about 1.7 in response to change in Chol molar fraction in the SM/Chol mixed monolayer from 0.3 to 0.6 when the concentration of PI in the DOPC monolayer is kept constant at 7 mol%.
Keywords: Gibbs mixing energy; chemical potential of mixing; model monolayer; molecular distribution; π–A isotherm.
Figures
Similar articles
-
X-ray grazing incidence diffraction and Langmuir monolayer studies of the interaction of beta-cyclodextrin with model lipid membranes.J Colloid Interface Sci. 2010 Aug 15;348(2):511-21. doi: 10.1016/j.jcis.2010.04.086. Epub 2010 May 4. J Colloid Interface Sci. 2010. PMID: 20493495
-
Monounsaturated PE does not phase-separate from the lipid raft molecules sphingomyelin and cholesterol: role for polyunsaturation?Biochemistry. 2002 Aug 27;41(34):10593-602. doi: 10.1021/bi025712b. Biochemistry. 2002. PMID: 12186543
-
Properties of Langmuir and solid supported lipid films with sphingomyelin.Adv Colloid Interface Sci. 2015 Aug;222:385-97. doi: 10.1016/j.cis.2014.03.008. Epub 2014 Mar 28. Adv Colloid Interface Sci. 2015. PMID: 24725646 Review.
-
Interaction of cholesterol in ternary lipid mixtures investigated using single-molecule fluorescence.Langmuir. 2015 Jan 27;31(3):995-1004. doi: 10.1021/la503797w. Epub 2015 Jan 9. Langmuir. 2015. PMID: 25531175
-
Cholesterol interactions with ceramide and sphingomyelin.Chem Phys Lipids. 2016 Sep;199:26-34. doi: 10.1016/j.chemphyslip.2016.04.002. Epub 2016 Apr 27. Chem Phys Lipids. 2016. PMID: 27132117 Review.
References
-
- Payrastre B, Missy K, Giuriato S, Bodin S, Plantavid M, Gratacap M. Phosphoinositides: key players in cell signaling, in time and space. Cell Signal. 2001;13:377–387. - PubMed
-
- Simonsen AE, Wurmser AE, Emr SD, Stenmark H. The role of phosphoinositides in membrane transport. Curr. Opin. Cell Biol. 2001;13:485–492. - PubMed
-
- Pochynyuk O, Tong Q, Staruschenko A, Ma HP, Stockland JD. Regulation of the epithelial Na+ channel (ENaC) by phosphatidylinositides. Am. J. Physiol. Renal. Physiol. 2006;290:949–957. - PubMed
-
- Simons K, Ikonen E. Functional raft in cell membranes. Nature. 1997;387:569–572. - PubMed
LinkOut - more resources
Full Text Sources
Research Materials
Miscellaneous