

Inhibition of thermophilic F1-ATPase by the ε subunit takes different path from the ADP-Mg inhibition
- PMID: 27857586
- PMCID: PMC5036666
- DOI: 10.2142/biophysics.6.59
Inhibition of thermophilic F1-ATPase by the ε subunit takes different path from the ADP-Mg inhibition
Abstract
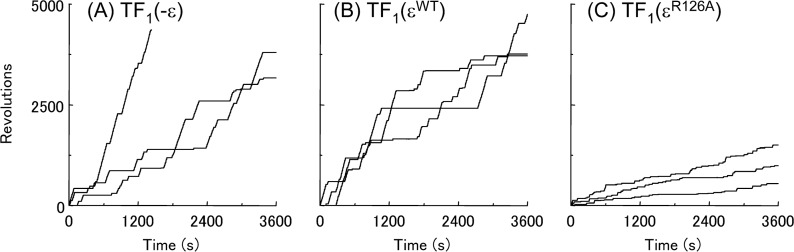
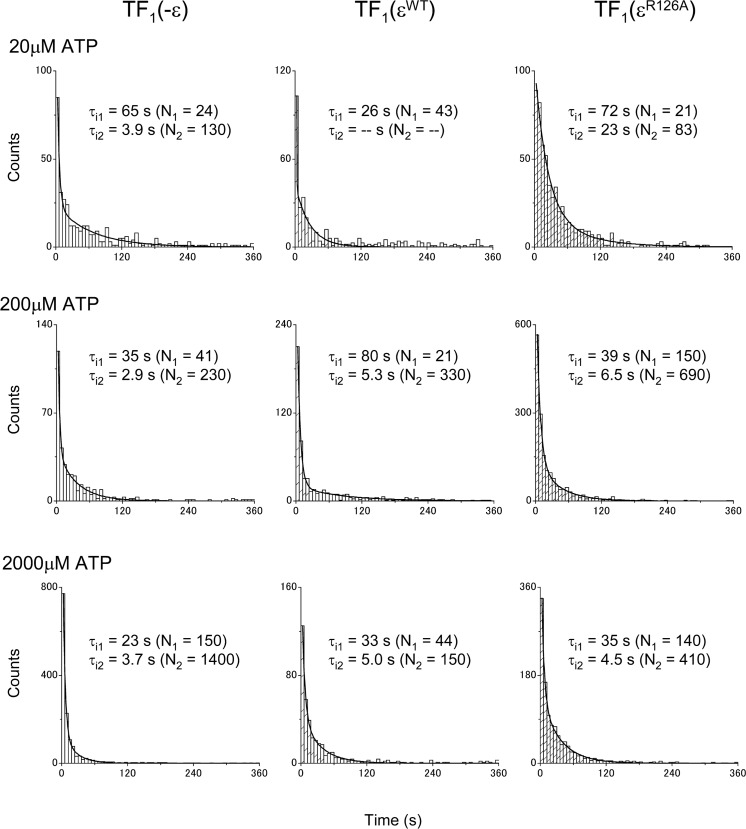
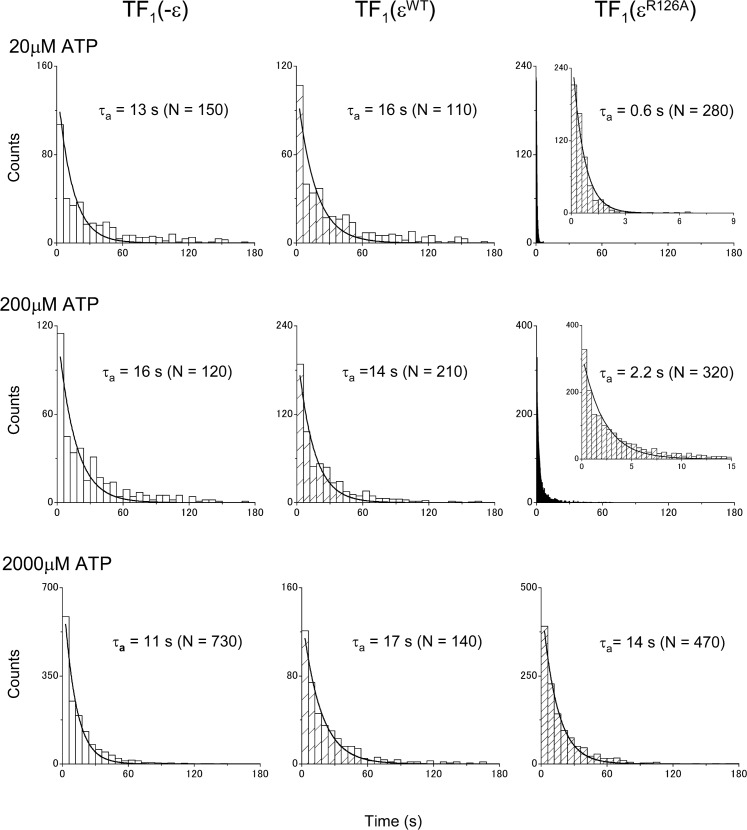
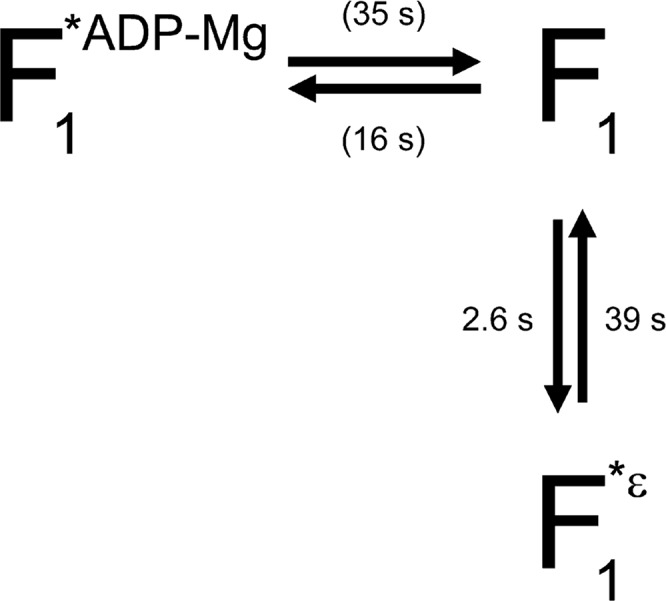
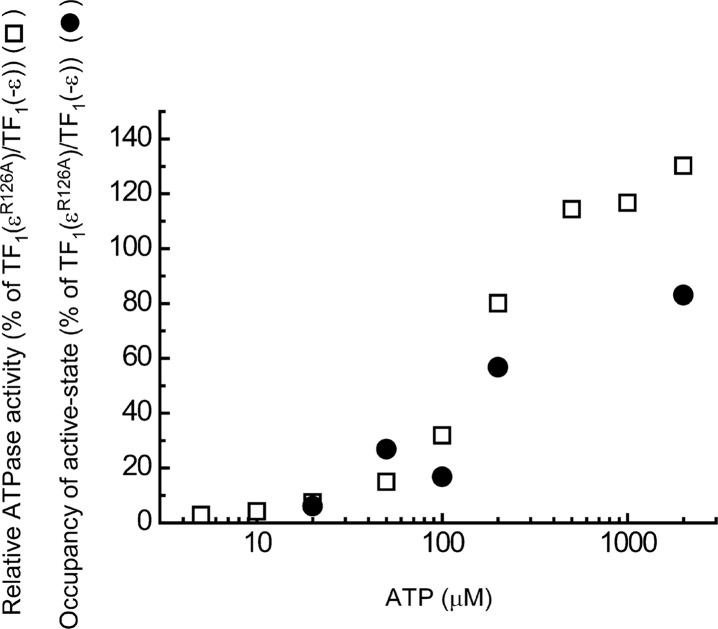
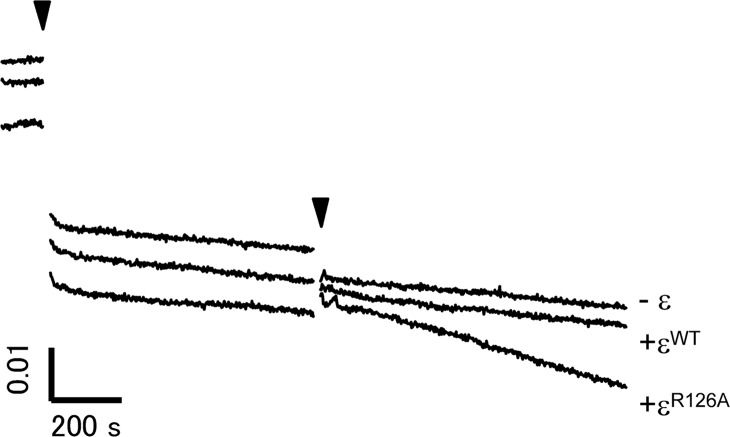
The F1-ATPase, the soluble part of FoF1-ATP synthase, is a rotary molecular motor consisting of α3β3γδε. The γ and ε subunits rotate relative to the α3β3δ sub-complex on ATP hydrolysis by the β subunit. The ε subunit is known as an endogenous inhibitor of the ATPase activity of the F1-ATPase and is believed to function as a regulator of the ATP synthase. This inhibition by the ε subunit (ε inhibition) of F1-ATPase from thermophilic Bacillus PS3 was analyzed by single molecule measurements. By using a mutant ε subunit deficient in ATP binding, reversible transitions between active and inactive states were observed. Analysis of pause and rotation durations showed that the ε inhibition takes a different path from the ADP-Mg inhibition. Furthermore, the addition of the mutant ε subunit to the α3β3γ sub-complex was found to facilitate recovery of the ATPase activity from the ADP-Mg inhibition. Thus, it was concluded that these two inhibitions are essentially exclusive of each other.
Keywords: ADP inhibited form; ATP synthase; regulation.
Figures
Similar articles
-
The regulator of the F1 motor: inhibition of rotation of cyanobacterial F1-ATPase by the epsilon subunit.EMBO J. 2006 Oct 4;25(19):4596-604. doi: 10.1038/sj.emboj.7601348. Epub 2006 Sep 14. EMBO J. 2006. PMID: 16977308 Free PMC article.
-
Isolated epsilon subunit of thermophilic F1-ATPase binds ATP.J Biol Chem. 2003 Sep 19;278(38):36013-6. doi: 10.1074/jbc.M306140200. Epub 2003 Jul 1. J Biol Chem. 2003. PMID: 12837747
-
Structure of the γ-ε complex of cyanobacterial F1-ATPase reveals a suppression mechanism of the γ subunit on ATP hydrolysis in phototrophs.Biochem J. 2018 Sep 18;475(18):2925-2939. doi: 10.1042/BCJ20180481. Biochem J. 2018. PMID: 30054433
-
ATP synthase from Escherichia coli: Mechanism of rotational catalysis, and inhibition with the ε subunit and phytopolyphenols.Biochim Biophys Acta. 2016 Feb;1857(2):129-140. doi: 10.1016/j.bbabio.2015.11.005. Epub 2015 Nov 14. Biochim Biophys Acta. 2016. PMID: 26589785 Review.
-
Recent developments on structural and functional aspects of the F1 sector of H+-linked ATPases.Mol Cell Biochem. 1984;60(1):33-71. doi: 10.1007/BF00226299. Mol Cell Biochem. 1984. PMID: 6231469 Review.
Cited by
-
A conformational change of the γ subunit indirectly regulates the activity of cyanobacterial F1-ATPase.J Biol Chem. 2012 Nov 9;287(46):38695-704. doi: 10.1074/jbc.M112.395053. Epub 2012 Sep 25. J Biol Chem. 2012. PMID: 23012354 Free PMC article.
-
ε subunit of Bacillus subtilis F1-ATPase relieves MgADP inhibition.PLoS One. 2013 Aug 13;8(8):e73888. doi: 10.1371/journal.pone.0073888. eCollection 2013. PLoS One. 2013. PMID: 23967352 Free PMC article.
-
F1-ATPase conformational cycle from simultaneous single-molecule FRET and rotation measurements.Proc Natl Acad Sci U S A. 2016 May 24;113(21):E2916-24. doi: 10.1073/pnas.1524720113. Epub 2016 May 10. Proc Natl Acad Sci U S A. 2016. PMID: 27166420 Free PMC article.
-
Regulation of ATP hydrolysis by the ε subunit, ζ subunit and Mg-ADP in the ATP synthase of Paracoccus denitrificans.Biochim Biophys Acta Bioenerg. 2021 Mar 1;1862(3):148355. doi: 10.1016/j.bbabio.2020.148355. Epub 2020 Dec 13. Biochim Biophys Acta Bioenerg. 2021. PMID: 33321110 Free PMC article.
-
Insights into the regulatory function of the ɛ subunit from bacterial F-type ATP synthases: a comparison of structural, biochemical and biophysical data.Open Biol. 2018 May;8(5):170275. doi: 10.1098/rsob.170275. Open Biol. 2018. PMID: 29769322 Free PMC article. Review.
References
-
- Boyer PD. The ATP synthase—a splendid molecular machine. Annu. Rev. Biochem. 1997;66:717–749. - PubMed
-
- Yoshida M, Muneyuki E, Hisabori T. ATP synthase—a marvellous rotary engine of the cell. Nat. Rev. Mol. Cell Biol. 2001;2:669–677. - PubMed
-
- Yasuda R, Noji H, Yoshida M, Kinosita K, Jr, Itoh H. Resolution of distinct rotational substeps by submillisecond kinetic analysis of F1-ATPase. Nature. 2001;410:898–904. - PubMed
-
- Adachi K, Oiwa K, Nishizaka T, Furuike S, Noji H, Itoh H, Yoshida M, Kinosita K., Jr Coupling of rotation and catalysis in F1-ATPase revealed by single-molecule imaging and manipulation. Cell. 2007;130:309–321. - PubMed
-
- Watanabe R, Iino R, Noji H. Phosphate release in F1-ATPase catalytic cycle follows ADP release. Nat. Chem. Biol. 2010;6:814–820. - PubMed
LinkOut - more resources
Full Text Sources