. 2011 Feb 4:7:11-19.
doi: 10.2142/biophysics.7.11. eCollection 2011.

Two-dimensional periodic texture of actin filaments formed upon drying

Affiliations

Two-dimensional periodic texture of actin filaments formed upon drying

Hajime Honda et al. Biophysics (Nagoya-shi). .

Abstract

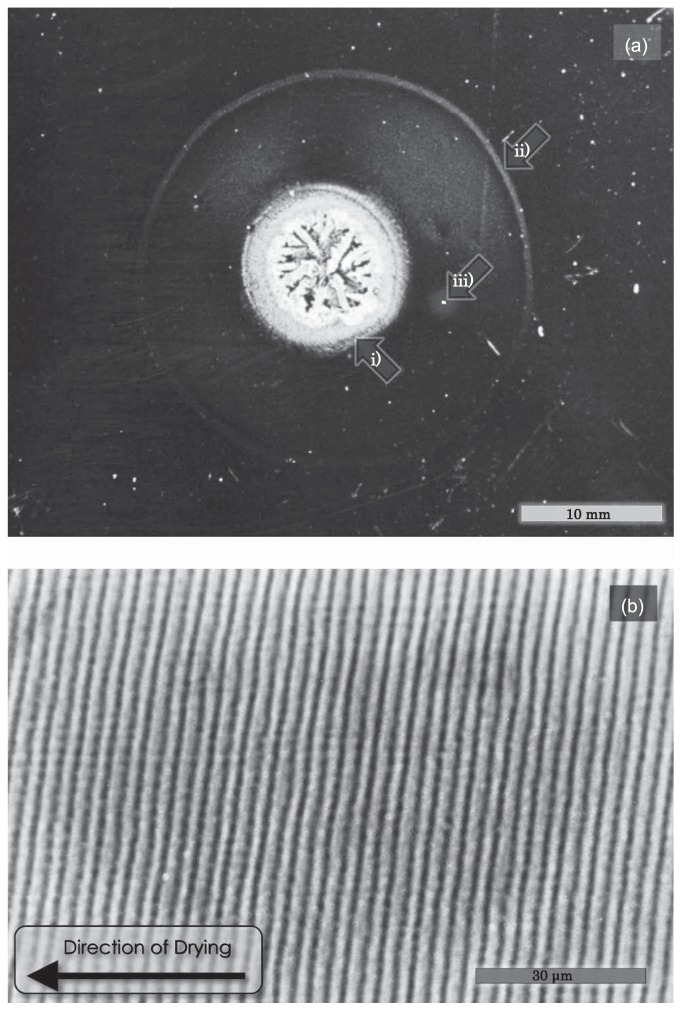
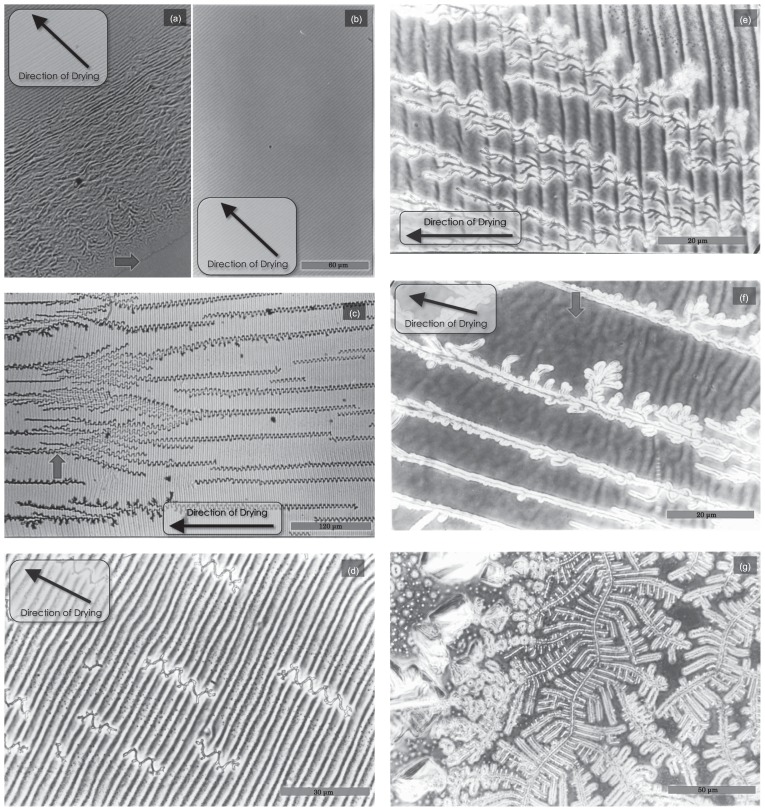
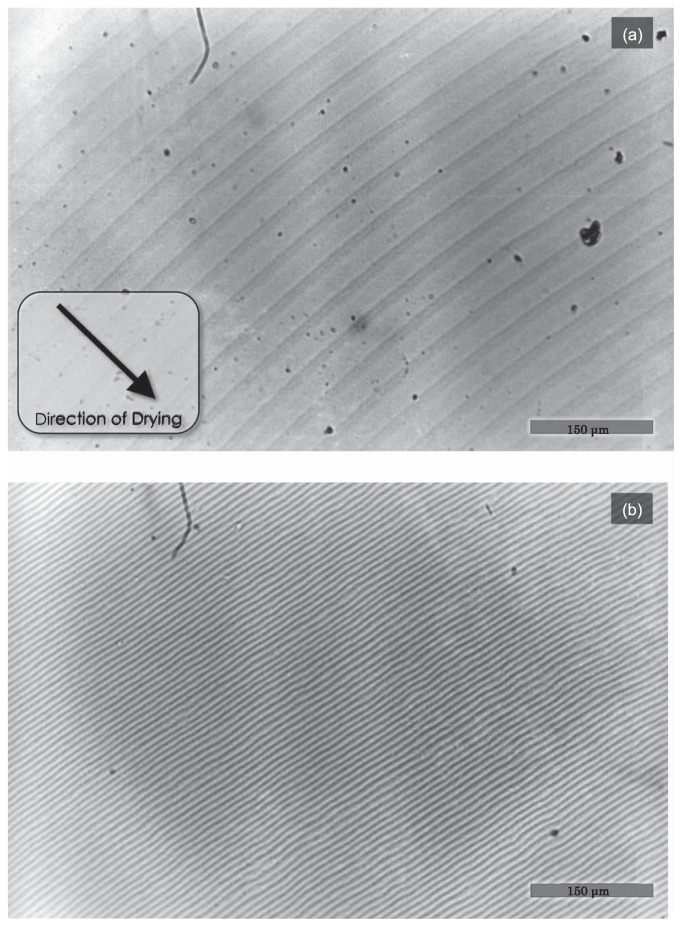
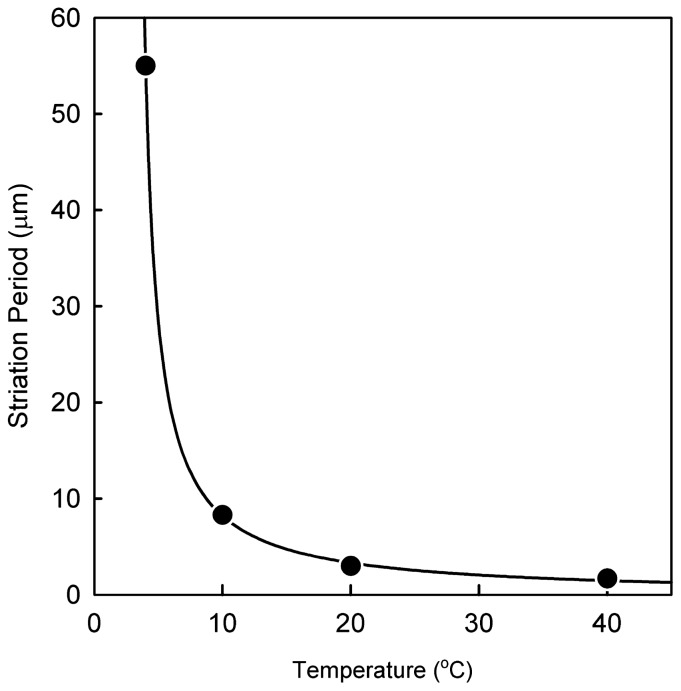
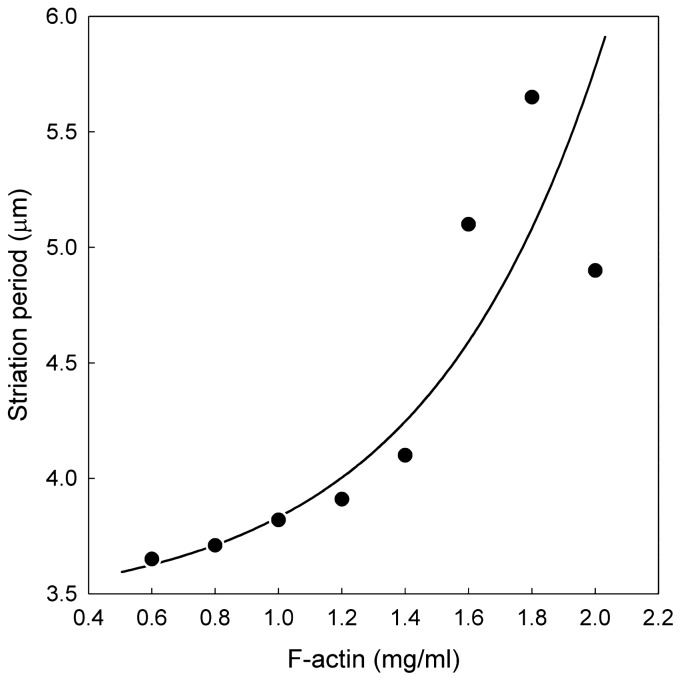
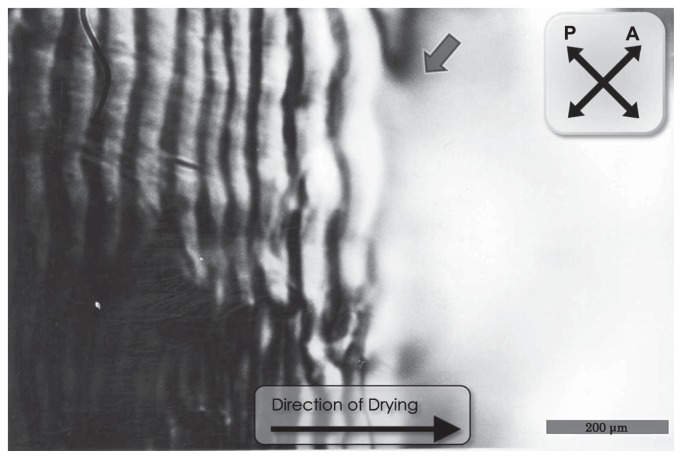
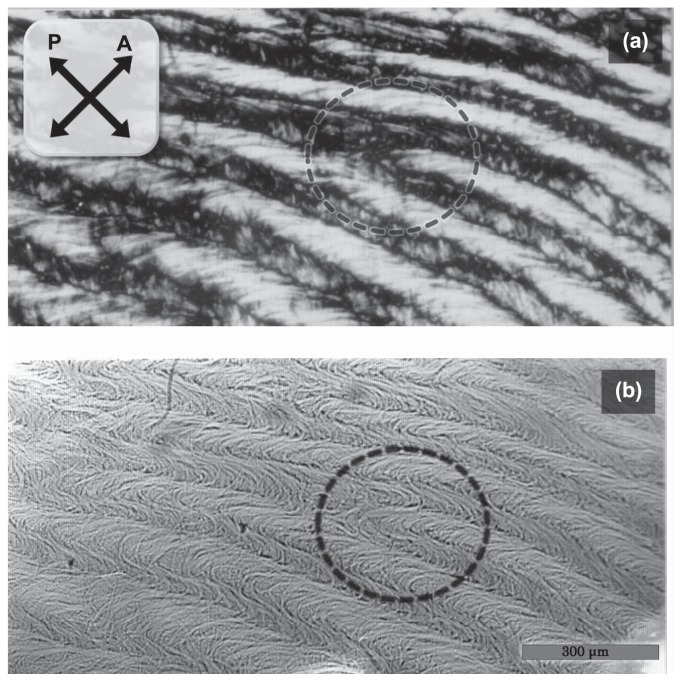
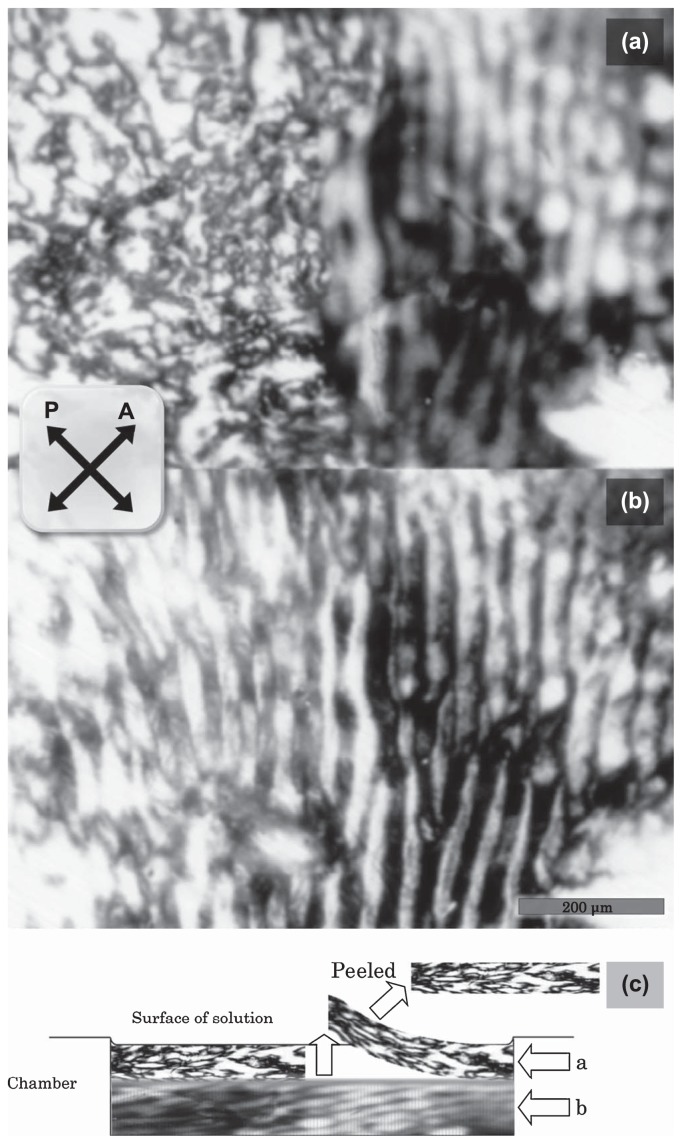
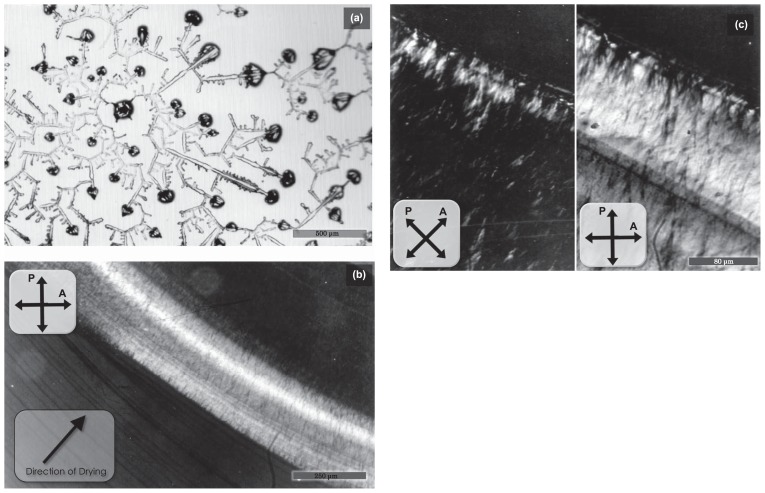
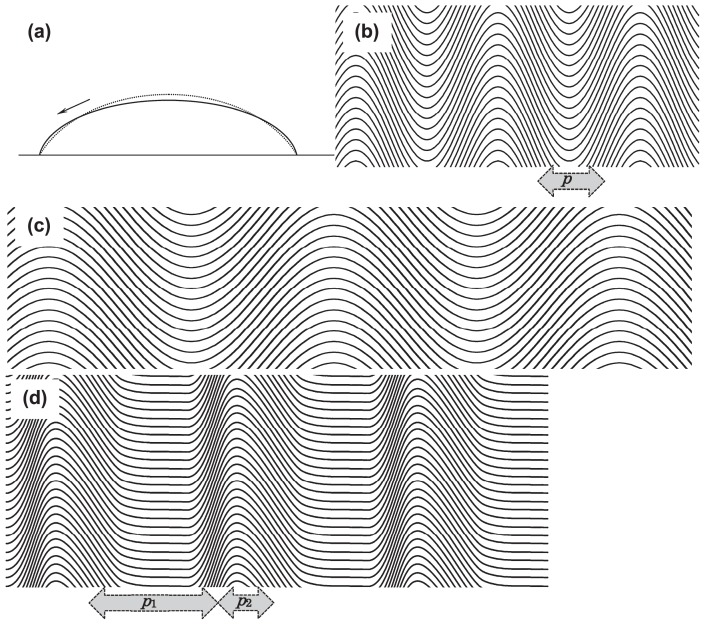
We found that a solution of actin filaments can form a periodic texture in the process of drying on a flat glass surface in the air; the periodic texture was composed of smooth meandering bundles of actin filaments. We also found that a branched salt crystal grows in the space between the meandering bundles of actin filaments. The distance between the adjacent striae (striation period) in the resulting dried two-dimensional pattern of striation decreased from about 50 to 2 μm, as the ambient temperature was increased from 4 to 40°C at 1 mg/ml actin, and showed an increasing tendency from a few to several tens μm with the increase in the initial concentration of actin filaments from 0.6 to 2.0mg/ml at room temperature. As the speed of drying is increased at a certain temperature, the striation period was also found to decrease. We propose that the formation of the two-dimensional striation pattern of bundles of actin filaments is the result of condensation of proteins due to dehydration, and suggest that the solvent flow from the center to the periphery of the sample causes the meandering of actin filaments.

Keywords: Drying of actin solution; liquid crystal; striation pattern; texturing.


Figures

Figure 1
Figure 1
General view of the two-dimensional texture obtained by natural drying of F-actin solution. (a) About 70 μl of 1.0mg/ml F-actin solution containing 0.1M KCl, 5mM Tris-HCl (pH 8.0) and 0.2mM ATP was placed on a glass slide at room temperature. The sample was dried under normal atmospheric conditions for about 5 hrs. Image, bright-field. Scale bar, 10.0 mm. Salt crystal region and the periphery of the dried sample are indicated with arrows i) and ii), respectively. (b) A magnified view under phase-contrast microscope of the portion surrounded by a white square with an arrow iii) in (a) shows the concentric circular striation. Scale bar, 30 μm.
Figure 2
Figure 2
Typical features of the dried sample observed under phase-contrast microscope at a high magnification. The same F-actin solution as shown in Figure 1 was dried at 30°C under normal atmospheric conditions. (a) Panel taken at the peripheral region where the complicated pattern of dried actin filaments was gradually forced to become a periodic pattern. The periphery is indicated by the arrow. (b) The periodic striation pattern spread widely at about 2mm away from the peripheral. Scale bar, 60 μm. (c) Approaching the central region, salt crystals began to grow in a winding manner. A branched salt crystal is shown by the arrow. Scale bar, 120 μm. (d, e) Panels showing close-up views of the area surrounding the salt crystals, which branched in a dendritic manner. Scale bars, 30 μm (d) and 20 μm (e). (f) Periodic textures of the sample gradually diminished as salt crystals grew. Accordingly, an irregular striation pattern appeared, as indicated by the arrow. Scale bar, 20 μm. (g) Only the salt crystals were observed near the center of the sample. Scale bar, 50 μm.
Figure 3
Figure 3
Difference of the striation pattern formed by drying at different temperatures. Concentric circular textures formed at 4°C (a) and 10°C (b) were observed by phase-contrast microscope. An F-actin solution was the same as in Figure 1. Scale bars, 150 μm.
Figure 4
Figure 4
Relationship between striation period and the temperature at which samples were dried. F-actin solution was dried under the same conditions as in Figure 1 on the glass slide which was mounted on the temperature-controlled brass block. The temperature of the block was plotted on the abscissa. Striation period (p) was inversely proportional to temperature (T) as shown by the solid curve p = 0.11 + 58.7/(T − 3.9).
Figure 5
Figure 5
Relationship between striation period and F-actin concentrations. Various concentrations of F-actin solutions were dried under the same condition as in Figure 1 on the glass slide which was mounted on the temperature-controlled brass block at 25°C. The striation period increased in accordance with the increase in the concentration of F-actin. No striation was formed at the F-actin concentration lower than 0.4mg/ml.
Figure 6
Figure 6
Polarizing micrograph showing the wet part of sample in the process of drying. Two mg/ml of F-actin was dried under the same condition as in Figure 1. The directions of polarizer (P) and analyzer (A) are shown by crossed bipolar arrows. The edge of the wet region is indicated by an arrow. Scale bar, 200 μm.
Figure 7
Figure 7
Striation pattern composed of meandering bundles of F-actin which were formed in a high concentration of F-actin. A polarization image (a) and a bright-field image (b) were obtained before and after staining with Coomassie Brilliant Blue, respectively. The staining was done after the sample was almost dried. This periodic pattern was formed at 10mg/ml of F-actin in 0.1M KCl, 1mM MgCl2 at room temperature according to method 2, described in Materials and Methods. The directions of polarizer (P) and analyzer (A) in the polarizing micrograph (a) are shown by crossed bipolar arrows. Scale bar, 300 μm.
Figure 8
Figure 8
Polarizing micrographs obtained from two different focal planes (a and b) of the sample prepared according to method 2 in a cylindrical chamber and the schematic representation of the sample well and the focal planes (c). (a) Photo taken at the focus near the surface and (b) photo taken at the near-central depth of the solution. The left part of each micrograph was covered with surface structure of the sample and the right part was focused of the area beneath them as revealed by peeling away the dried surface using tweezers, where the striation pattern was observed. Scale bar, 200 μm. The schematic illustration (c) represents the location of the edge of the peeled surface structure and the focal plane taken for panels (a) and (b).
Figure 9
Figure 9
Polarizing micrograph showing the two-dimensional pattern formed by natural drying of BSA solution (a) and tropomyosin solution (b, c). Drying was performed according to method 1, as described in Materials and Methods. (a) Concentration of BSA, 1.0mg/ml. Solvent, 0.1M KCl, 0.5mM sodium bicarbonate. Scale bar, 500 μm. (b, c) Concentration of tropomyosin, 1.0mg/ml. Solvent, 1.0mM MgCl2, 0.5mM sodium bicarbonate. Photographs in (c) were taken by high magnification in a different place from that of (b). Scale bars, 250 μm (b) and 80 μm (c).
Figure 10
Figure 10
Schematic showing how the striation pattern is formed in F-actin solution during the process of drying. (a) Cross-sectional view of the shape of F-actin solution spread on glass slide surface, showing the direction of flow due to the evaporation of water. The solid curve shows the equilibrium shape of the solution obtained without evaporation of water. Because the evaporation uniformly occurs from the surface, the surface shape deviates from the equilibrium shape, as shown by the dashed curve. This results in the outward flow of solvent in one direction but not in a convectional manner. (b, c), The wavy shape of F-actin bundles and the periodic striation patterns (b) for flexible bundles or in the case of fast drying and (c) for rigid bundles or in the case of slow drying. Solid curves schematically show the F-actin bundles. Vertical dark bands, correspond to the black lines observed in dried samples under the microscope. Here, the shape of the F-actin bundles is assumed to be sinusoidal, so that the period p is uniform. (d) The striation pattern obtained by assuming the asymmetric wavy shape of the F-actin bundles, seems to be more realistic. In the present study, the striation period was defined as the average separation between the adjacent black lines, irrespective of the repetitive long (p1) and short (p2) periods. For more details, see the text.

Similar articles

Cited by

References

    1. Oosawa F, Asakura S. Thermodynamics of the Polymerization of Protein. Academic Press; London: 1975.
    1. Coppin CM, Leavis PC. Quantitation of liquid-crystalline ordering in F-actin solutions. Biophys J. 1992;63:794–787. - PMC - PubMed
    1. Newman J, Mroczka N, Schick KL. The spontaneous formation of long-range order in actin polymer networks. Macromolecules. 1989;22:1006–1008.
    1. Suzuki A, Maeda T, Ito T. Formation of liquid crystalline phase of actin filament solutions and its dependence on filament length as studied by optical birefringence. Biophys J. 1991;59:25–30. - PMC - PubMed
    1. Fujime S, Maeda T, Ishiwata S. In: Biomedical Application of Laser Light Scattering. Sattelle DB, Lee WI, Ware BR, editors. Elsevier Biomed. Press; Amsterdam: 1983. p. 251.