. 2016 Nov 3:10:87.
doi: 10.3389/fncir.2016.00087. eCollection 2016.

Spatial Localization of Sources in the Rat Subthalamic Motor Region Using an Inverse Current Source Density Method

Affiliations

Spatial Localization of Sources in the Rat Subthalamic Motor Region Using an Inverse Current Source Density Method

Kees J van Dijk et al. Front Neural Circuits. .

Abstract

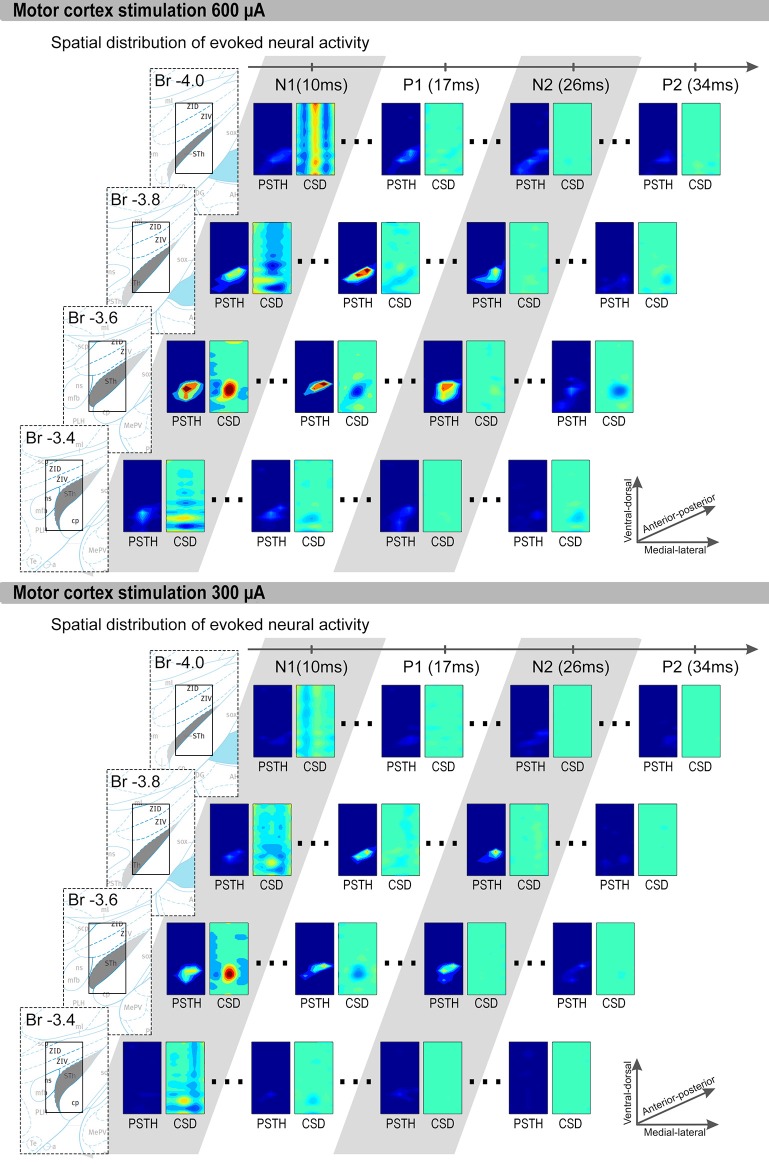
Objective: In this study we introduce the use of the current source density (CSD) method as a way to visualize the spatial organization of evoked responses in the rat subthalamic nucleus (STN) at fixed time stamps resulting from motor cortex stimulation. This method offers opportunities to visualize neuronal input and study the relation between the synaptic input and the neural output of neural populations. Approach: Motor cortex evoked local field potentials and unit activity were measured in the subthalamic region, with a 3D measurement grid consisting of 320 measurement points and high spatial resolution. This allowed us to visualize the evoked synaptic input by estimating the current source density (CSD) from the measured local field potentials, using the inverse CSD method. At the same time, the neuronal output of the cells within the grid is assessed by calculating post stimulus time histograms. Main results: The CSD method resulted in clear and distinguishable sources and sinks of the neuronal input activity in the STN after motor cortex stimulation. We showed that the center of the synaptic input of the STN from the motor cortex is located dorsal to the input from globus pallidus. Significance: For the first time we have performed CSD analysis on motor cortex stimulation evoked LFP responses in the rat STN as a proof of principle. Our results suggest that the CSD method can be used to gain new insights into the spatial extent of synaptic pathways in brain structures.

Keywords: action potentials; cortical stimulation; inverse current source density analysis; local field potentials; rodents; subthalamic nucleus.


Figures

Figure 1
Figure 1
The evoked LFP and peristimulus time histogram (PSTH) of the unit activity in the STN after 600 μA MCS. At 0 ms the stimulus is given. The negative deflections of the LFP, N1, and N2, are accompanied by an increased spiking rate as seen in the PSTH. In contrast, the positive deflections, P1 and P2, occurred concurrently with a decreased spiking rate in the PSTH.
Figure 2
Figure 2
(A) The 3D electrode grid inside four coronal STN slices (bregma −3.1 to −3.8 mm in the antero-posterior direction). In total, this gives a 4 × 5 × 16 grid (antero-posterior × medio-lateral × dorso-ventral). Note that the four illustrated slices are 0.24 mm apart, in reality the measurements were performed 0.2 mm apart. (B) A selection of a microscope image of a coronal brain slice (Anterior-posterior −3.8 mm relative to Bregma). (C) In the brain slice, the electrode trajectories are pointed out within the STN.
Figure 3
Figure 3
Representative examples of 600 μA and 300 μA MCS evoked CSD and PSTH distributions are shown. The four rows contain coronal slices (bregma −3.4 to −4.0 mm). Each row contain, from left to right: First an image of the brain atlas. The atlas is for visualization purposes only, the STN is denoted in gray and the small rectangle is the size of our measurement grid (0.8 mm × 1.5 mm). We used the coronal atlas slices closest to the measurement grid, i.e., bregma −3.36, −3.60, −3.84, and −3.96. Second, the PSTH and CSD distribution at the time of P1, N1, P2, and N2. Only significantly increased spiking rates are shown in the PSTH distributions, and only sinks (red) and sources (blue) with significant strength are shown in the CSD distributions. The x-axis of each rectangle ranges from most medial recording (bregma 2.1 mm) to the most lateral recording (bregma 2.9 mm). The y-axis of each rectangle ranges from most ventral recording to the most dorsal recording.
Figure 4
Figure 4
The averaged center of mass locations of the CSD sources at time of P1 and the CSD sinks at time of N1, relatively to the center of mass of the evoked unit activity at time of N1. These relative center locations are averaged over all rats which showed a MCS response and is visualized by a color-coded Gaussian ellipsoid. The centroid of the ellipsoid is located on the mean center of mass location and the width of the centroid is the covariance of the center of mass coordinates.
Figure 5
Figure 5
The averaged center of mass locations of the unit activity at time of N1 and at time of N2, relatively to the center of mass of the evoked CSD source at time of N1. These relative center locations are averaged over all rats which showed a MCS response and is visualized by a color-coded Gaussian ellipsoid. The centroid of the ellipsoid is located on the mean center of mass location and the width of the centroid is the covariance of the center of mass coordinates.

References

    1. Afsharpour S. (1985). Topographical projections of the cerebral cortex to the subthalamic nucleus. J. Comp. Neurol. 236, 14–28. 10.1002/cne.902360103 - DOI - PubMed
    1. Andreuccetti D., Fossi R., Petrucci C. (1997). An Internet Resource for the Calculation of the Dielectric Properties of Body Tissues in the Frequency Range 10 Hz - 100 GHz. Florence: IFAC-CNR, Based on data published by C.Gabriel et al. in 1996. Available online at: http://niremf.ifac.cnr.it/tissprop
    1. Bevan M. D., Clarke N. P., Bolam J. P. (1997). Synaptic integration of functionally diverse pallidal information in the entopeduncular nucleus and subthalamic nucleus in the rat. J. Neurosci. 17, 308–324. - PMC - PubMed
    1. Bour L. J., Lourens M. A., Verhagen R., de Bie R. M., van den Munckhof P., Schuurman P. R., et al. . (2015). Directional recording of subthalamic spectral power densities in parkinson's disease and the effect of steering deep brain stimulation. Brain Stimul. 8, 730–741. 10.1016/j.brs.2015.02.002 - DOI - PubMed
    1. Brunenberg E. J., Moeskops P., Backes W. H., Pollo C., Cammoun L., Vilanova A., et al. . (2012). Structural and resting state functional connectivity of the subthalamic nucleus: identification of motor STN parts and the hyperdirect pathway. PLoS ONE 7:e39061. 10.1371/journal.pone.0039061 - DOI - PMC - PubMed

Publication types

LinkOut - more resources