. 2017 Jan;58(1):94-104.
doi: 10.1111/epi.13614. Epub 2016 Nov 18.

Reactivation of seizure-related changes to interictal spike shape and synchrony during postseizure sleep in patients

Affiliations

Reactivation of seizure-related changes to interictal spike shape and synchrony during postseizure sleep in patients

Mark R Bower et al. Epilepsia. 2017 Jan.

Abstract

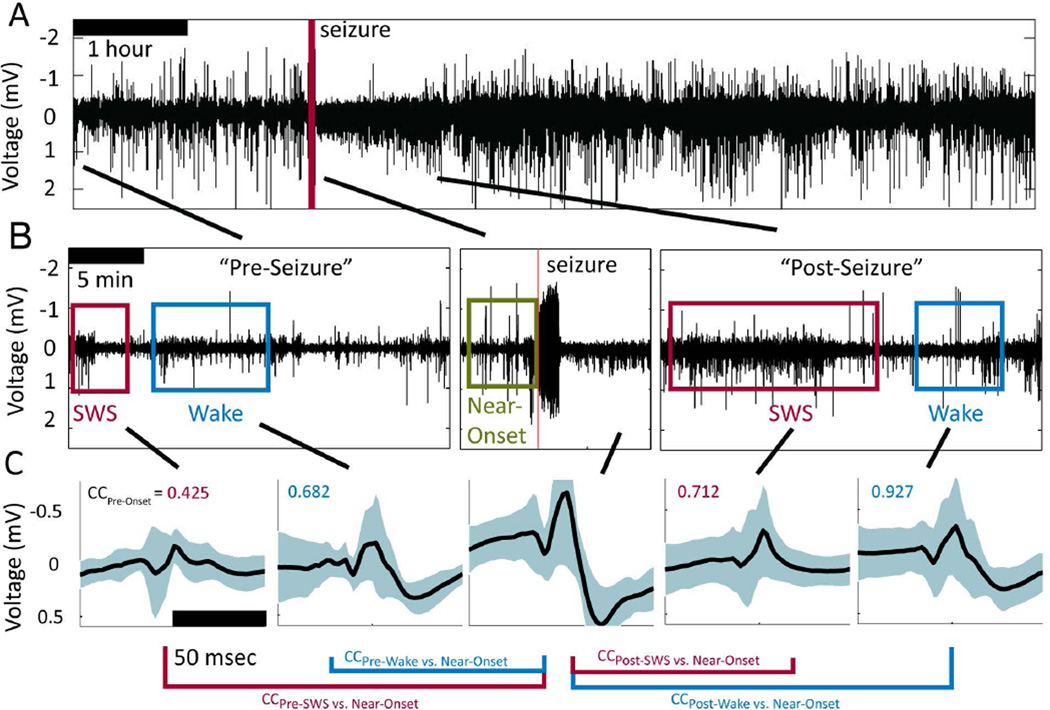
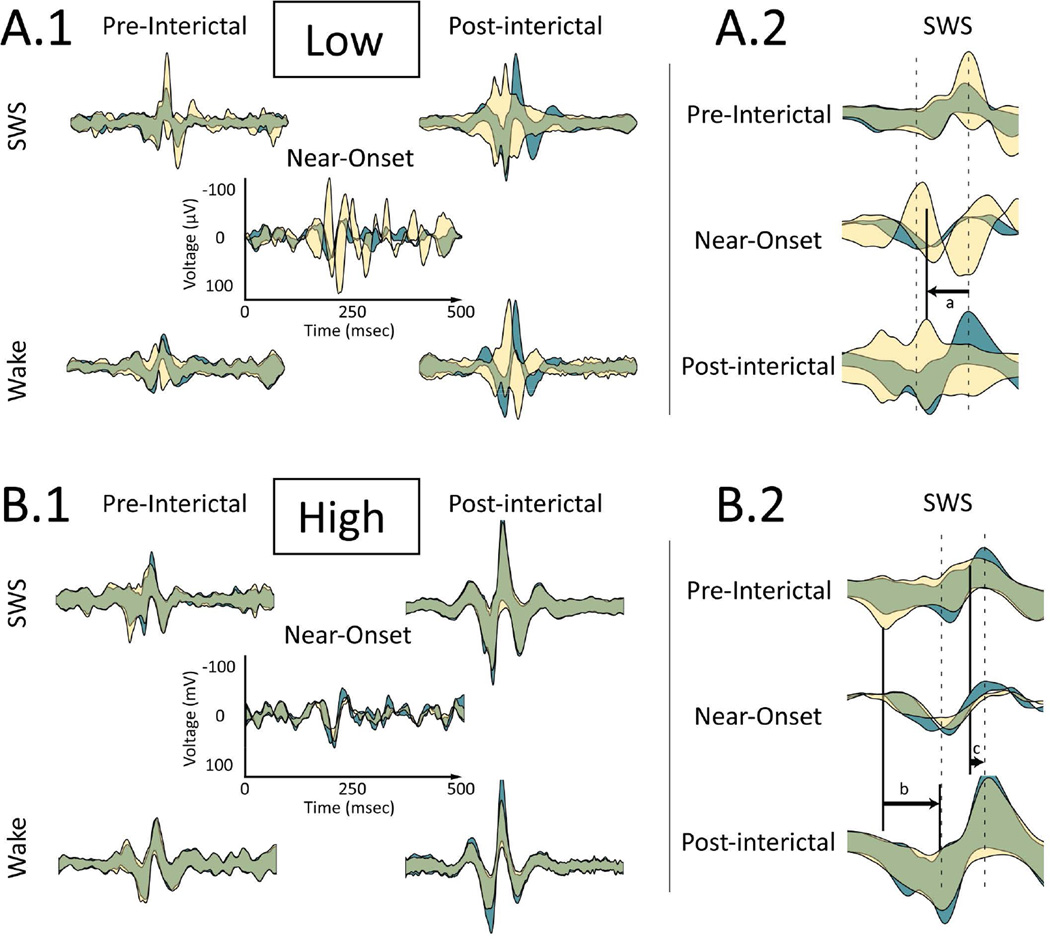
Objective: Local field potentials (LFPs) arise from synchronous activation of millions of neurons, producing seemingly consistent waveform shapes and relative synchrony across electrodes. Interictal spikes (IISs) are LFPs associated with epilepsy that are commonly used to guide surgical resection. Recently, changes in neuronal firing patterns observed in the minutes preceding seizure onset were found to be reactivated during postseizure sleep, a process called seizure-related consolidation (SRC), due to similarities with learning-related consolidation. Because IISs arise from summed neural activity, we hypothesized that changes in IIS shape and relative synchrony would be observed in the minutes preceding seizure onset and would be reactivated preferentially during postseizure slow-wave sleep (SWS).

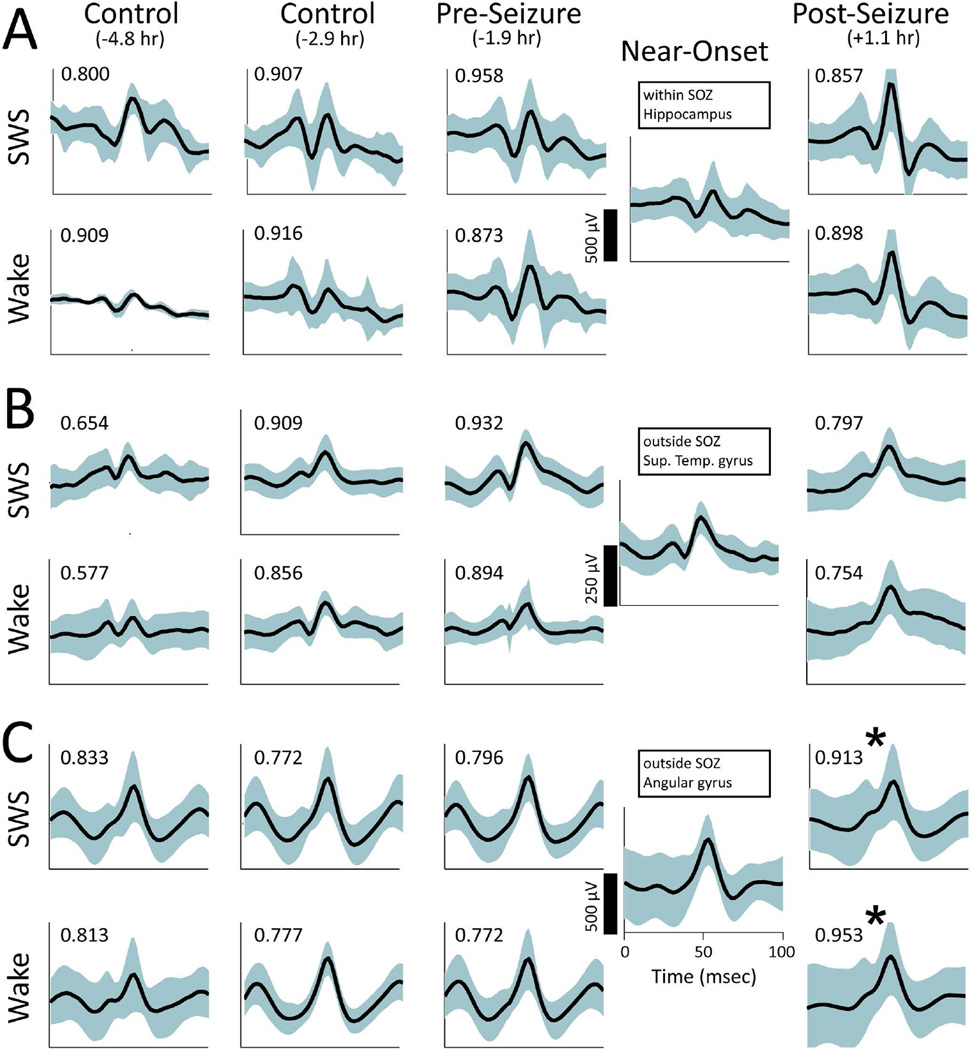
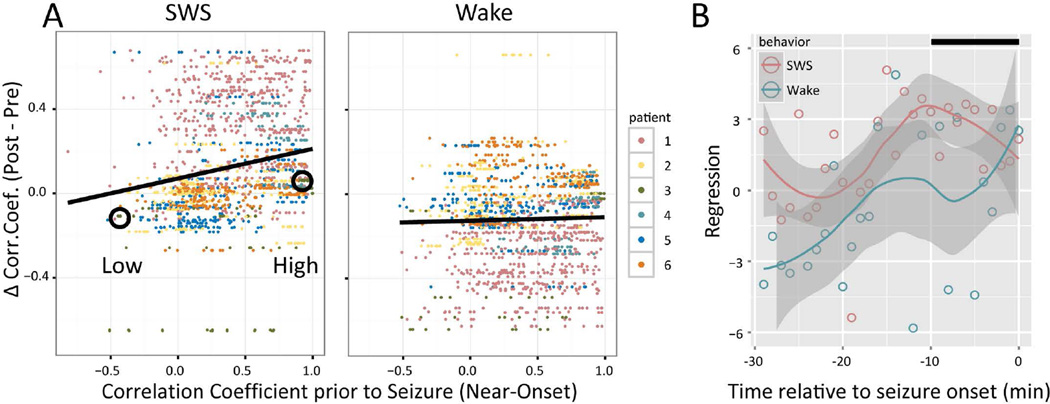
Methods: Scalp and intracranial recordings were obtained continuously across multiple days from clinical macroelectrodes implanted in patients undergoing treatment for intractable epilepsy. Data from scalp electrodes were used to stage sleep. Data from intracranial electrodes were used to detect IISs using a previously established algorithm. Partial correlations were computed for sleep and wake periods before and after seizures as a function of correlations observed in the minutes preceding seizures. Magnetic resonance imaging (MRI) and computed tomography (CT) scans were co-registered with electroencephalography (EEG) to determine the location of the seizure-onset zone (SOZ).

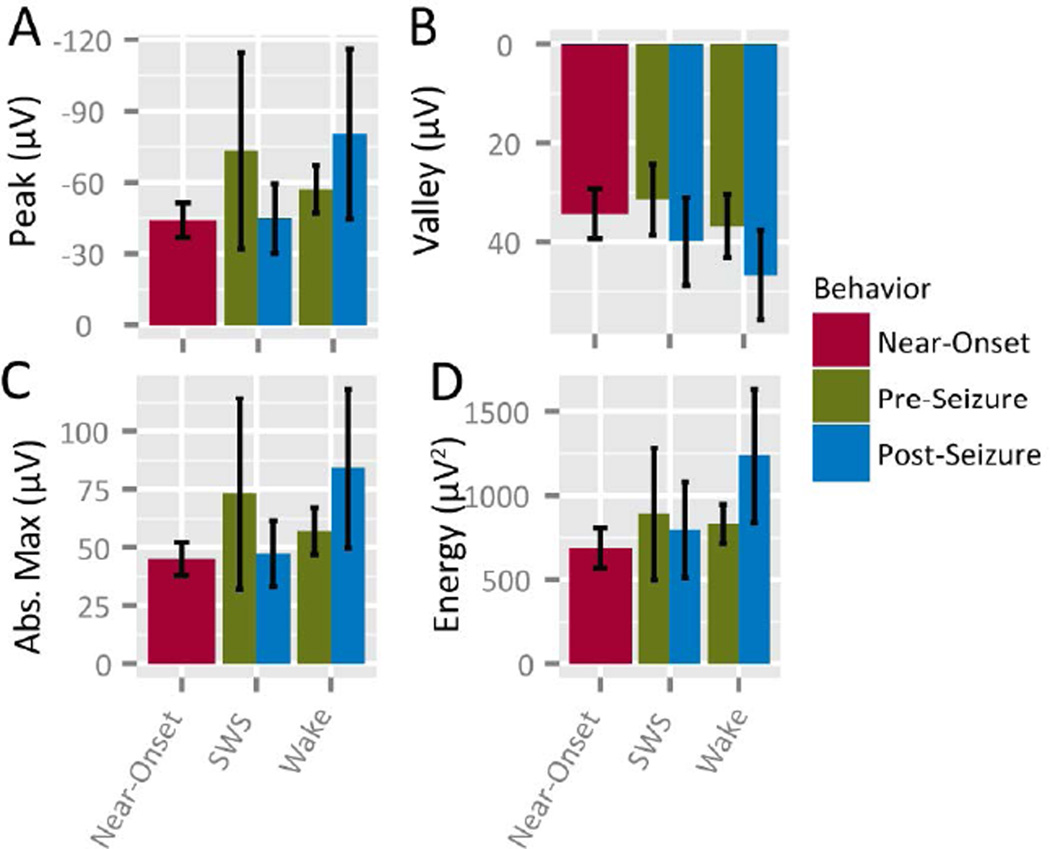
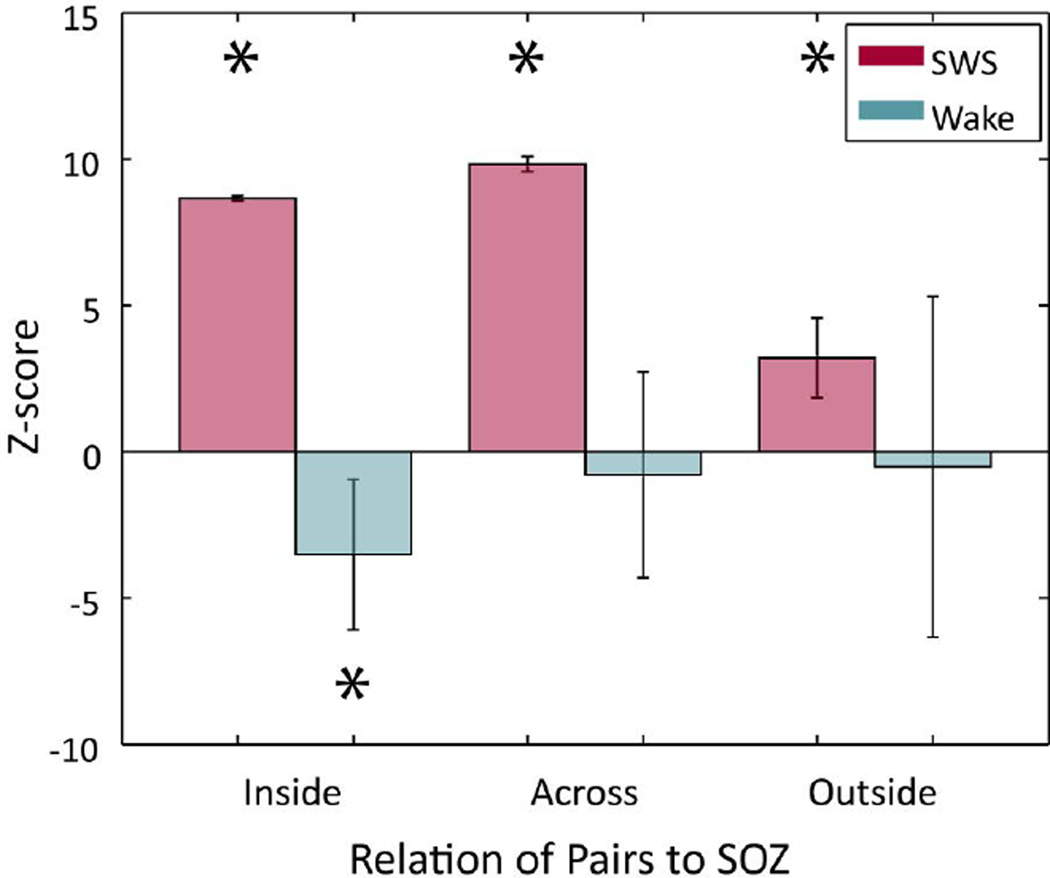
Results: Changes in IIS shape and relative synchrony were observed on a subset of macroelectrodes minutes before seizure onset, and these changes were reactivated preferentially during postseizure SWS. Changes in synchrony were greatest for pairs of electrodes where at least one electrode was located in the SOZ.

Significance: These data suggest preseizure changes in neural activity and their subsequent reactivation occur across a broad spatiotemporal scale: from single neurons to LFPs, both within and outside the SOZ. The preferential reactivation of seizure-related changes in IISs during postseizure SWS adds to a growing body of literature suggesting that pathologic neural processes may utilize physiologic mechanisms of synaptic plasticity.

Keywords: EEG; Interictal spike; Neural plasticity; Seizure.


Conflict of interest statement

Disclosures

The authors have no conflicts to disclose.

Figures

Figure 1
Figure 1
Inter-Ictal Spikes (IIS) within identified behavioral epochs during long-duration, continuous recordings around a spontaneous seizure. A. Low-pass filtered intracranial EEG (iEEG) data from −2 hours to +6 hours around a seizure. B. Behavioral epochs identified from scalp EEG ("Wake" (blue box) and "SWS", Slow-Wave Sleep (red box)) that occurred close to one another in time, along with the Near-Onset behavioral window (green box). C. Average Inter-Ictal Spikes (IIS) identified objectively by an established algorithm for each of the five epochs for an electrode located in the SOZ. Solid black line shows the mean waveform and cyan bands show one standard deviation from the mean. Text in upper-left corner of each panel shows the correlation coefficient (CC) for the average waveform during that behavioral epoch with respect to that observed on the same macroelectrode during the Near-Onset epoch.
Figure 2
Figure 2
Comparison of post-seizure changes in IIS from macroelectrodes on a single depth electrode. In each panel, IIS are shown for slow-wave sleep (SWS) on the top row and Wake on the bottom row. Each column shows data from a specific behavioral epoch (left-to-right: Control epoch before a time-shifted seizure, Control epoch after a time-shifted seizure, Pre epoch before the actual seizure, Near-Onset before the seizure, and Post epoch after the actual seizure. The average time relative to seizure onset in each case is shown in parentheses.) The black line shows the mean IIS waveform. Cyan bands show one standard deviation above and below the mean. Text in the upper left of each panel shows the CC for that behavioral epoch relative to the Near-Onset waveform. A. The most distal macroelectrode, which was located in hippocampus and within the seizure onset zone. B. Macroelectrode located in the Superior Temporal gyrus and outside the seizure onset zone. C. Macroelectrode adjacent to that shown in B, but located in Angular gyrus and outside the seizure onset zone. IIS during Near-Onset and both SWS and Wake following the seizure differ from those preceding the seizure. ('*' signifies p<.05, t-test).
Figure 3
Figure 3
IIS parameters do not change following seizures. A. Peak voltage, B. Valley voltage of IIS, C. Absolute Peak voltage (both positive- and negative-going voltage peaks), D. Energy (amplitude squared) of IIS and E. IIS Rate.
Figure 4
Figure 4
Correlation coefficient of IIS show Seizure-Related Consolidation (SRC) specific to Slow-Wave Sleep (SWS). A. Each dot shows the difference (during Post epoch minus during Pre epoch) in correlation coefficient (CC) between two macroelectrodes as a function of the CC in the 10 min preceding seizures. Differences in CCs increased during SWS as function of the magnitude of CC prior to the seizure, but not during Wake ('*' p<.05, beta regression). Dot color denotes patient, as shown in the legend at right. B. Beta regression coefficients during SWS and Wake for 1 min "seizure" time bins relative to seizure onset. The Loess confidence interval (gray band) for Wake (cyan) never differs from zero for the entire 30 min window prior to seizure onset. The confidence interval for SWS (magenta), however, is greater than both zero and the Wake confidence interval for most of the 30 min prior to seizure onset, except for the last few minutes prior to onset, when the confidence intervals overlap. The black bar at upper right denotes the 10 min time window used to compute the values shown in panel A. Circles denote macroelectrode pairs that are used as examples in Figure 5.
Figure 5
Figure 5
Examples of IIS synchrony changes following a seizure based on correlation during Near-Onset. A. "Low" Near-Onset correlation pair circled in Figure 4. A.1 Average IIS ± one standard deviation for two macroelectrodes shown in cyan and yellow. IIS on the two macroelectrodes are centered to the peak of IIS recorded on the cyan waveform. Areas of overlap between the two appear as green. top row: Slow-Wave Sleep (SWS), bottom row: Wake, left column: Pre epoch before the seizure; right column: Post epoch after the seizure, middle: Near-Onset epoch. Time and voltage scales are shown on the Near-Onset panel and are consistent across all panels. The low Near-Onset correlation persists into post-seizure SWS and Wake, where the overlap between IIS recorded from the two macroelectrodes decreases (i.e., the yellow and cyan areas are more visible). A.2 Expanded time view around the IIS peak during SWS (top) Pre epoch before the seizure, (middle) Near-Onset and (bottom) Post epoch after the seizure. Dotted lines show the peak and trough of the Near-Onset average waveform for IIS from the cyan waveform. Changes to IIS synchrony for the yellow waveform after the seizure reflect changes during the Near-Onset: (a) The peak of IIS recorded for the yellow waveforms shifts backwards relative to IIS recorded from the cyan waveforms. B. "High" Near-Onset correlation pair circled in Figure 4. B.1 Panel arrangement is the same as in A.1. The high Near-Onset correlation persists into Post-seizure SWS and Wake, where the overlap between IIS recorded from the two macroelectrodes increases (i.e., the green area signifying overlap increases). B.2 Expanded time view around IIS during SWS, as described in A.2. The (b) valley and (c) peak of IIS recorded for the yellow waveforms shifts forward in time during Near-Onset and Post epoch after the seizure with respect to the cyan IIS waveform.
Figure 6
Figure 6
Seizure-Related Consolidation of IIS is strongest when at least one electrode is within the seizure onset zone. Across-subject beta regression scores grouped by electrode location relative to seizure onset zone (SOZ) were positive for all groups during SWS (magenta), but were largest for the "Inside" and "Across" groups. Scores during Wake (cyan) only differed from zero when both macroelectrodes were "Inside" SOZ, but then the changes were anti-correlated with Near-Onset activity.

References

    1. Buzsáki G, Anastassiou CA, Koch C. The origin of extracellular fields and currents — EEG, ECoG, LFP and spikes. Nat Rev Neurosci. 2012;13:407–420. - PMC - PubMed
    1. Skaggs WE, McNaughton BL, Wilson MA, et al. Theta phase precession in hippocampal neuronal populations and the compression of temporal sequences. Hippocampus. 1996;6:149–172. - PubMed
    1. Zhou J-L, Lenck-Santini P-P, Zhao Q, et al. Effect of interictal spikes on single-cell firing patterns in the hippocampus. Epilepsia. 2007;48:720–731. - PubMed
    1. Staresina BP, Bergmann TO, Bonnefond M, et al. Hierarchical nesting of slow oscillations, spindles and ripples in the human hippocampus during sleep. Nat Neurosci. 2015;18:1679–1686. - PMC - PubMed
    1. Agarwal G, Stevenson IH, Berényi A, et al. Spatially Distributed Local Fields in the Hippocampus Encode Rat Position. Science. 2014;344:626–630. - PMC - PubMed

Publication types

MeSH terms