Temporal shifts and temperature sensitivity of avian spring migratory phenology: a phylogenetic meta-analysis
- PMID: 27859281
- PMCID: PMC6849580
- DOI: 10.1111/1365-2656.12612
Temporal shifts and temperature sensitivity of avian spring migratory phenology: a phylogenetic meta-analysis
Abstract
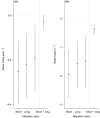
There are wide reports of advances in the timing of spring migration of birds over time and in relation to rising temperatures, though phenological responses vary substantially within and among species. An understanding of the ecological, life-history and geographic variables that predict this intra- and interspecific variation can guide our projections of how populations and species are likely to respond to future climate change. Here, we conduct phylogenetic meta-analyses addressing slope estimates of the timing of avian spring migration regressed on (i) year and (ii) temperature, representing a total of 413 species across five continents. We take into account slope estimation error and examine phylogenetic, ecological and geographic predictors of intra- and interspecific variation. We confirm earlier findings that on average birds have significantly advanced their spring migration time by 2·1 days per decade and 1·2 days °C-1 . We find that over time and in response to warmer spring conditions, short-distance migrants have advanced spring migratory phenology by more than long-distance migrants. We also find that larger bodied species show greater advance over time compared to smaller bodied species. Our results did not reveal any evidence that interspecific variation in migration response is predictable on the basis of species' habitat or diet. We detected a substantial phylogenetic signal in migration time in response to both year and temperature, suggesting that some of the shifts in migratory phenological response to climate are predictable on the basis of phylogeny. However, we estimate high levels of species and spatial variance relative to phylogenetic variance, which is consistent with plasticity in response to climate evolving fairly rapidly and being more influenced by adaptation to current local climate than by common descent. On average, avian spring migration times have advanced over time and as spring has become warmer. While we are able to identify predictors that explain some of the true among-species variation in response, substantial intra- and interspecific variation in migratory response remains to be explained.
Keywords: arrival date; bird migration timing; climate change; migratory phenology; plasticity.
© 2016 The Authors. Journal of Animal Ecology published by John Wiley & Sons Ltd on behalf of British Ecological Society.
Figures


References
-
- Alatalo, R.V. , Lundberg, A. & Glynn, C. (1986) Female pied flycatchers choose territory quality and not male characteristics. Nature, 323, 152–153.
-
- BirdLife International . (2015) IUCN Red List for birds. Available at: http://www.birdlife.org, Accessed 1 February 2016.
-
- BirdLife International & National Audubon Society . (2015) The Messengers: What Birds Tell Us About Threats from Climate Change and Solutions for Nature and People. Cambridge, UK and New York, USA: BirdLife International and National Audubon Society; Available at: http://climatechange.birdlife.org/assets/THE_MESSENGERS_FINAL_WEB.pdf, Accessed 1 November 2015.
-
- Bitterlin, L.R. & Van Buskirk, J. (2014) Ecological and life history correlates of changes in avian migration timing in response to climate change. Climate Research, 61, 109–121.
-
- Blomberg, S.P. , Garland, T. & Ives, A.R. (2003) Testing for phylogenetic signal in comparative data: behavioral traits are more labile. Evolution, 57, 717–745. - PubMed
Data Sources
-
- Adamík, P. & Pietruszková, J. (2008) Advances in spring but variable autumnal trends in timing of inland wader migration. Acta Ornithologica, 43, 119–128.
-
- Adams, I.S. (1945) Arrival and departure of greater snow geese in Quebec. Bird Banding, 16, 36–37.
-
- Ahola, M. , Laaksonen, T. , Sippola, K. , Eeva, T. , Rainio, K. & Lehikoinen, E. (2004) Variation in climate warming along the migration route uncouples arrival and breeding dates. Global Change Biology, 10, 1610–1617.
-
- Ananin, A.A. & Sokolov, L.V. (2009) Long–term arrival trends of 54 avian species to Barguzinsky Nature Reserve in northeastern Baikal area. Avian Ecology and Behaviour, 15, 33–48.
-
- Askeyev, O.V. , Sparks, T.H. , Askeyev, I.V. , Tishin, D.V. & Tryjanowski, P. (2010) East versus West: contrasts in phenological patterns? Global Ecology and Biogeography, 19, 783–793.
Publication types
MeSH terms
Associated data
LinkOut - more resources
Full Text Sources
Other Literature Sources

