

Monitoring acute metabolic changes in the liver and kidneys induced by fructose and glucose using hyperpolarized [2-13 C]dihydroxyacetone
- PMID: 27859575
- PMCID: PMC5191913
- DOI: 10.1002/mrm.26525
Monitoring acute metabolic changes in the liver and kidneys induced by fructose and glucose using hyperpolarized [2-13 C]dihydroxyacetone
Abstract
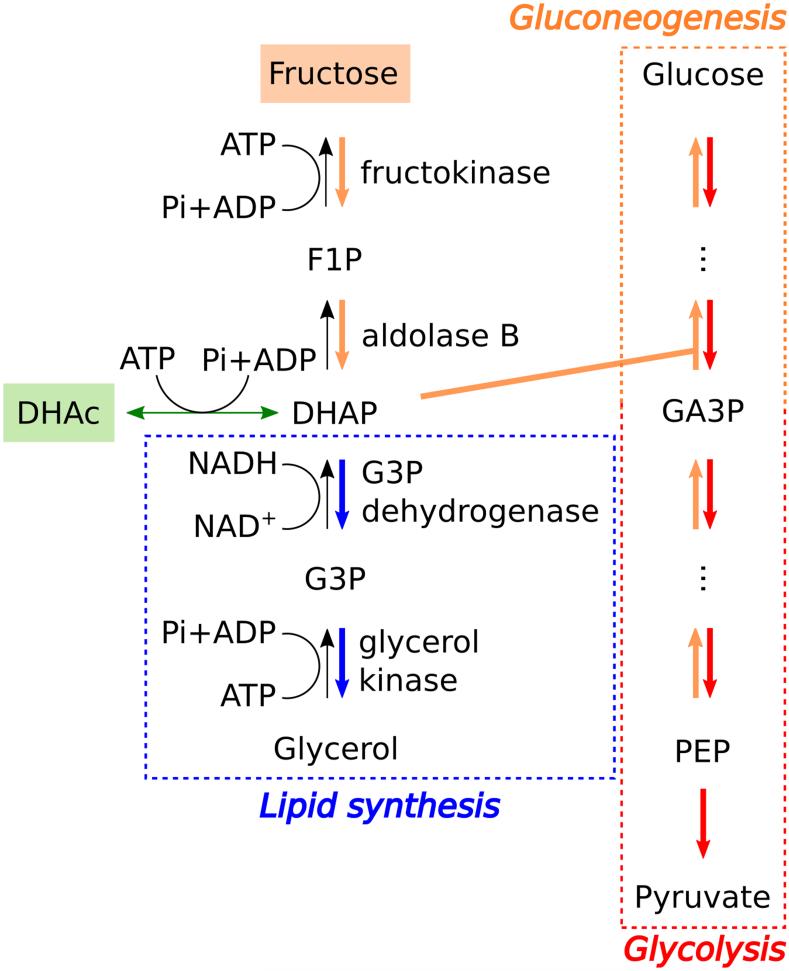
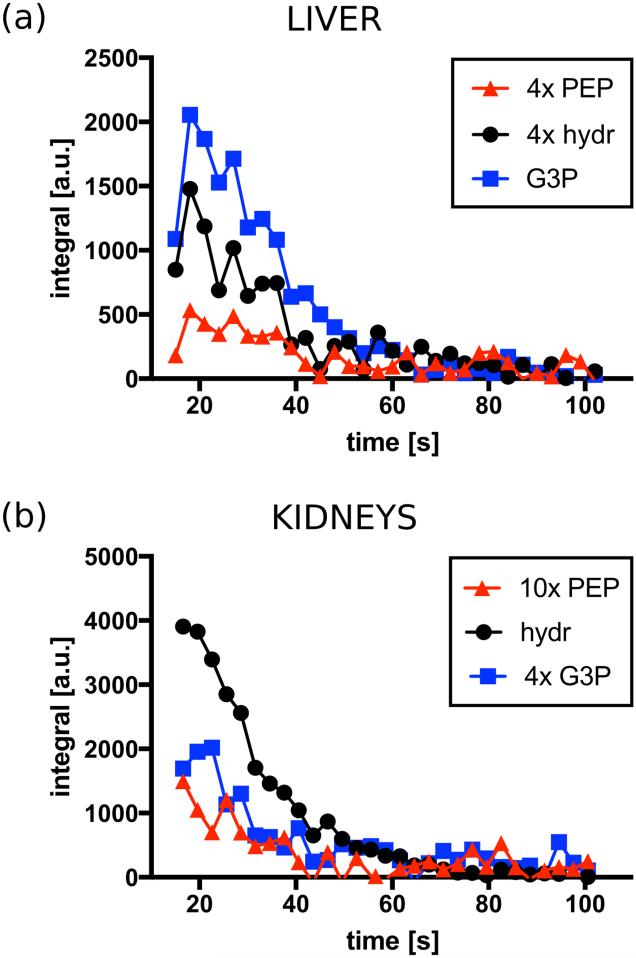
Purpose: To investigate acute changes in glucose metabolism in liver and kidneys in vivo after a bolus injection of either fructose or glucose, using hyperpolarized [2-13 C]dihydroxyacetone.
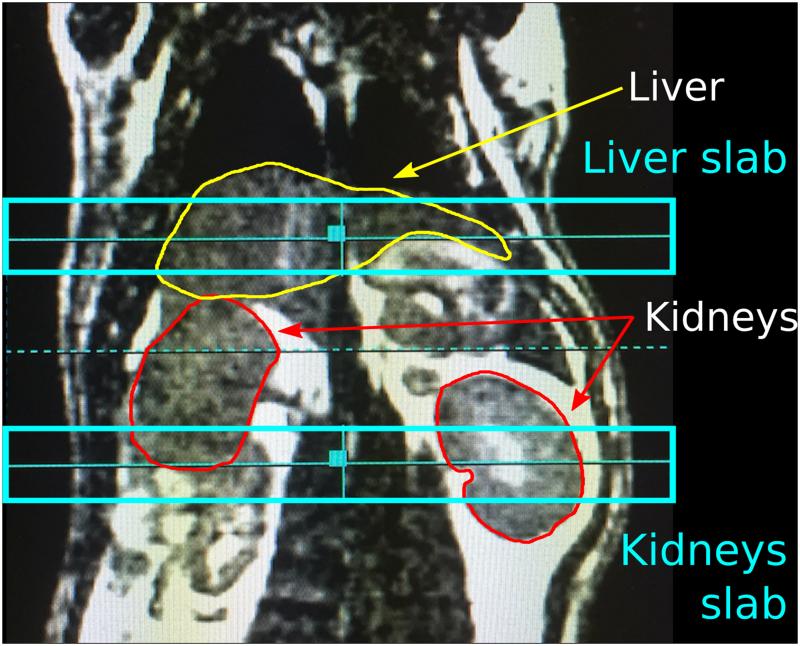
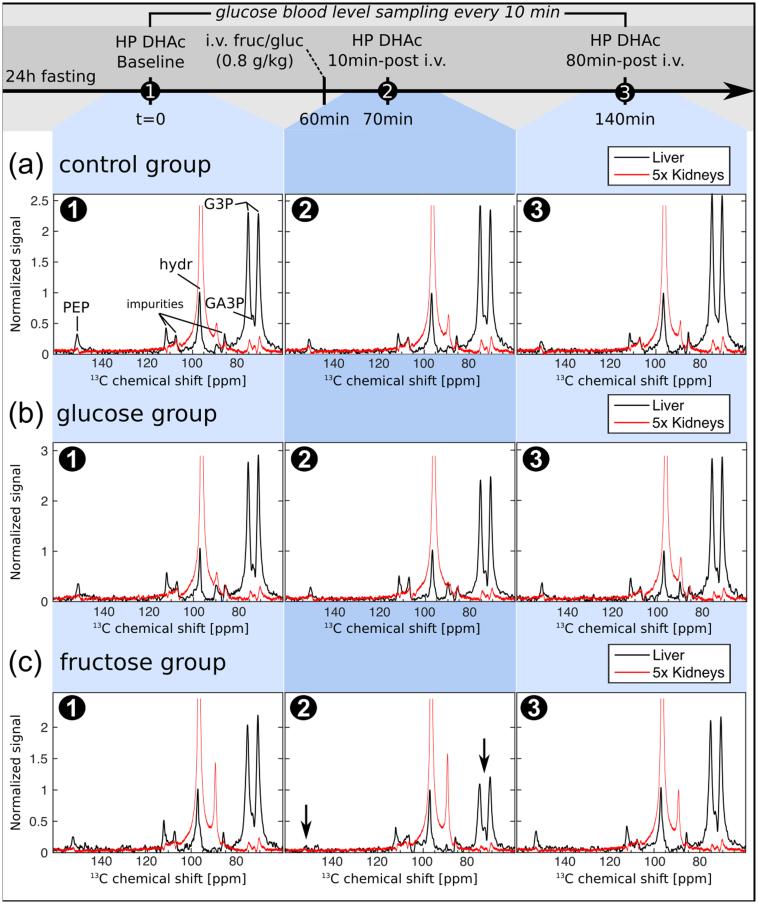
Methods: Spatially registered, dynamic, multislice MR spectroscopy was acquired for the metabolic products of [2-13 C]dihydroxyacetone in liver and kidneys. Metabolism was probed in 13 fasted rats at three time points: 0, 70, and 140 min. At 60 min, rats were injected intravenously with fructose (n = 5) or glucose (n = 4) at 0.8 g/kg to initiate acute response. Controls (n = 4) did not receive a carbohydrate challenge.
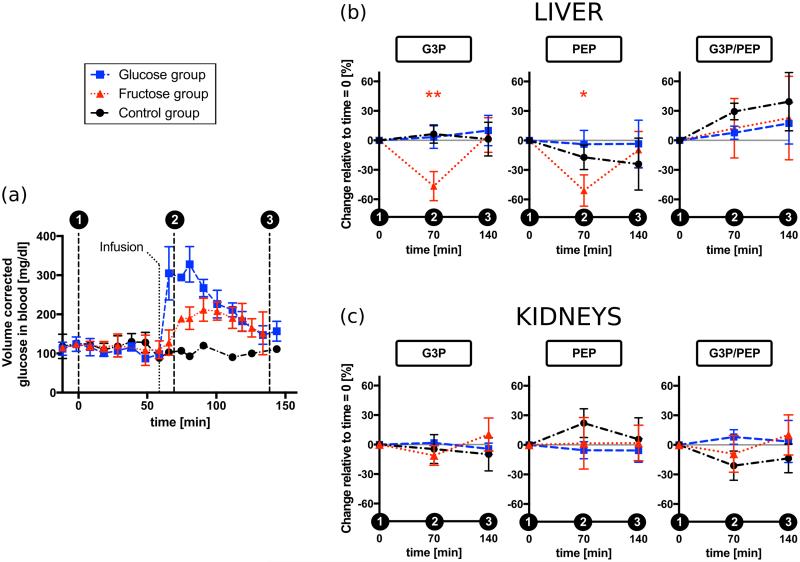
Results: Ten minutes after fructose infusion, levels of [2-13 C]phosphoenolpyruvate and [2-13 C]glycerol-3-phosphate halved in liver: 51% (P = 0.0010) and 47% (P = 0.0001) of baseline, respectively. Seventy minutes later, levels returned to baseline. The glucose challenge did not alter the signals significantly, nor did repeated administration of the dihydroxyacetone imaging bolus. In kidneys, no statistically significant changes were detected after sugar infusion other than a 20% increase of the glycerol-3-phosphate signal between 10 and 80 min after fructose injection (P = 0.0028).
Conclusion: Hyperpolarized [2-13 C]dihydroxyacetone detects a real-time, transient metabolic response of the liver to an acute fructose challenge. Observed effects possibly include ATP depletion and changes in the unlabeled pool sizes of glycolytic intermediates. Magn Reson Med 77:65-73, 2017. © 2016 International Society for Magnetic Resonance in Medicine.
Keywords: dynamic nuclear polarization; gluconeogenesis; glycerol-3-phosphate; glycolysis; hyperpolarization; metabolic imaging; phosphoenolpyruvate.
© 2016 International Society for Magnetic Resonance in Medicine.
Figures
References
-
- Gerich J, Meyer C, Woerle H, Stumvoll M. Renal gluconeogenesis. Its importance in human glucose homeostasis. Diabetes Care. 2001;24(2):382–391. - PubMed
-
- Pilkis SJ, Granner DK. Molecular physiology of the regulation of hepatic gluconeogenesis and glycolysis. Annu Rev Physiol. 1992;54(1):885–909. - PubMed
-
- Bellentani S, Scaglioni F, Marino M, Bedogni G. Epidemiology of non-alcoholic fatty liver disease. Dig Dis. 2010;28(1):155–161. - PubMed
-
- Mahady SE, George J. Management of nonalcoholic steatohepatitis. An evidence-based approach. Clin Liver Dis. 2012;16(3):631–645. - PubMed
Publication types
MeSH terms
Substances
Grants and funding
LinkOut - more resources
Full Text Sources
Other Literature Sources
