

Spectroscopic biomarkers of motor cortex developmental plasticity in hemiparetic children after perinatal stroke
- PMID: 27859933
- PMCID: PMC6866903
- DOI: 10.1002/hbm.23472
Spectroscopic biomarkers of motor cortex developmental plasticity in hemiparetic children after perinatal stroke
Abstract
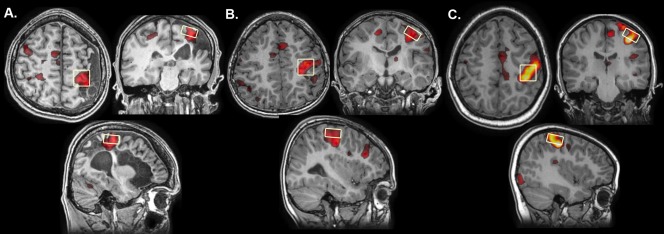
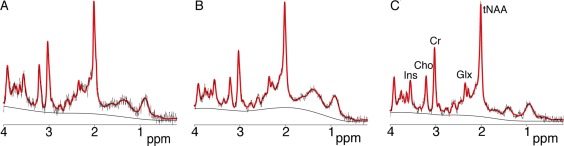
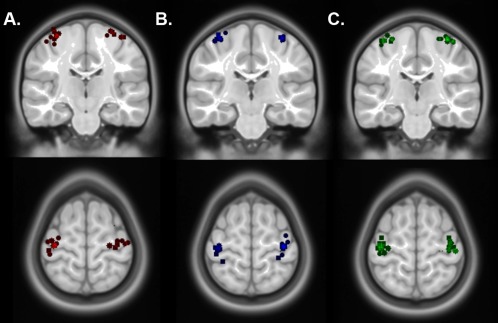
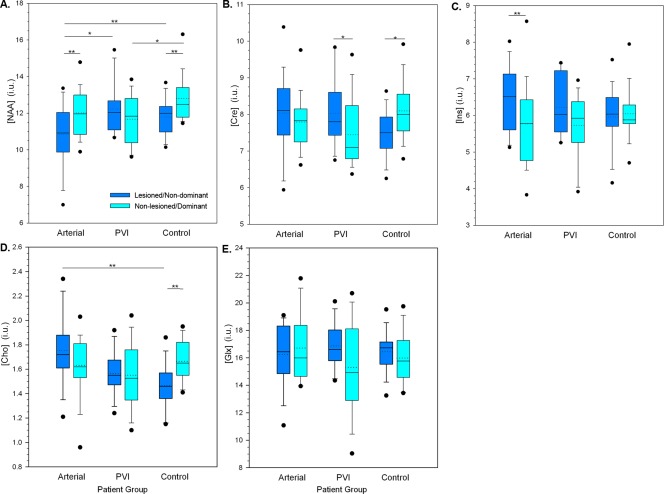
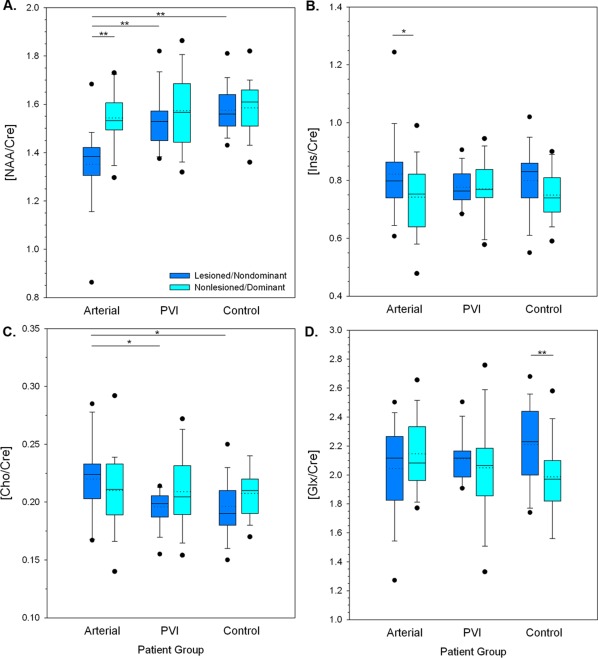
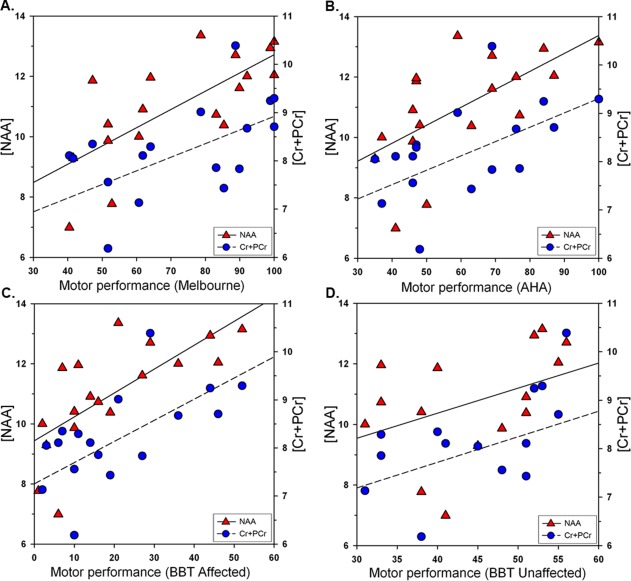
Perinatal stroke causes hemiparetic cerebral palsy and lifelong motor disability. Bilateral motor cortices are key hubs within the motor network and their neurophysiology determines clinical function. Establishing biomarkers of motor cortex function is imperative for developing and evaluating restorative interventional strategies. Proton magnetic resonance spectroscopy (MRS) quantifies metabolite concentrations indicative of underlying neuronal health and metabolism in vivo. We used functional magnetic resonance imaging (MRI)-guided MRS to investigate motor cortex metabolism in children with perinatal stroke. Children aged 6-18 years with MRI-confirmed perinatal stroke and hemiparetic cerebral palsy were recruited from a population-based cohort. Metabolite concentrations were assessed using a PRESS sequence (3T, TE = 30 ms, voxel = 4 cc). Voxel location was guided by functional MRI activations during finger tapping tasks. Spectra were analysed using LCModel. Metabolites were quantified, cerebral spinal fluid corrected and compared between groups (ANCOVA) controlling for age. Associations with clinical motor performance (Assisting Hand, Melbourne, Box-and-Blocks) were assessed. Fifty-two participants were studied (19 arterial, 14 venous, 19 control). Stroke participants demonstrated differences between lesioned and nonlesioned motor cortex N-acetyl-aspartate [NAA mean concentration = 10.8 ± 1.9 vs. 12.0 ± 1.2, P < 0.01], creatine [Cre 8.0 ± 0.9 vs. 7.4 ± 0.9, P < 0.05] and myo-Inositol [Ins 6.5 ± 0.84 vs. 5.8 ± 1.1, P < 0.01]. Lesioned motor cortex NAA and creatine were strongly correlated with motor performance in children with arterial but not venous strokes. Interrogation of motor cortex by fMRI-guided MRS is feasible in children with perinatal stroke. Metabolite differences between hemispheres, stroke types and correlations with motor performance support functional relevance. MRS may be valuable in understanding the neurophysiology of developmental neuroplasticity in cerebral palsy. Hum Brain Mapp 38:1574-1587, 2017. © 2016 Wiley Periodicals, Inc.
Keywords: cerebral palsy; hemiparesis; magnetic resonance imaging; magnetic resonance spectroscopy; neuroimaging; pediatric; spectroscopy.
© 2016 Wiley Periodicals, Inc.
Conflict of interest statement
None of the authors has any conflicts of interest to declare.
Figures
References
-
- Albers GW, Thijs VN, Wechsler L, Kemp S, Schlaug G, Skalabrin E, Bammer R, Kakuda W, Lansberg MG, Shuaib A, Coplin W, Hamilton S, Moseley M, Marks MP (2006): Magnetic resonance imaging profiles predict clinical response to early reperfusion: The diffusion and perfusion imaging evaluation for understanding stroke evolution (DEFUSE) study. Ann Neurol 60:508–517. - PubMed
-
- Arner M, Beckung E, Eliasson A, Krumlinde‐sundholm L, Rosenbaum P, Rosblad B (2005): Manual ability classification system for children with cerebral palsy. Available at: http://www.macs.nu/ - PubMed
-
- Biswal B, Yetkin FZ, Haughton VM, Hyde JS (1995): Functional connectivity in the motor cortex of resting human brain using echo‐planar MRI. Magn Reson Med 34:537–541. - PubMed
-
- Bourke‐Taylor H (2003): Melbourne assessment of unilateral upper limb function: Construct validity and correlation with the pediatric evaluation of disability inventory. Dev Med Child Neurol 45:92–96. - PubMed
-
- Brand A, Richter‐Landsberg C, Leibfritz D (1993): Multinuclear NMR studies on the energy metabolism of glial and neuronal cells. Dev Neurosci 15:289–298. - PubMed
Publication types
MeSH terms
Substances
LinkOut - more resources
Full Text Sources
Other Literature Sources
Medical
