. 2017 Jan 17;18(2):223-231.
doi: 10.1002/cbic.201600552. Epub 2016 Dec 19.

Protein Surface Mimetics: Understanding How Ruthenium Tris(Bipyridines) Interact with Proteins

Affiliations

Protein Surface Mimetics: Understanding How Ruthenium Tris(Bipyridines) Interact with Proteins

Sarah H Hewitt et al. Chembiochem. .

Abstract

Protein surface mimetics achieve high-affinity binding by exploiting a scaffold to project binding groups over a large area of solvent-exposed protein surface to make multiple cooperative noncovalent interactions. Such recognition is a prerequisite for competitive/orthosteric inhibition of protein-protein interactions (PPIs). This paper describes biophysical and structural studies on ruthenium(II) tris(bipyridine) surface mimetics that recognize cytochrome (cyt) c and inhibit the cyt c/cyt c peroxidase (CCP) PPI. Binding is electrostatically driven, with enhanced affinity achieved through enthalpic contributions thought to arise from the ability of the surface mimetics to make a greater number of noncovalent interactions than CCP with surface-exposed basic residues on cyt c. High-field natural abundance 1 H,15 N HSQC NMR experiments are consistent with surface mimetics binding to cyt c in similar manner to CCP. This provides a framework for understanding recognition of proteins by supramolecular receptors and informing the design of ligands superior to the protein partners upon which they are inspired.

Keywords: molecular recognition; protein surface recognition; protein-protein interactions; receptors; supramolecular chemistry.


Figures

Figure 1
Figure 1
The RuII(bpy)3 surface mimetics and their PPI counterparts cyt c and CCP. A) RuII(bpy)3 complexes 1 and 2, B) the cyt c/CCP interaction, with cyt c in pink and CCP in blue (PDB ID: 1U75),34 and C) the interaction faces of cyt c (left) and CCP (right), showing a ring (red circle) of basic amino acid residues (blue) on cyt c and a complementary patch (blue circle) with acidic amino acid residues (red) on CCP.
Scheme 1
Scheme 1
Synthesis of the RuII(bpy)3 complexes. a) K2Cr2O7, H2SO4; b) HNO3 (84 %); c) SOCl2; d) CHCl3, DIPEA, (P)R‐NH2 (20–85 %); e) Ru(DMSO)4Cl2, AgNO3, EtOH (25–72 %); f) deprotection.
Figure 2
Figure 2
Complex 2 inhibits the cyt c/CCP PPI. Luminescence data (λ ex= 430 nm), 2 μm ZnCCP (orange), +2 μm cyt c (pink)) show loss of λ max at 595 nm. The addition of 4 μm complex 2 (green) shows recovery of λ max at 595 nm and reduced λ max at 625 nm relative to 4 μm complex 2 alone (blue).
Figure 3
Figure 3
Van't Hoff and Debye–Hückel analysis on the binding interactions between cyt c and complexes 1 and 2. A) Representative van't Hoff analysis (5 mm sodium phosphate, 0.2 mg mL−1 BSA, pH 7.5), temperature range 25 to 45 °C (errors in curve fitting for a single replicate are shown). B) Debye–Hückel analysis, with use of the Güntelberg approximation (5 mm sodium phosphate, 0.2 mg mL−1 BSA, pH 7.5) and variable concentrations NaCl; variation in K d from two replicates is shown).
Figure 4
Figure 4
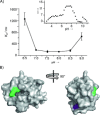
Effect of pH on the binding of complex 2 to cyt c. A) Binding affinity over the range pH 6.5–9.0. Inset: the electrostatic interaction factor (ω) of cyt c over a range of pH values (base limb of titration curve).53 B) Cyt c structure (PDB ID: 1U75)54 with residues that become protonated at pH 6.5 (His33: purple) and 9.0 (Lys79: green).
Figure 5
Figure 5
1H,15N HSQC NMR data for complex 1 binding to cyt c. A) Region of the overlaid HSQC spectra of cyt c (red) and cyt c with 0.5 equiv complex 1 (blue). Inset shows zoom in of part of the spectrum, showing some peaks staying the same, some having shifted and one disappearing. B) 1H,15N chemical shift differences (Δδ) for the different amino acid residues with and without complex 1. Gaps are for proline residues and unassigned amino acids; red bars show amino acids for which the signal disappears due to significant line‐broadening of NH crosspeaks on addition of complex 1. C) Chemical shift perturbation map of cyt c, molecular surface of cyt c generated from PyMol (PDB ID: 1U75),54 with colouring corresponding to the extent of chemical shift changes (Δδ) on addition of the complex. Amino acids with 15N,1H resonances that disappear are shown in dark red, those that exhibit large chemical shift changes (Δδ>0.03) are in red, moderate changes (Δδ>0.02) are in orange, small changes (Δδ>0.015) are in yellow‐orange and very small chemical shift changes (Δδ>0.01) are in yellow. D) Perturbation map of cyt c (as in (C)) in complex with CCP (purple); this view corresponds to that of the central top image in (C) (PDB ID: 1U75).34.

Similar articles

Cited by

References

    1. Arkin M. R., Wells J. A., Nat. Rev. Drug Discovery 2004, 3, 301–317. - PubMed
    1. Wilson A. J., Chem. Soc. Rev. 2009, 38, 3289–3300. - PubMed
    1. Edfeldt F. N. B., Folmer R. H. A., Breeze A. L., Drug Discovery Today 2011, 16, 284–287. - PubMed
    1. Waring M. J., Arrowsmith J., Leach A. R., Leeson P. D., Mandrell S., Owen R. M., Pairaudeau G., Pennie W. D., Pickett S. D., Wang J., Wallace O., Weir A., Nat. Rev. Drug Discovery 2015, 14, 475–486. - PubMed
    1. Azzarito V., Long K., Murphy N. S., Wilson A. J., Nat. Chem. 2013, 5, 161–173. - PubMed

MeSH terms