. 2017 Jan 2;16(1):59-72.
doi: 10.1080/15384101.2016.1252881. Epub 2016 Nov 18.

Roles of PPAR transcription factors in the energetic metabolic switch occurring during adult neurogenesis

Affiliations

Roles of PPAR transcription factors in the energetic metabolic switch occurring during adult neurogenesis

E Di Giacomo et al. Cell Cycle. .

Abstract

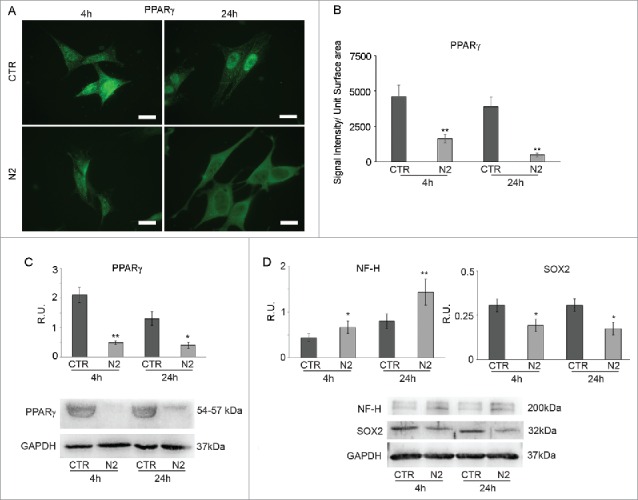
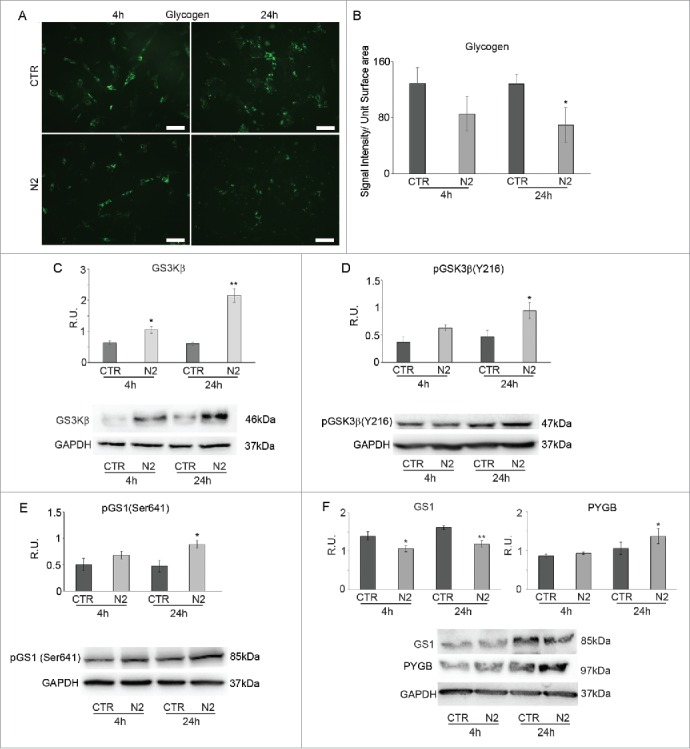
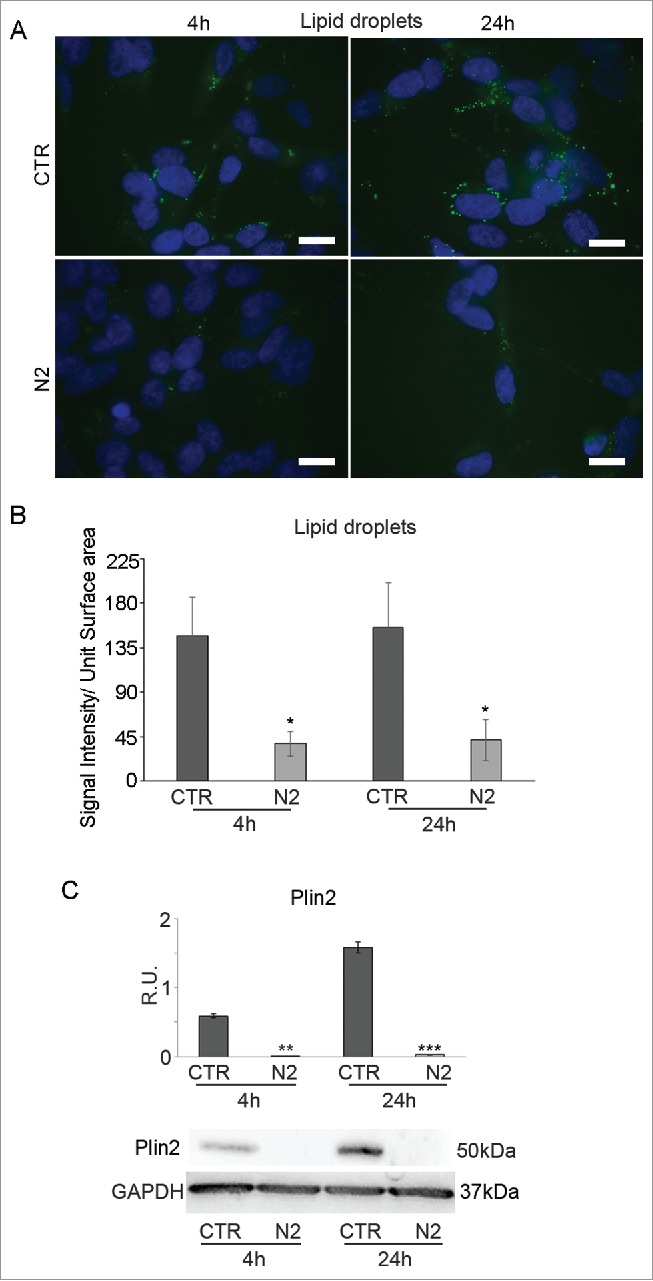
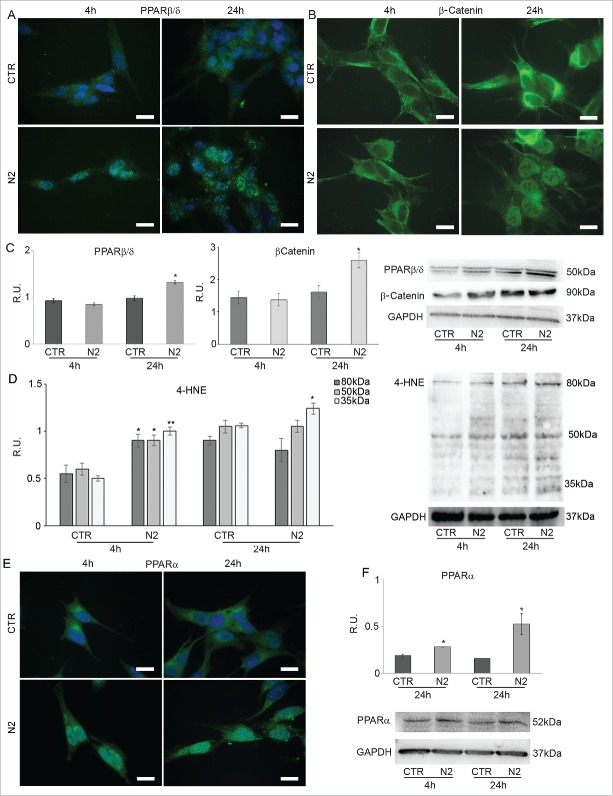
PPARs are a class of ligand-activated transcription factors belonging to the superfamily of receptors for steroid and thyroid hormones, retinoids and vitamin D that control the expression of a large number of genes involved in lipid and carbohydrate metabolism and in the regulation of cell proliferation, differentiation and death. The role of PPARs in the CNS has been primarily associated with lipid and glucose metabolism; however, these receptors are also implicated in neural cell differentiation and death, as well as neuronal maturation. Although it has been demonstrated that PPARs play important roles in determining NSCs fate, less is known about their function in regulating NSCs metabolism during differentiation. In order to identify the metabolic events, controlled by PPARs, occurring during neuronal precursor differentiation, the glucose and lipid metabolism was followed in a recognized model of neuronal differentiation in vitro, the SH-SY5Y neuroblastoma cell line. Moreover, PPARs distribution were also followed in situ in adult mouse brains. The concept of adult neurogenesis becomes relevant especially in view of those disorders in which a loss of neurons is described, such as Alzheimer disease, Parkinson disease, brain injuries and other neurological disorders. Elucidating the crucial steps in energetic metabolism and the involvement of PPARγ in NSC neuronal fate (lineage) may be useful for the future design of preventive and/or therapeutic interventions.

Keywords: adult neurogenesis; glucose metabolism; lipid metabolism; transcription factors.


Figures

Figure 1.
Figure 1.
PPARγ IF in SH-SY5Y during differentiation (A). Undifferentiated (CTR) and differentianted (N2) cells at 4h and 24h from N2 treatment Bar = 10 μm. B: PPARγ IF quantification expressed as Signal Intensity/Unit Surface Area. C: WB and relative densitometric analyses for PPARγ in undifferentiated (CTR) and differentiated (N2) cells at the indicated time-points. D: WB and relative densitometric analyses for NF-H and SOX2 in undifferentiated (CTR) and differentiating (N2) cells at the indicated time-points. The relative densities of the immunoreactive bands were determined and normalized with respect to GAPDH, using a semiquantitative densitometric analysis. Data are mean ± SE of 4 different experiments. *P ≤ 0.05 and **P ≤ 0.005.
Figure 2.
Figure 2.
Glycogen immunolocalization in SH-SY5Y during differentiation (A). Undifferentiated (CTR) and differentianted (N2) cells at 4h and 24h from N2 treatment. Bar = 70 μm. B: Glycogen IF quantification expressed as Signal Intensity/Unit Surface Area (B). C: WB and relative densitometric analyses for GSK3β in undifferentiated (CTR) and differentiating (N2) cells at the indicated time-points. D: WB and relative densitometric analyses for pGSK3β(Y216) in undifferentiated (CTR) and differentiating (N2) cells at the indicated time-points. E: WB and relative densitometric analyses for pGS(Ser641) in undifferentiated (CTR) and differentiating (N2) cells at the indicated time-points. F: WB and relative densitometric analyses for GS1 and PYGB in undifferentiated (CTR) and differentiating (N2) cells at the indicated time-points. The relative densities of the immunoreactive bands were determined and normalized with respect to GAPDH, using a semiquantitative densitometric analysis. Data are mean ± SE of 4 different experiments. *P ≤ 0.05 and **P ≤ 0.005.
Figure 3.
Figure 3.
BODIPY staining in SH-SY5Y during differentiation (A). Undifferentiated (CTR) and differentianted (N2) cells at 4h and 24h from N2 treatment. Nuclei were counterstained with DAPI. Bar = 10 μm. B: BODIPY staining quantification expressed as Signal Intensity/Unit Surface Area. C: WB and relative densitometric analysis for Plin2 in undifferentiated (CTR) and differentiating (N2) cells at the indicated time-points. The relative densities of the immunoreactive bands were determined and normalized with respect to GAPDH, using a semiquantitative densitometric analysis. Data are mean ± SE of 4 different experiments. **P ≤ 0.005 and ***P ≤ 0.0005.
Figure 4.
Figure 4.
PPARβ/δ (A) and β-catenin (B) immunolocalization in SH-SY5Y during differentiation. Undifferentiated (CTR) and differentianted (N2) cells at 4h from N2 treatment. Bar = 10 μm. C: WB and relative densitometric analyses for PPARβ/δ and β-catenin in undifferentiated (CTR) and differentiating (N2) cells at the indicated time-points. D: WB and relative densitometric analyses for 4-HNE in undifferentiated (CTR) and differentiating (N2) cells at the indicated time-points. The relative densities of the immunoreactive bands were determined and normalized with respect to GAPDH using a semiquantitative densitometric analysis. Data are mean ± SE of 4 different experiments. *P ≤ 0.05; **P ≤ 0.005. E: PPARα IF in SH-SY5Y during differentiation. Undifferentiated (CTR) and differentianted (N2) cells at 4h and 24h from N2 treatment Bar = 10 μm. F: WB and relative densitometric analysis for PPARα in undifferentiated (CTR) and differentiating (N2) cells at the indicated time-points. The relative densities of the immunoreactive bands were determined and normalized with respect to GAPDH, using a semiquantitative densitometric analysis. Data are mean ± SE of 4 different experiments. *P ≤ 0.05.
Figure 5.
Figure 5.
A: PPARγ and glycogen IF in cells treated with scrambled sequence (Scr) and in PPARγ silenced cells (siRNA). Bar = 35 μm. B: WB and densitometric analysis for PPARγ and PYGP. The relative densities of the immunoreactive bands were determined and normalized with respect to GAPDH using a semiquantitative densitometric analysis. Data are mean ± SE of 4 different experiments. *P ≤ 0.05; **P ≤ 0.005. C: Phase contrast microscopy of cells treated with scrambled sequence (Src) and PPARγ silenced cells (siRNA); Bar = 20 μm. D: WB and densitometric analysis for NF-H, PPARβ/δ and PPARα. The relative densities of the immunoreactive bands were determined and normalized with respect to GAPDH using a semiquantitative densitometric analysis. Data are mean ± SE of 4 different experiments. **P ≤ 0.005.
Figure 6.
Figure 6.
PPARγ immunolocalization along the A-P axis of mouse brain LVs. A-D, dorsal (A, C) and ventral (B, D) neurogenic regions of rostral LV stained for PPARγ (A, B) and DAPI (C, D). E-H, intermediate region of LV, dorso-lateral neurogenic wall stained for PPARγ (E) and DAPI (F); medio-lateral and ventral walls stained for PPARγ (G-H). I-N, caudal LV; dorso-lateral neurogenic wall stained for PPARγ (I) and DAPI (L); medio-lateral and ventral walls stained for PPARγ (M-N). lat, lateral wall; med, medial wall. Bar = 40 μm.
Figure 7.
Figure 7.
GFAP, Nestin and PPARγ in different rostro-caudal regions of the LVs. A-D, rostral LV. Dorsal neurogenic region immunostained for GFAP (A), PPARγ (B), merge (C), and DAPI (D). E-H, rostral LV. Dorsal neurogenic region immunostained for Nestin (E), PPARγ (F). Merge (G), and DAPI (H). I-N, caudal LV. Dorso-lateral neurogenic region immunostained for GFAP (I), PPARγ (L), Merge (M) and DAPI (N). O-R, caudal LV. Dorso-lateral neurogenic region immunostained for Nestin (O) and PPARγ (P). Merge (Q) and DAPI (R). lat, lateral wall; med, medial wall. Bar = 40 μm.
Figure 8.
Figure 8.
SOX2 and PPARγ in rostro-caudal regions of the LVs. A-D, rostral LV, dorsal neurogenic region immunostained for SOX2/DAPI (A-B) and PPARγ/DAPI(C-D). E-H, caudal LV. Dorso-lateral neurogenic region immunostained for SOX2/DAPI (E-F) and PPARγ/DAPI(G-M)Bar = 40 μm.
Figure 9.
Figure 9.
Panel 1: Glycogen distribution in mouse LV. A: LV at low magnification immunostained for glycogen; B-D, dorsal wall (B), migratory region (C), lateral and medial wall (D) of LV at high magnification; E, lateral wall of LV counterstained with DAPI. cc, corpus callosum; lat, lateral wall; med, medial wall. Bar in (A) = 180 μm; Bar in B-E = 60 μm. Panel 2: Glycogen and PPARγ IF in the migratory region of LV (A) and in medial and lateral wall of LV (B); Glycogen and GFAP IF in migratory region of LV (C) and in medial and lateral wall of LV (D); E-F: glycogen and β-tubulin III IF in the migratory region of LV (E) and in medial and lateral wall of LV (F). Bar = 60 μm.

References

    1. Ming GL, Song H. Adult neurogenesis in the mammalian central nervous system. Annu.Rev.Neurosci 2005; 28:223-50; PMID:16022595; http://dx.doi.org/10.1146/annurev.neuro.28.051804.101459 - DOI - PubMed
    1. Ming G, Song H. Adult Neurogenesis in the Mammalian Brain: significant answers and significant questions. Neuron 2011; 70:687-702; PMID:21609825; http://dx.doi.org/10.1016/j.neuron.2011.05.001 - DOI - PMC - PubMed
    1. Seri B, Herrera DG, Gritti A, Ferron S, Collado L, Vescovi A, Garcia-Verdugo JM, Alvarez-Buylla A. Composition and organization of the SCZ: a large germinal layer containing neural stem cells in the adult mammalian brain. Cerebral Cortex 2006; 16:i103-11; PMID:16766696; http://dx.doi.org/10.1093/cercor/bhk027 - DOI - PubMed
    1. Balu DT, Lucki I. Adult hippocampal neurogenesis: regulation, functional implications, and contribution to disease pathology. Neurosci Biobehav Rev 2009; 33:232-52; PMID:18786562; http://dx.doi.org/10.1016/j.neubiorev.2008.08.007 - DOI - PMC - PubMed
    1. Butti E, Cusimano M, Bacigaluppi M, Martino G. Neurogenic and non-neurogenic functions of endogenous neural stem cells. Front Neurosci 2014; 8:92. - PMC - PubMed

LinkOut - more resources