

TECRL, a new life-threatening inherited arrhythmia gene associated with overlapping clinical features of both LQTS and CPVT
- PMID: 27861123
- PMCID: PMC5167130
- DOI: 10.15252/emmm.201505719
TECRL, a new life-threatening inherited arrhythmia gene associated with overlapping clinical features of both LQTS and CPVT
Abstract
Genetic causes of many familial arrhythmia syndromes remain elusive. In this study, whole-exome sequencing (WES) was carried out on patients from three different families that presented with life-threatening arrhythmias and high risk of sudden cardiac death (SCD). Two French Canadian probands carried identical homozygous rare variant in TECRL gene (p.Arg196Gln), which encodes the trans-2,3-enoyl-CoA reductase-like protein. Both patients had cardiac arrest, stress-induced atrial and ventricular tachycardia, and QT prolongation on adrenergic stimulation. A third patient from a consanguineous Sudanese family diagnosed with catecholaminergic polymorphic ventricular tachycardia (CPVT) had a homozygous splice site mutation (c.331+1G>A) in TECRL Analysis of intracellular calcium ([Ca2+]i) dynamics in human induced pluripotent stem cell-derived cardiomyocytes (hiPSC-CMs) generated from this individual (TECRLHom-hiPSCs), his heterozygous but clinically asymptomatic father (TECRLHet-hiPSCs), and a healthy individual (CTRL-hiPSCs) from the same Sudanese family, revealed smaller [Ca2+]i transient amplitudes as well as elevated diastolic [Ca2+]i in TECRLHom-hiPSC-CMs compared with CTRL-hiPSC-CMs. The [Ca2+]i transient also rose markedly slower and contained lower sarcoplasmic reticulum (SR) calcium stores, evidenced by the decreased magnitude of caffeine-induced [Ca2+]i transients. In addition, the decay phase of the [Ca2+]i transient was slower in TECRLHom-hiPSC-CMs due to decreased SERCA and NCX activities. Furthermore, TECRLHom-hiPSC-CMs showed prolonged action potentials (APs) compared with CTRL-hiPSC-CMs. TECRL knockdown in control human embryonic stem cell-derived CMs (hESC-CMs) also resulted in significantly longer APs. Moreover, stimulation by noradrenaline (NA) significantly increased the propensity for triggered activity based on delayed afterdepolarizations (DADs) in TECRLHom-hiPSC-CMs and treatment with flecainide, a class Ic antiarrhythmic drug, significantly reduced the triggered activity in these cells. In summary, we report that mutations in TECRL are associated with inherited arrhythmias characterized by clinical features of both LQTS and CPVT Patient-specific hiPSC-CMs recapitulated salient features of the clinical phenotype and provide a platform for drug screening evidenced by initial identification of flecainide as a potential therapeutic. These findings have implications for diagnosis and treatment of inherited cardiac arrhythmias.
Keywords: Arrhythmia; CPVT; LQTS; SRD5A2L2; iPSC.
© 2016 The Authors. Published under the terms of the CC BY 4.0 license.
Figures

12‐lead ECG of patient 1.
12‐lead ECG of patient 2.
ECG of patient 2 during epinephrine test [A, baseline ECG; B, ECG at 17 min and 47 s, at the beginning of epinephrine infusion (0.2 μg/kg of epinephrine); C, ECG after the end of epinephrine infusion].
Pedigree of a family diagnosed with arrhythmias; arrow indicates the proband, and solid symbols represent family members affected by arrhythmias who are also homozygous for mutations identified by exome sequencing. Crossed symbols indicate deceased individuals. Half‐filled symbols correspond to individuals heterozygous for mutations identified by exome sequencing.
ECG of patient 3 (subject IV:13) showing mild QTc prolongation.
ICD interrogation of patient 3 (subject IV:13) reveals an episode of VT.

- A–H
Expression of Tecrl in mouse development. Expression is not observed in (A) the cardiac crescent at E7.5 but is prominent in (B) the inflow tract (ift) region at E8.5, particularly in (C) the left sinus venosus (lsv). (D) At E9.5, Tecrl expression is observed in all four chambers of the heart but is strongest in the inflow tract. (E–G) From E10 onwards, Tecrl is expressed in the somites. (H) At E14.5, Tecrl expression is present in the entire myocardium. Atrium (a), ventricle (v), myotome (m), neural tube (nt), lung (lu), right atrium (ra), left atrium (la), right ventricle (rv), and left ventricle (lv).
- I
mRNA expression analyses of TECR and TECRL by RT–qPCR in human tissues demonstrate preferential expression of Tecrl in the heart. Bone marrow (Bone M.), heart, skeletal muscle (Sk.Muscle), uterus, liver, spleen, thymus, thyroid, prostate, brain, lung, small intestine (Small I.), and colon.
- J
Localization of MYC‐Tecrl in COS‐1 cells. The accumulation of MYC‐Tecrl is perinuclear, consistent with it being localized to the ER. Scale bar: 10 μm.
- K–M
Co‐localization of MYC‐Tecrl and the ER marker calnexin in H10 cells. Nuclei stained with DAPI. Scale bar: 10 μm.

Skin fibroblasts (left) from IV:13, homozygous for the TECRLc.331+1G>A mutation, were reprogrammed to hiPSCs (center), which expressed the pluripotency markers NANOG and SSEA4 (right). Scale bars: 100 μm.
TECRLHom‐hiPSCs have a normal karyotype (left) and PluriTest demonstrates a high pluripotency score and low novelty score for all three hiPSC lines (right).
TECRLHom‐hiPSCs generate derivatives of mesoderm (left), endoderm (center), and ectoderm (right). Scale bars: 25 μm.
DNA sequencing confirms TECRLc.331+1G>A in the affected family members. Control (left); heterozygous (center); homozygous (right).
Schematic of the protocol used for cardiac differentiation of hiPSCs.
ACTN2 immunostaining of CTRL‐, TECRLHet‐, and TECRLHom‐hiPSC‐CMs. Scale bar: 25 μm.
Analysis of RT–PCR products by gel electrophoresis. Amplification products of TECRL exons 2–4 from CTRL‐, TECRLHet‐, and TECRLHom‐hiPSC‐CMs (left) and coding sequence of TECRL from CTRL‐ and TECRLHom‐hiPSC‐CMs (right).

Representative traces of [Ca2+]i transients in Indo‐1 AM‐loaded hiPSC‐CMs paced at 1 Hz.
Time to reach 50% of [Ca2+]i transient amplitude (t1/2) and [Ca2+]i concentrations during systole and diastole.
Amplitude and tau decay of the [Ca2+]i transient.

Representative traces of [Ca2+]i transients in Indo‐1 AM‐loaded hiPSC‐CMs paced at 1 Hz, in the presence of caffeine (caff) or caffeine and NiCl2.
Amplitude of [Ca2+]i in the presence of caffeine and NiCl2 and fractional SR release in hiPSC‐CMs.
Rate constants of SERCA‐, NCX‐, and slow mechanism‐based [Ca2+]i decay in hiPSC‐CMs.
Relative contribution of SERCA, NCX, and slow mechanisms to [Ca2+]i extrusion in hiPSC‐CMs.
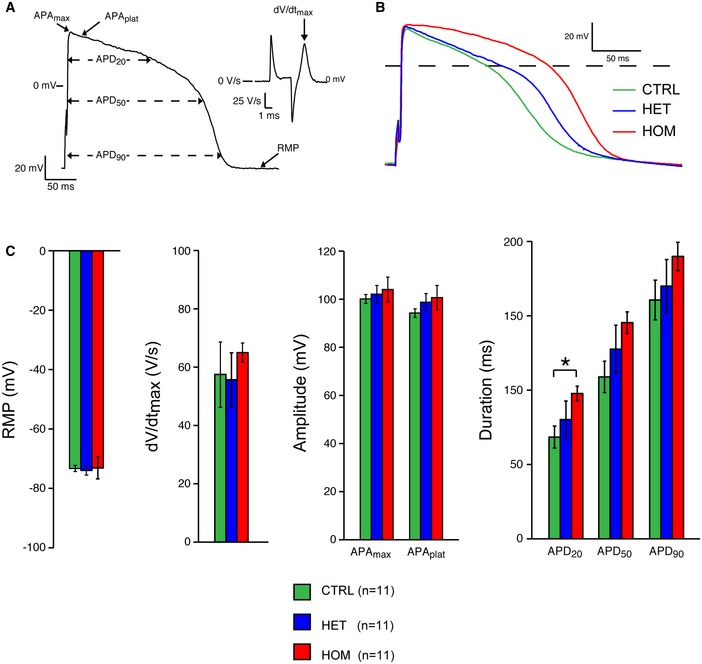
AP illustrating the analyzed parameters.
Representative APs from control (CTRL), heterozygous (HET), and homozygous (HOM) CMs.
RMP, dV/dt max, APAmax, APAplat, APD20, APD50, and APD90 of CTRL‐, TECRLHet‐, and TECRLHom‐hiPSC‐CMs.

- A, B
Representative AP traces (A) and averaged activity (B) of triggered and spontaneous activity in hiPSC‐CMs in the absence of NA.
- C, D
Representative AP traces (C) and averaged activity (D) of triggered and spontaneous activity in hiPSC‐CMs in the presence of NA.

- A
Representative AP trace of a TECRLHom‐hiPSC‐CM in the presence of NA alone or NA and flecainide.
- B
Effect of flecainide on AP parameters of hiPSC‐CMs.
- C, D
Addition of 5 μM of flecainide decreased the susceptibility to triggered activity in hiPSC‐CMs. Note that the effect of flecainide on triggered activity of TECRLHet‐ and TECRLHom‐hiPSC‐CMs is more pronounced than its effect on their spontaneous activity.
Comment in
-
TECRL: connecting sequence to consequence for a new sudden cardiac death gene.EMBO Mol Med. 2016 Dec 1;8(12):1364-1365. doi: 10.15252/emmm.201606967. Print 2016 Dec. EMBO Mol Med. 2016. PMID: 27784710 Free PMC article.
References
-
- Ackerman MJ, Priori SG, Willems S, Berul C, Brugada R, Calkins H, Camm AJ, Ellinor PT, Gollob M, Hamilton R et al (2011) HRS/EHRA expert consensus statement on the state of genetic testing of the channelopathies and cardiomyopathies. Europace 13: 1077–1109 - PubMed
-
- Bannister ML, Thomas NL, Sikkel MB, Mukherjee S, Maxwell C, MacLeod KT, George CH, Williams AJ (2015) The mechanism of flecainide action in CPVT does not involve a direct effect on RyR2. Circ Res 116: 1324–1335 - PubMed
-
- Beqqali A, Kloots J, Ward‐van Oostwaard D, Mummery C, Passier R (2006) Genome‐wide transcriptional profiling of human embryonic stem cells differentiating to cardiomyocytes. Stem Cells 24: 1956–1967 - PubMed
Publication types
MeSH terms
Substances
Grants and funding
LinkOut - more resources
Full Text Sources
Other Literature Sources
Medical
Molecular Biology Databases
Research Materials
Miscellaneous
