

Gut microbiota influences pathological angiogenesis in obesity-driven choroidal neovascularization
- PMID: 27861126
- PMCID: PMC5167134
- DOI: 10.15252/emmm.201606531
Gut microbiota influences pathological angiogenesis in obesity-driven choroidal neovascularization
Abstract
Age-related macular degeneration in its neovascular form (NV AMD) is the leading cause of vision loss among adults above the age of 60. Epidemiological data suggest that in men, overall abdominal obesity is the second most important environmental risk factor after smoking for progression to late-stage NV AMD To date, the mechanisms that underscore this observation remain ill-defined. Given the impact of high-fat diets on gut microbiota, we investigated whether commensal microbes influence the evolution of AMD Using mouse models of NV AMD, microbiotal transplants, and other paradigms that modify the gut microbiome, we uncoupled weight gain from confounding factors and demonstrate that high-fat diets exacerbate choroidal neovascularization (CNV) by altering gut microbiota. Gut dysbiosis leads to heightened intestinal permeability and chronic low-grade inflammation characteristic of inflammaging with elevated production of IL-6, IL-1β, TNF-α, and VEGF-A that ultimately aggravate pathological angiogenesis.
Keywords: age‐related macular degeneration; angiogenesis; gut microbiota; inflammaging; obesity.
© 2016 The Authors. Published under the terms of the CC BY 4.0 license.
Figures
- A
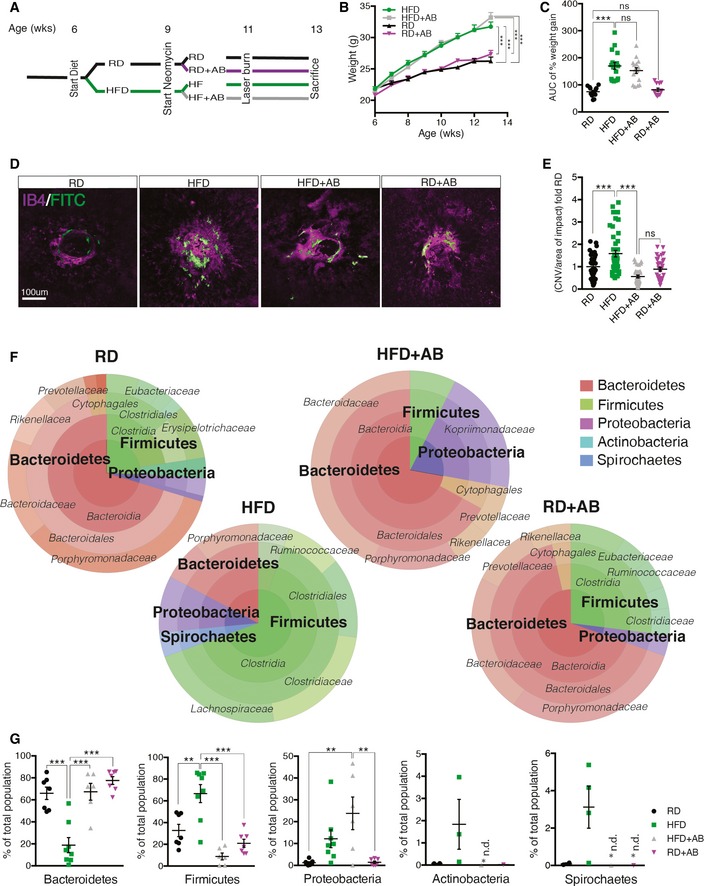
Schematic representation of experimental timeline where half of the mice start a high‐fat diet (HFD) at 6 weeks and later half of these receive neomycin (AB) treatment from the age of 9 weeks until killing at week 13. Control mice were fed a regular‐chow diet (RD). At the age of 11 weeks, mice are subjected to four laser burns per eye to perforate Bruch's membrane and recruit subretinal blood vessels from the choroid.
- B, C
Weight gain (B) and area under the curve (C) of percentage weight gain of HFD‐fed mice compared to RD‐fed mice, treated with vehicle or antibiotic; n = 13 (RD), 17 (HFD), 16 (HFD+AB), 12 (RD+AB); CI 99.9%.
- D
Compilation of compressed Z‐stack confocal image of FITC–dextran‐labeled CNV and single‐plane confocal image of isolectin B4‐stained choroidal flat mounts from RD‐ and HFD‐fed mice, with vehicle or antibiotic treatment.
- E
Quantification of area of FITC–dextran‐labeled CNV over isolectin B4‐stained laser impact area fold RD; n = 11 (RD), 16 (HFD), 11 (HFD+AB), 12 (RD+AB), with 36 (RD), 32 (HFD), 33 (HFD+AB), 34 (RD+AB) burns total; CI 99%.
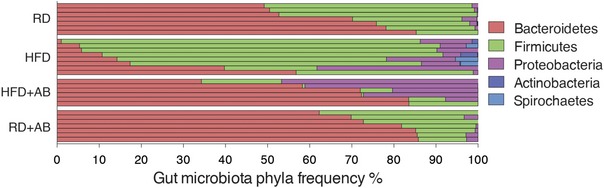
- F, G
Representative circle charts of relative abundance of bacterial phyla, class, order, and family (from central to peripheral), in gut microbiota of RD‐fed mice with vehicle, HFD‐fed mice with vehicle, HFD‐fed mice with neomycin, and RD‐fed mice with neomycin (F) and relative proportion per group of different phyla; n = 7 (RD), 8 (HFD), 6 (HFD+AB), 7 (RD+AB); Bacteroidetes; CI 99.9%, Firmicutes; CI 99%, Proteobacteria; CI 99%, Actinobacteria and Spirochaetes (G). *n.d. = not detected.
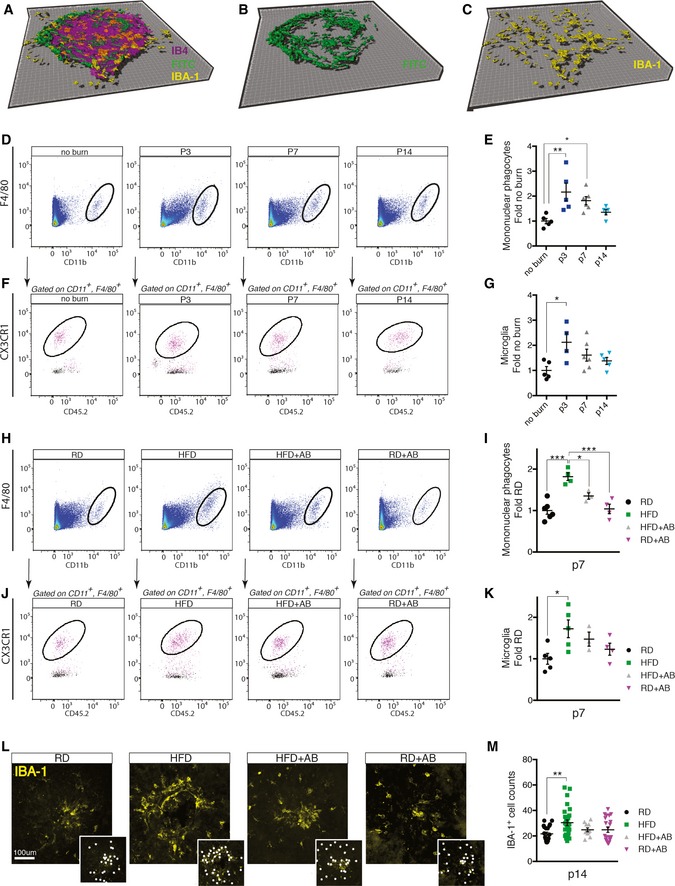
- A–C
3D rendering of Z‐stack confocal image showing isolectin B4‐stained laser burn with FITC–dextran‐labeled CNV and IBA‐1‐stained MPs.
- D
Representative FACS plots of retinas and sclera–choroid–RPE cell complexes from regular‐chow diet (RD)‐fed mice without and 3, 7, and 14 days after laser burn.
- E
Quantification of MPs (Ly6G−, F4/80+, CD11b+) at p3, p7, and p14; fold naïve (no burn); n = 5 (no burn), 5 (p3), 6 (p7), 5 (p14); CI 95%.
- F, G
Representative FACS plots (F) and quantification of microglia (G) (Ly6G−, F4/80+, CD11b+, CX3CR1hi CD45lo) fold naïve; n = 5 (no burn), 4 (p3), 6 (p7), 5 (p14); CI 95%.
- H
Representative FACS plots of retinas and sclera–choroid–RPE cell complexes from RD‐ and HFD‐fed mice, with vehicle or antibiotic treatment at p7.
- I
Quantification of MPs at p7 fold RD; n = 6 (RD), 4 (HFD), 3 (HFD+AB), 4 (RD+AB); CI 95%.
- J, K
Representative FACS plots (J) and quantification of microglia (K) (Ly6G−, F4/80+, CD11b+, CX3CR1hi CD45lo) fold RD; n = 5 (RD), 5 (HFD), 3 (HFD+AB), 4 (RD+AB); CI 95%.
- L
Representative confocal images of IBA‐1‐stained MPs on choroidal flat mounts from RD‐ and HFD‐fed mice, treated with vehicle or with neomycin. Examples of labeled macrophages (white dots) are presented in side panels.
- M
Total number of MPs around laser impact area; n = 7 (RD), 9 (HFD), 4 (HFD+AB), 7 (RD+AB), with 23 (RD), 29 (HFD), 13 (HFD+AB), 23 (RD+AB) burns total; CI 99%.
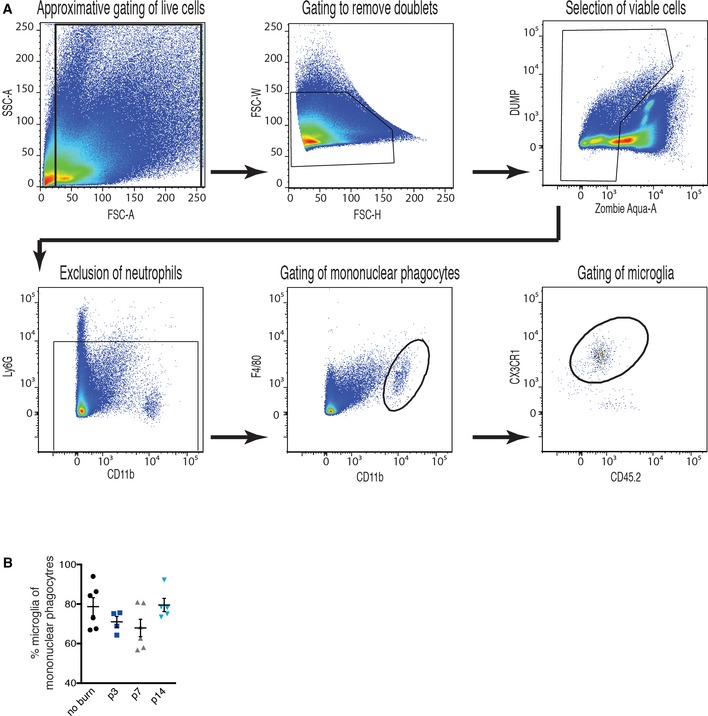
Gating scheme explaining the identification of the Ly6G−, F4/80+, CD11b+ mononuclear phagocytes and the Ly6G−, F4/80+, CD11b+, CX3CR1hi CD45lo microglia in retinas and sclera–choroid–RPE cell complexes. The gating scheme was as follows: gating of live cells, removal of doublets, selection of viable cells, exclusion of neutrophils, gating of mononuclear macrophages, and gating of microglia.
Quantification of overall proportion of microglia within the MP population; n = 6 (no burn), 4 (p3), 6 (p7), 5 (p14). Error bars represent mean ± SEM. Each “n” represents one mouse.
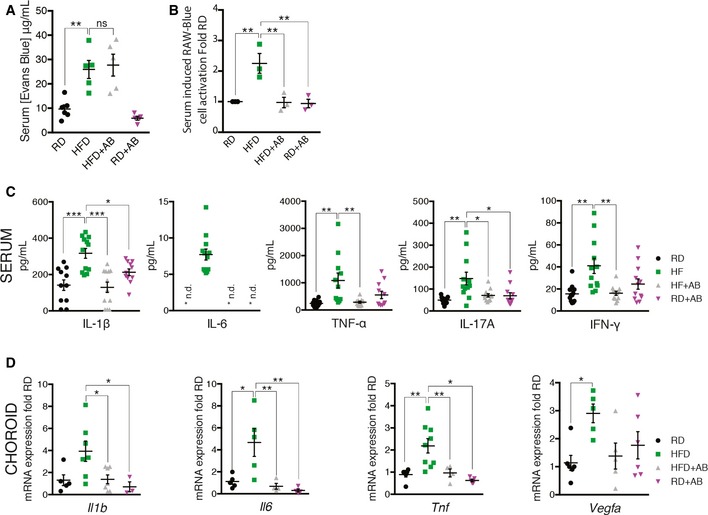
Concentration of gut‐absorbed Evans Blue in serum 24 h after oral administration in regular‐chow diet (RD)‐ and high‐fat diet (HFD)‐fed mice, treated with vehicle or with antibiotic; n = 6 (RD), 5 (HFD), 5 (HFD+AB), 5 (RD+AB); CI 99%.
Activation of PRRs induced by stimulation with serum isolated from mice fed RD or HFD for 7 weeks and receiving vehicle or neomycin for 3 weeks; fold RD; n = 3 for all groups; CI 99%.
Serum cytokine profiles determined by Bio‐Plex assay (Bio‐Rad) of IL‐1β, n = 11 (RD), 12 (HFD), 12 (HFD+AB), 11 (RD+AB); CI 95%; IL‐6, n = 11 (RD), 12 (HFD), 12 (HFD+AB), 11 (RD+AB), CI 99.9%; TNF‐α, n = 11 for all groups, CI 99%; IL‐17A, n = 11 (RD), 12 (HFD), 12 (HFD+AB), 11 (RD+AB), CI 95%; and IFN‐γ, n = 12 for all groups, CI 95%. *n.d. = not detected.
mRNA expression of Il1b, n = 5 (RD), 7 (HFD), 7 (HFD+AB), 3 (RD+AB), CI 95%; Il6, n = 5 (RD), 5 (HFD), 4 (HFD+AB), 4 (RD+AB), CI 95%; Tnfa, n = 6 (RD), 9 (HFD), 4 (HFD+AB), 5 (RD+AB), CI 95%; and Vegfa, n = 6 (RD), 5 (HFD), 5 (HFD+AB), 6 (RD+AB), CI 95% in choroids.
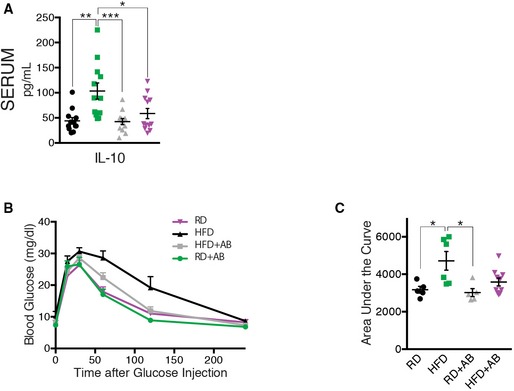
Serum IL‐10 profile; n = 12 for all groups; CI 95%.
Blood glucose (mg/dl) following intraperitoneal injection of glucose (2 mg/kg) in RD, HFD, HFD+AB, and RD+AB mice. n = 5 (RD), 6 (HFD), 5 (HFD+AB), 10 (RD+AB); CI 95%.
Area under the curve (AUC) of the same groups as in (B).
- A
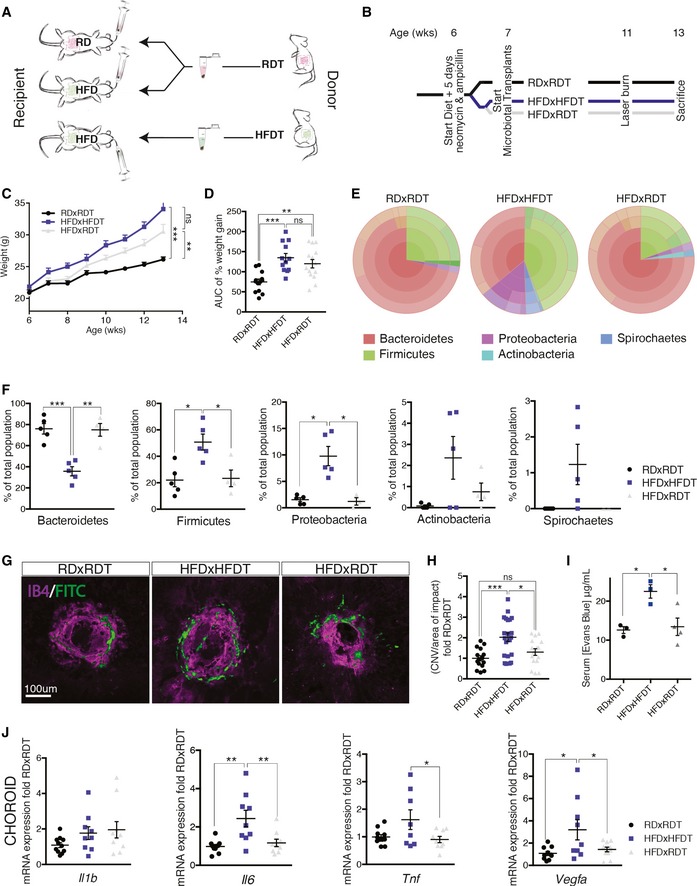
Schematic representation of microbiotal transfer experiments where recipient mice are gavaged with a suspension of fecal pellets in PBS from donor mice that are fed either a regular‐chow diet (RD) or a high‐fat diet (HFD).
- B
Experimental timeline describing preparation of mice for microbiotal transfers where mice receive 5 days of antibiotics (neomycin and ampicillin) at 6 weeks of age. Starting at 7 weeks of life, RDxRDT and HFDxRDT mice receive weekly microbiotal transplants from RD donor mice and HFDxHFDT mice receive weekly microbiotal transplants from HFD donor mice until killing at week 13. At the age of 11 weeks, mice are subjected to four laser burns per eye.
- C, D
Weight gain (C) and area under the curve (D) of percentage weight gain of RDxRDT, HFDxRDT, and HFDxHFDT mice; n = 13 (RDxRDT), 12 (HFDxHFDT), 14 (HFDxRDT); CI 99%.
- E
Representative circle charts of relative abundance of bacterial phyla in gut microbiota of RD‐fed mice receiving a RD transfer and HFD‐fed mice receiving a HFD or RD transfer.
- F
Relative proportion per experimental group of different phyla; n = 5 (RDxRDT), 5 (HFDxHFDT), 4 (HFDxRDT); Bacteroidetes; CI 99%, Firmicutes; CI 95%, Proteobacteria; CI 95%, Actinobacteria and Spirochaetes.
- G
Compilation of compressed Z‐stack confocal images of FITC–dextran‐labeled CNV and single‐plane confocal images of isolectin B4‐stained choroidal flat mounts from RDxRDT, HFDxRDT, and HFDxHFDT mice.
- H
Quantification of area of FITC–dextran‐labeled CNV over area of isolectin B4‐stained laser impact area fold RDxRDT; n = 6 (RDxRDT), 9 (HFDxHFDT), 9 (HFDxRDT), with 15 (RDxRDT), 21 (HFDxHFDT), 16 (HFDxRDT) burns total; CI 95%.
- I
Concentration of gut‐absorbed Evans Blue in serum 24 h after oral administration in RD‐ and HFD‐fed mice, after RD or HFD microbiotal transplant; n = 3 (RDxRDT), 3 (HFDxHFDT), 4 (HFDxRDT); CI 95%.
- J
mRNA expression of Il1b: n = 5 (RDxRDT), 4 (HFDxHFDT), 5 (HFDxRDT); Il6: n = 5 (RDxRDT), 4 (HFDxHFDT), 4 (HFDxRDT), CI 99%; Tnfa: n = 5 (RDxRDT), 4 (HFDxHFDT), 4 (HFDxRDT), CI 95%; and Vegfa: n = 5 (RDxRDT), 4 (HFDxHFDT), 5 (HFDxRDT), CI 95% in choroids.
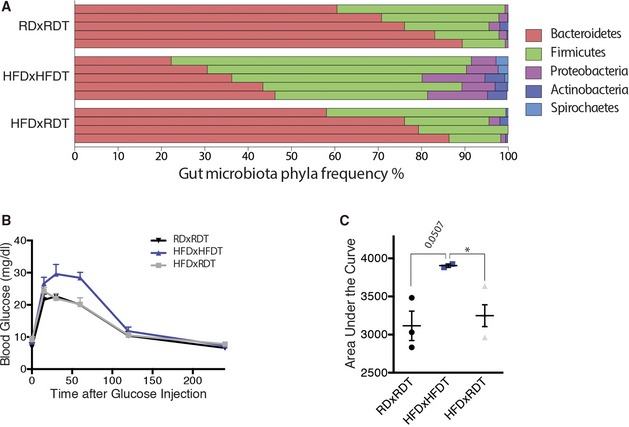
Relative abundance of bacterial phyla in gut microbiota of RDxRDT, HFDxHFDT, and HFDxRDT mice, shown per sample; n = 5 (RDxRDT), 5 (HFDxHFDT), 4 (HFDxRDT).
Blood glucose (mg/dl) following intraperitoneal injection of glucose (2 mg/kg) in RDxRDT, HFDxHFDT, and HFDxRDT mice. n = 3 (RDxRDT), 2 (HFDxHFDT), 4 (HFDxRDT); CI 95%.
Area under the curve (AUC) of the same groups as in (B). All comparisons between groups are analyzed using one‐way analysis of variance (ANOVA) and Tukey's multiple comparisons test; *P < 0.05; error bars represent mean ± SEM. Each “n” represents one mouse; CI, confidence interval.

Comment in
-
Gut flora connects obesity with pathological angiogenesis in the eye.EMBO Mol Med. 2016 Dec 1;8(12):1361-1363. doi: 10.15252/emmm.201607165. Print 2016 Dec. EMBO Mol Med. 2016. PMID: 27861130 Free PMC article.
References
-
- Adams MKM, Simpson J, Aung K, Makeyeva G, Giles G, English D, Hopper J, Guymer R, Baird P, Robman L (2011) Abdominal obesity and age‐related macular degeneration. Am J Epidemiol 173: 1246–1255 - PubMed
-
- Age‐Related Eye Disease Study 2 Research Group (2013) Lutein + zeaxanthin and omega‐3 fatty acids for age‐related macular degeneration: the Age‐Related Eye Disease Study 2 (AREDS2) randomized clinical trial. J Am Med Assoc 309: 2005–2015 - PubMed
-
- Amar J, Burcelin R, Ruidavets JB, Cani PD, Fauvel J, Alessi MC, Chamontin B, Ferrieres J (2008) Energy intake is associated with endotoxemia in apparently healthy men. Am J Clin Nutr 87: 1219–1223 - PubMed
-
- Ambati J, Ambati B, Yoo S, Ianchulev S, Adamis A (2003a) Age‐related macular degeneration: etiology, pathogenesis, and therapeutic strategies. Surv Ophthalmol 48: 257–293 - PubMed
Publication types
MeSH terms
Substances
Grants and funding
LinkOut - more resources
Full Text Sources
Other Literature Sources
Medical
Molecular Biology Databases
