

Numerical Assessment of Novel Helical/Spiral Grafts with Improved Hemodynamics for Distal Graft Anastomoses
- PMID: 27861485
- PMCID: PMC5115668
- DOI: 10.1371/journal.pone.0165892
Numerical Assessment of Novel Helical/Spiral Grafts with Improved Hemodynamics for Distal Graft Anastomoses
Abstract
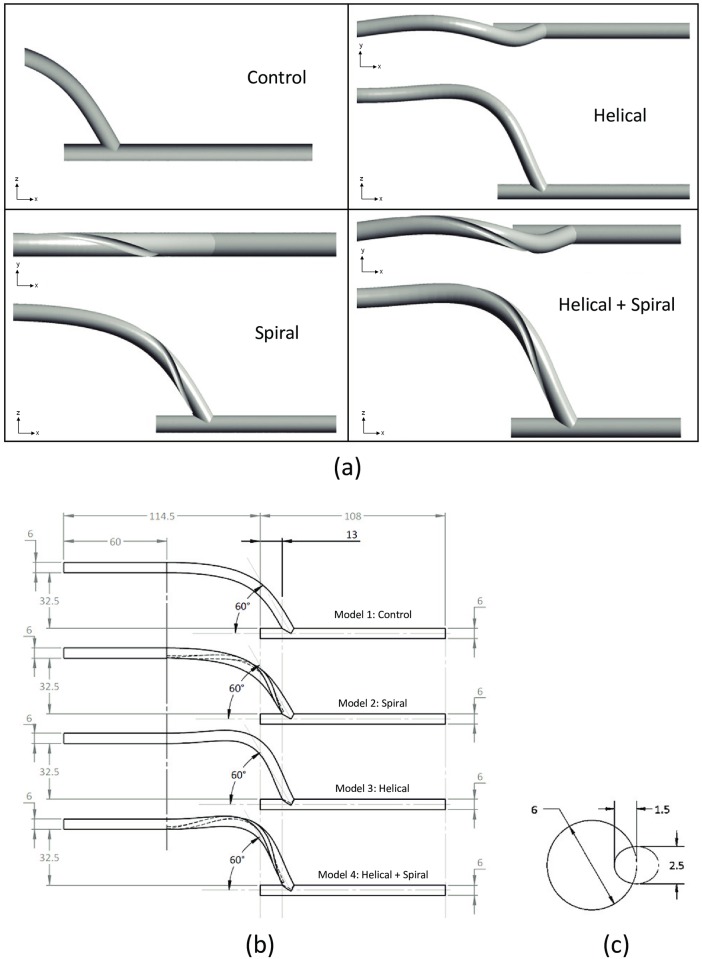
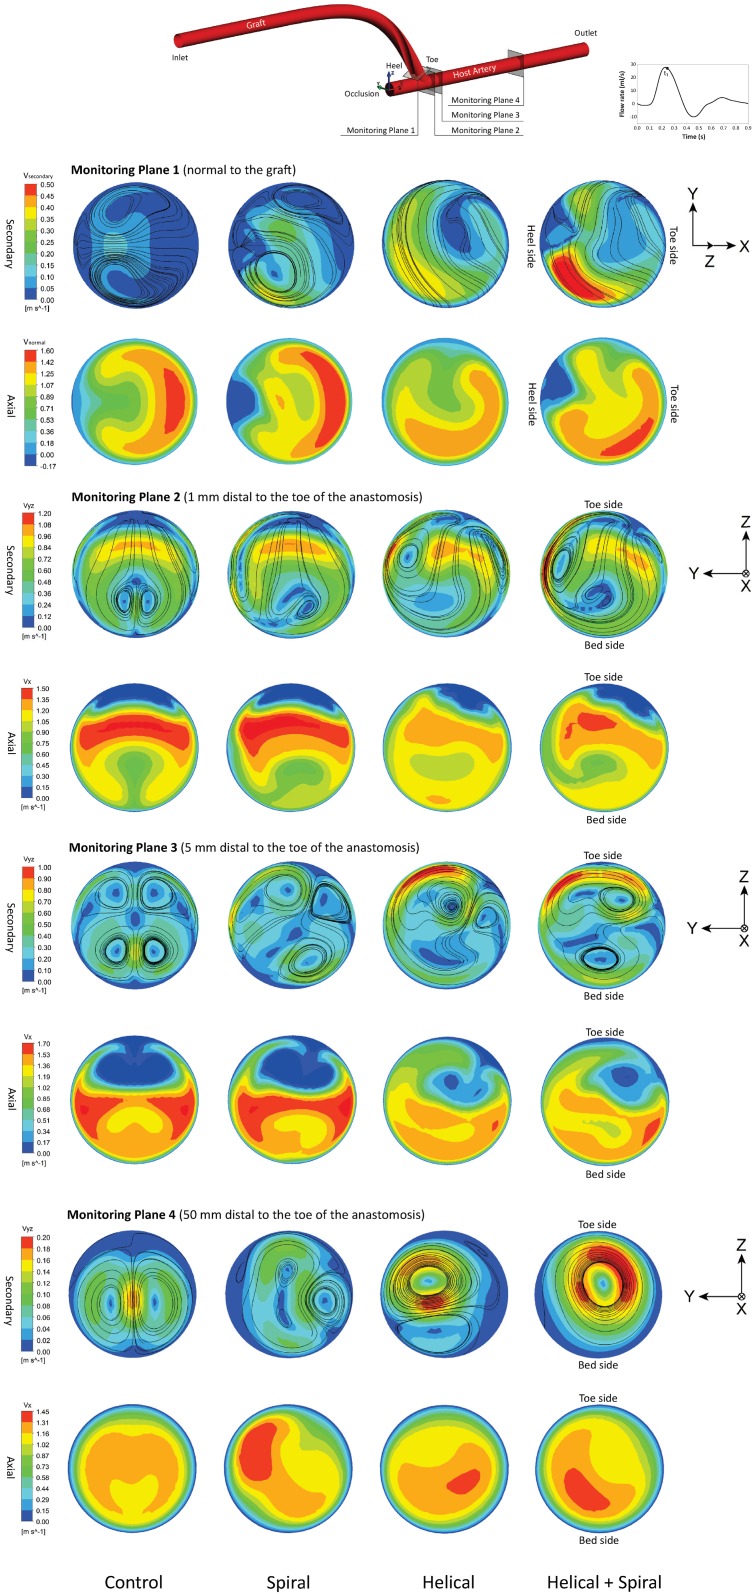
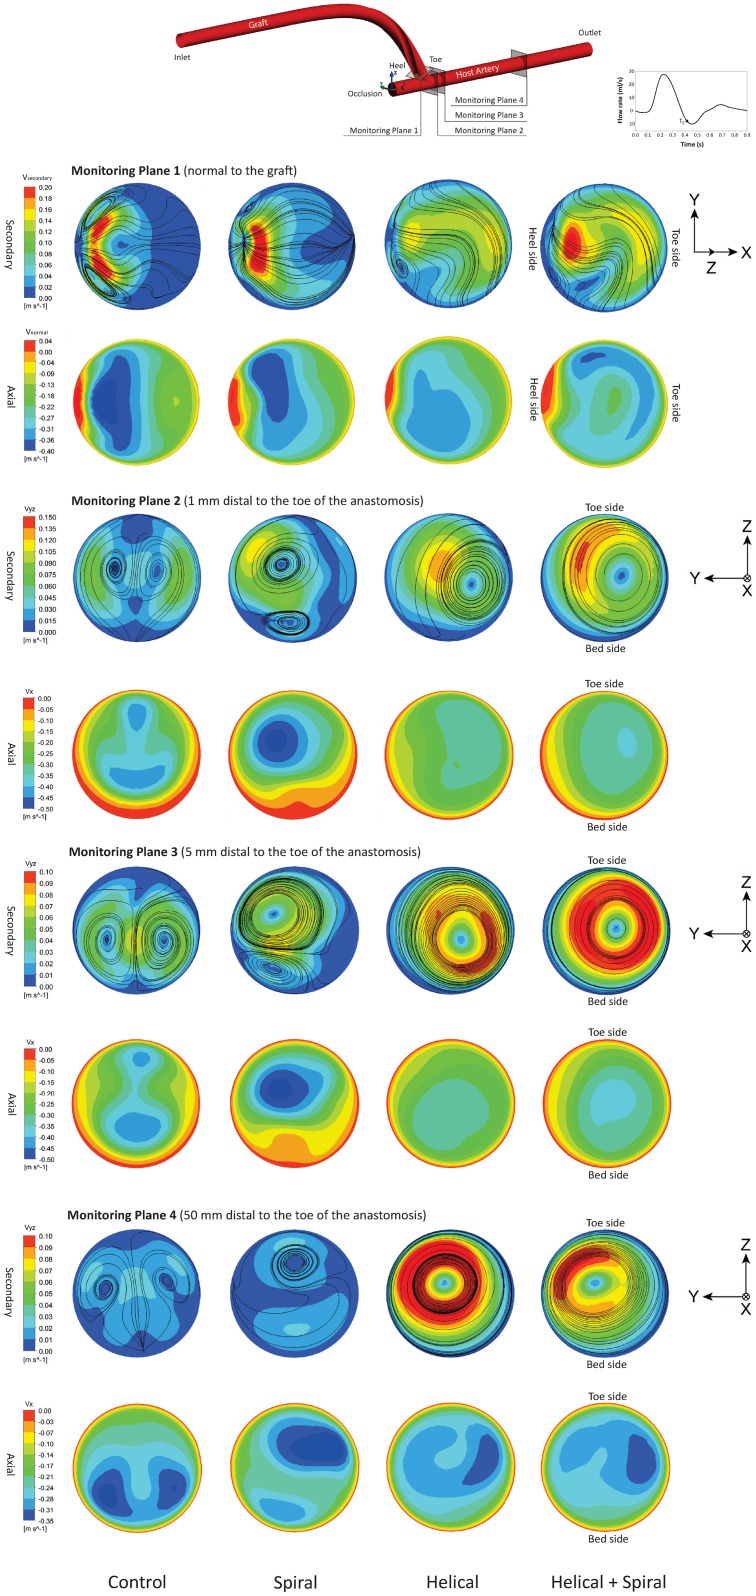
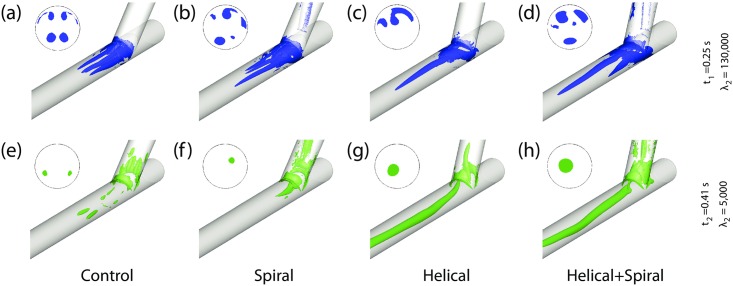
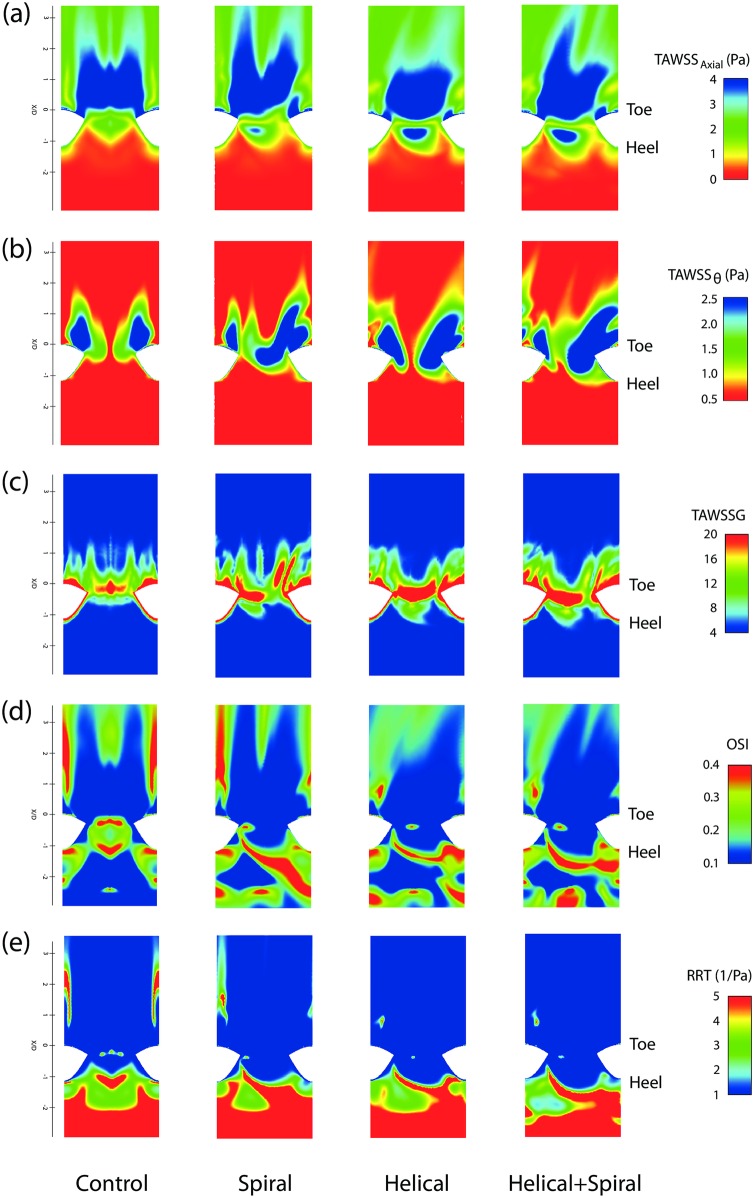
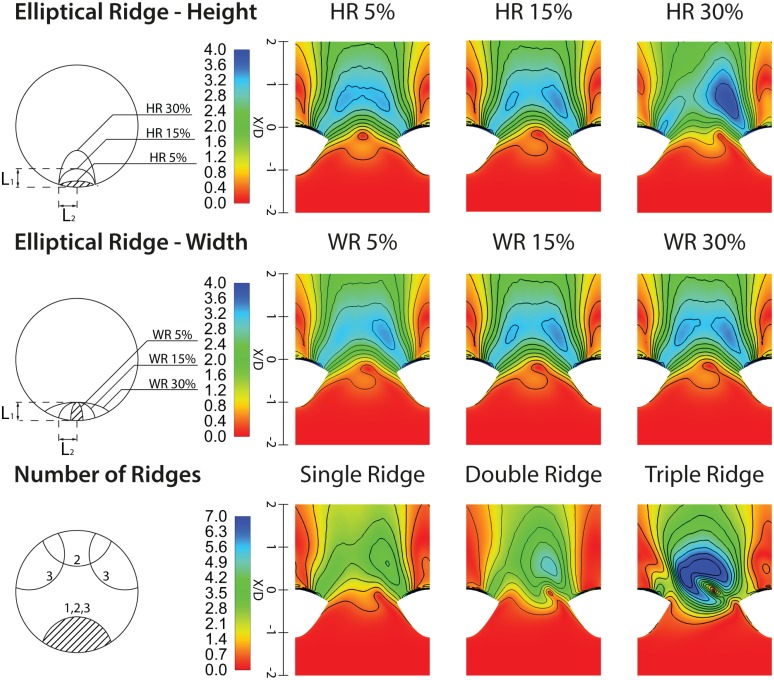
In the present work, numerical simulations were conducted for a typical end-to-side distal graft anastomosis to assess the effects of inducing secondary flow, which is believed to remove unfavourable flow environment. Simulations were carried out for four models, generated based on two main features of 'out-of-plane helicity' and 'spiral ridge' in the grafts as well as their combination. Following a qualitative comparison against in vitro data, various mean flow and hemodynamic parameters were compared and the results showed that helicity is significantly more effective in inducing swirling flow in comparison to a spiral ridge, while their combination could be even more effective. In addition, the induced swirling flow was generally found to be increasing the wall shear stress and reducing the flow stagnation and particle residence time within the anastomotic region and the host artery, which may be beneficial to the graft longevity and patency rates. Finally, a parametric study on the spiral ridge geometrical features was conducted, which showed that the ridge height and the number of spiral ridges have significant effects on inducing swirling flow, and revealed the potential of improving the efficiency of such designs.
Conflict of interest statement
The authors have declared that no competing interests exist.
Figures
Similar articles
-
Optimisation of a Novel Spiral-Inducing Bypass Graft Using Computational Fluid Dynamics.Sci Rep. 2017 May 12;7(1):1865. doi: 10.1038/s41598-017-01930-x. Sci Rep. 2017. PMID: 28500311 Free PMC article.
-
Numerical simulation of wall shear stress and particle-based hemodynamic parameters in pre-cuffed and streamlined end-to-side anastomoses.Ann Biomed Eng. 2005 Dec;33(12):1752-66. doi: 10.1007/s10439-005-7784-2. Ann Biomed Eng. 2005. PMID: 16389524
-
Swirling flow pattern in a non-planar model of an interposition vein cuff anastomosis.Med Eng Phys. 2006 Jan;28(1):27-35. doi: 10.1016/j.medengphy.2005.04.016. Med Eng Phys. 2006. PMID: 15921948
-
A novel coronary artery bypass graft design of sequential anastomoses.Ann Biomed Eng. 2010 Oct;38(10):3135-50. doi: 10.1007/s10439-010-0068-5. Epub 2010 May 22. Ann Biomed Eng. 2010. PMID: 20496004 Review.
-
Intimal hyperplasia and hemodynamic factors in arterial bypass and arteriovenous grafts: a review.J Artif Organs. 2003;6(4):227-35. doi: 10.1007/s10047-003-0232-x. J Artif Organs. 2003. PMID: 14691664 Review.
Cited by
-
Haemodynamic optimisation of a dialysis graft design using a global optimisation approach.Int J Numer Method Biomed Eng. 2021 Feb;37(2):e3423. doi: 10.1002/cnm.3423. Epub 2020 Dec 9. Int J Numer Method Biomed Eng. 2021. PMID: 33249781 Free PMC article.
-
Numerical Study of Atrial Fibrillation Effects on Flow Distribution in Aortic Circulation.Ann Biomed Eng. 2020 Apr;48(4):1291-1308. doi: 10.1007/s10439-020-02448-6. Epub 2020 Jan 14. Ann Biomed Eng. 2020. PMID: 31938982 Free PMC article.
-
Multi-Objective Optimisation of a Novel Bypass Graft with a Spiral Ridge.Bioengineering (Basel). 2023 Apr 19;10(4):489. doi: 10.3390/bioengineering10040489. Bioengineering (Basel). 2023. PMID: 37106676 Free PMC article.
-
Numerical investigation of LDL nanoparticle collision in coronary artery grafts with porous wall and different implantation angles and two state of inlet velocity.PLoS One. 2024 Apr 16;19(4):e0300326. doi: 10.1371/journal.pone.0300326. eCollection 2024. PLoS One. 2024. PMID: 38626003 Free PMC article.
-
Optimisation of a Novel Spiral-Inducing Bypass Graft Using Computational Fluid Dynamics.Sci Rep. 2017 May 12;7(1):1865. doi: 10.1038/s41598-017-01930-x. Sci Rep. 2017. PMID: 28500311 Free PMC article.
References
-
- Bryan AJ, Angelini GD. The biology of saphenous vein graft occlusion: Etiology and strategies for prevention [Internet]. Current Opinion in Cardiology. 1994. pp. 641–649. Available: http://www.scopus.com/inward/record.url?eid=2-s2.0-0028110505&partnerID=.... - PubMed
-
- Whittemore AD, Clowes AW, Couch NP, Mannick JA. Secondary femoropopliteal reconstruction. Ann Surg. 1981;193: 35–42. Available: http://www.scopus.com/inward/record.url?eid=2-s2.0-0019497801&partnerID=.... - PMC - PubMed
-
- Archie JP, Hyun S, Kleinstreuer C, Longest PW, Truskey GA, Buchanan JR. Hemodynamic parameters and early intimal thickening in branching blood vessels [Internet]. Critical Reviews in Biomedical Engineering. 2001. pp. 1–64. Available: http://www.scopus.com/inward/record.url?eid=2-s2.0-0035045889&partnerID=.... - PubMed
MeSH terms
LinkOut - more resources
Full Text Sources
Other Literature Sources
