. 2016 Nov 18;11(11):e0163925.
doi: 10.1371/journal.pone.0163925. eCollection 2016.

Two Opsin 3-Related Proteins in the Chicken Retina and Brain: A TMT-Type Opsin 3 Is a Blue-Light Sensor in Retinal Horizontal Cells, Hypothalamus, and Cerebellum

Affiliations

Two Opsin 3-Related Proteins in the Chicken Retina and Brain: A TMT-Type Opsin 3 Is a Blue-Light Sensor in Retinal Horizontal Cells, Hypothalamus, and Cerebellum

Mutsuko Kato et al. PLoS One. .

Abstract

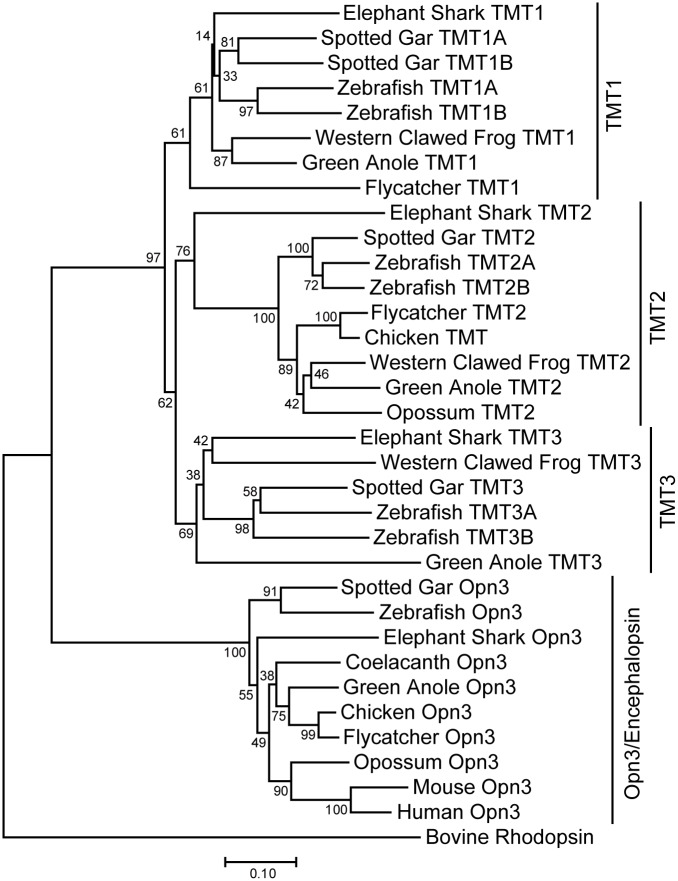
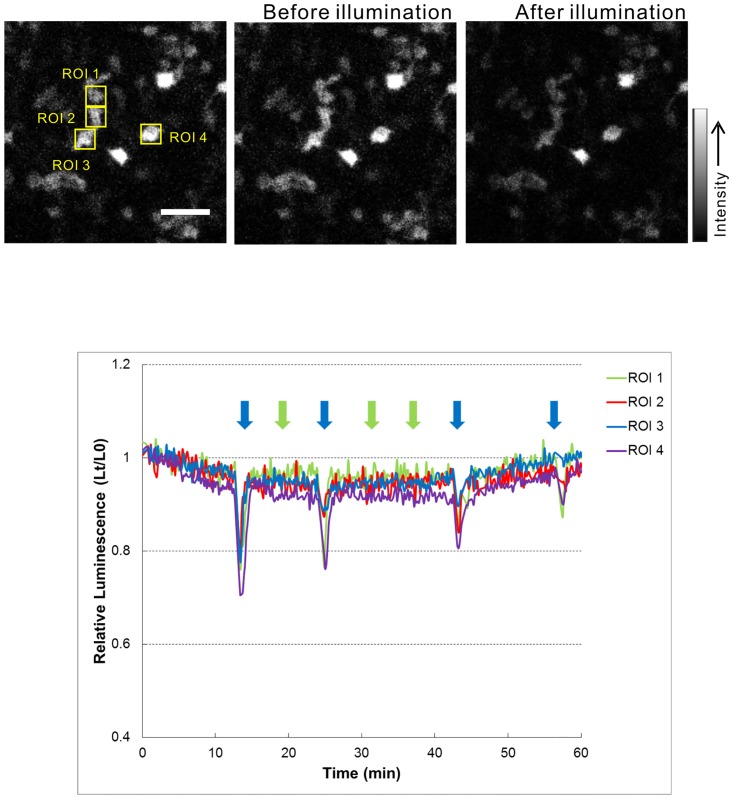
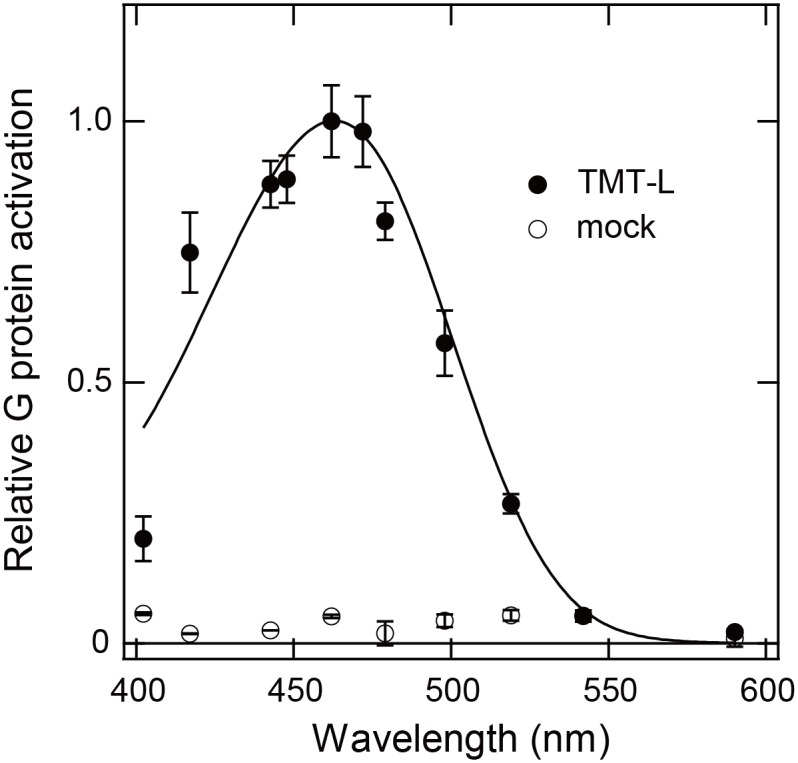
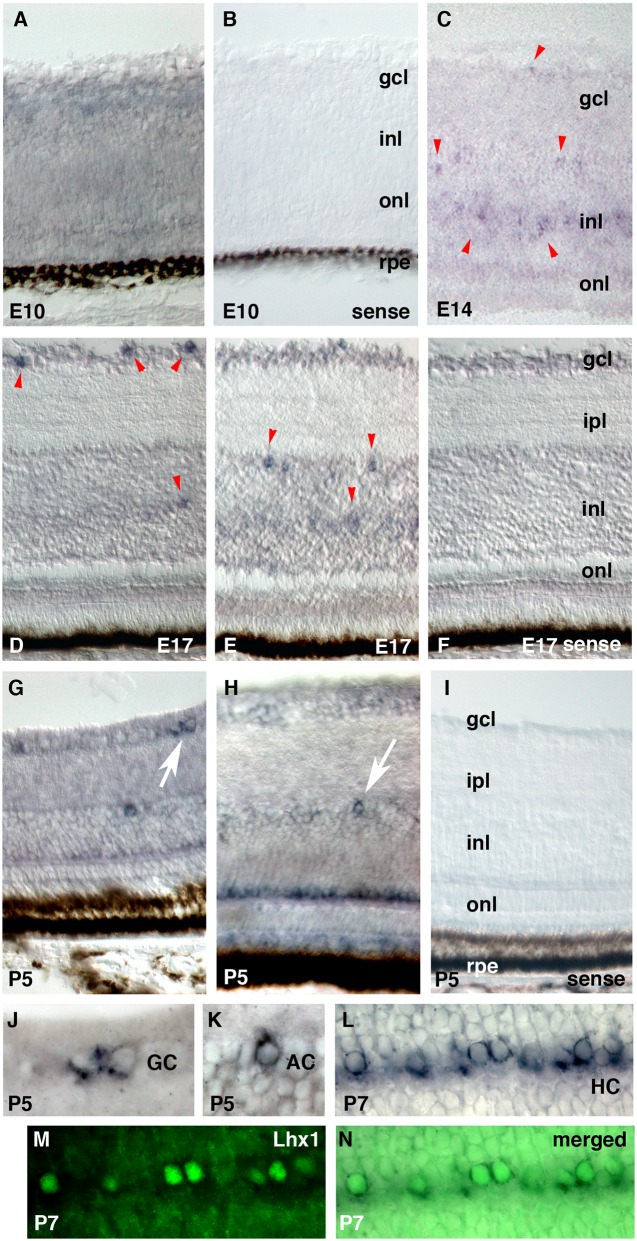
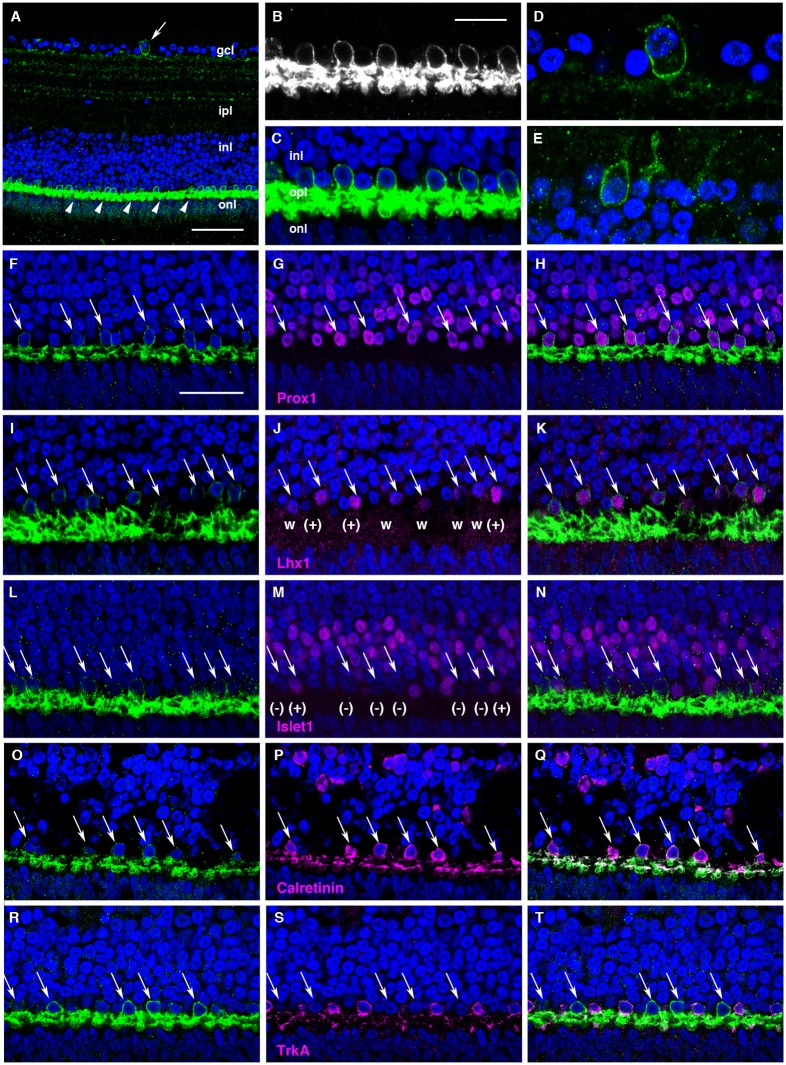
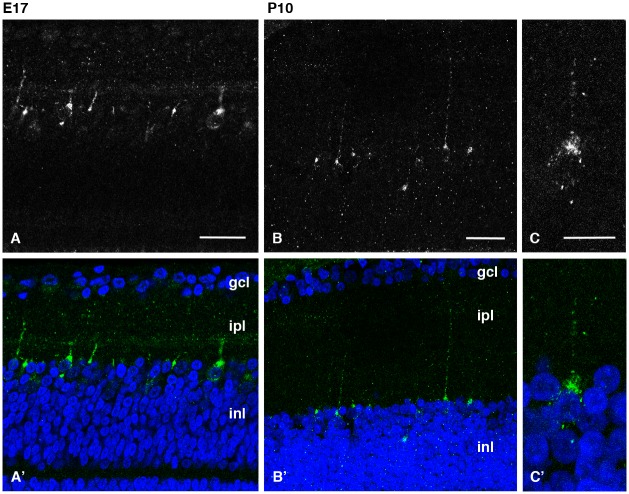
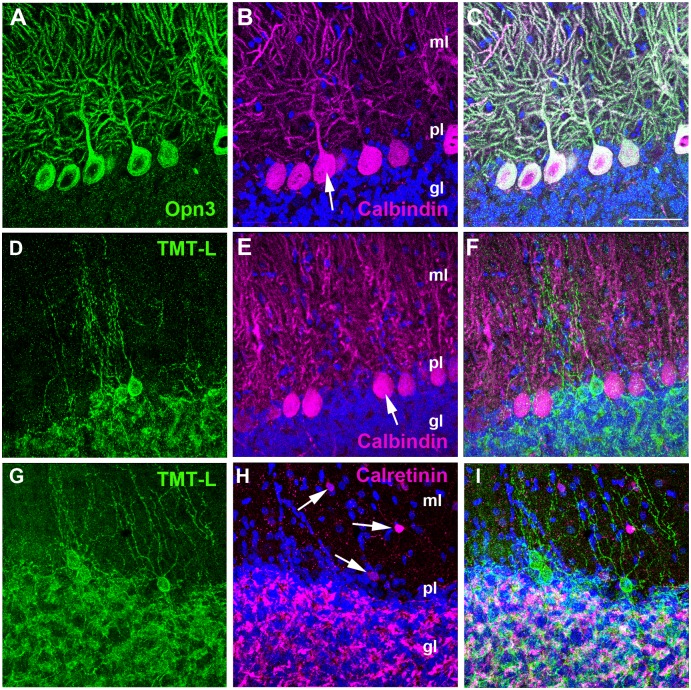
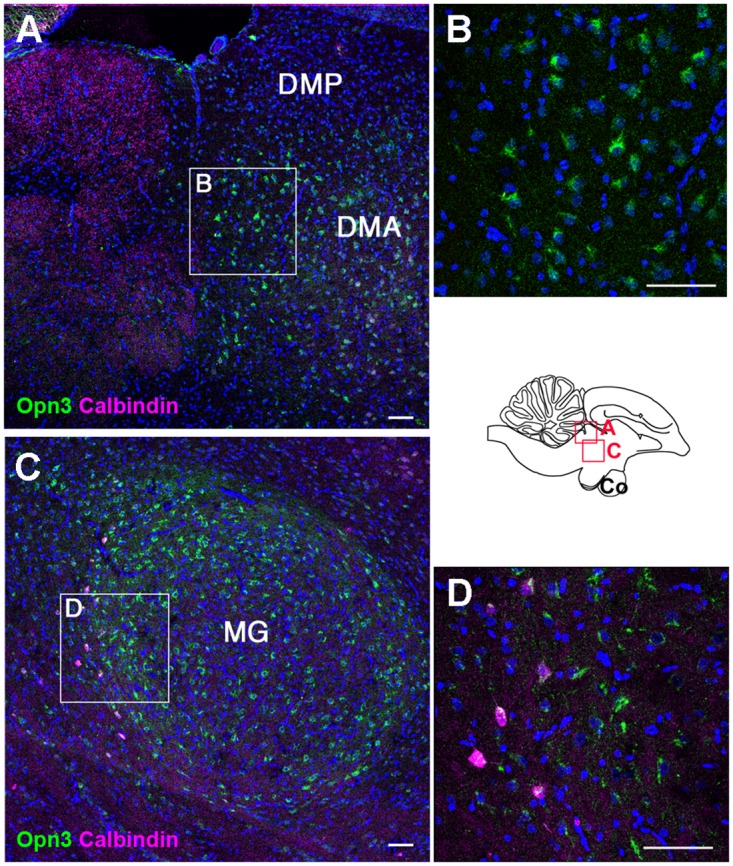
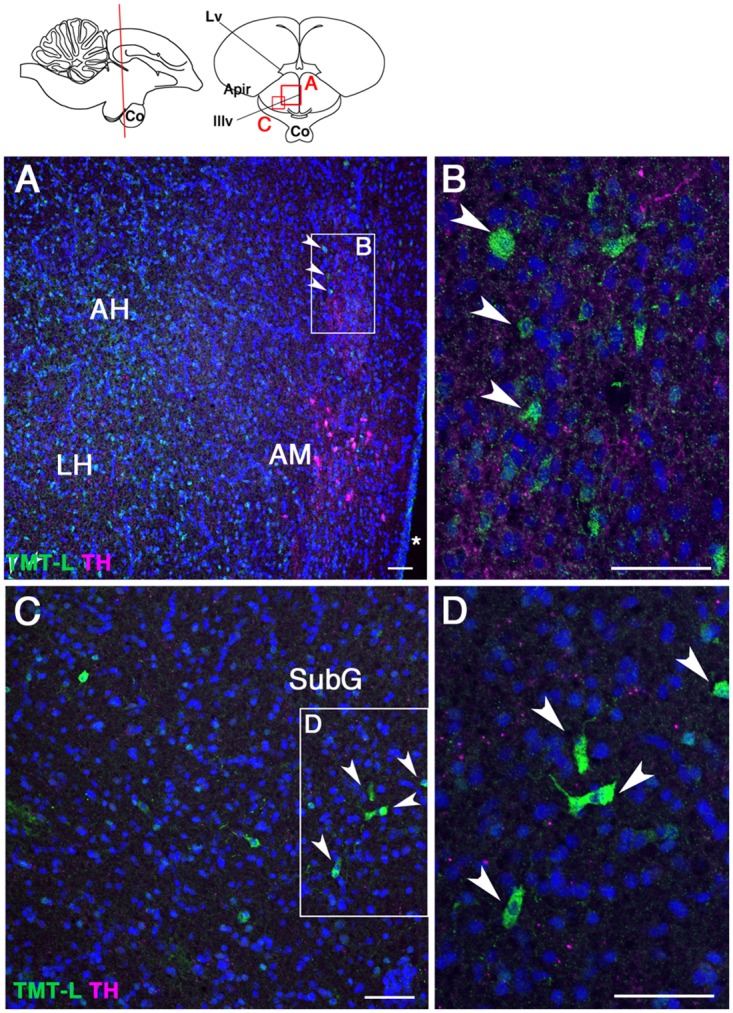
Opsin family genes encode G protein-coupled seven-transmembrane proteins that bind a retinaldehyde chromophore in photoreception. Here, we sought potential as yet undescribed avian retinal photoreceptors, focusing on Opsin 3 homologs in the chicken. We found two Opsin 3-related genes in the chicken genome: one corresponding to encephalopsin/panopsin (Opn3) in mammals, and the other belonging to the teleost multiple tissue opsin (TMT) 2 group. Bioluminescence imaging and G protein activation assays demonstrated that the chicken TMT opsin (cTMT) functions as a blue light sensor when forced-expressed in mammalian cultured cells. We did not detect evidence of light sensitivity for the chicken Opn3 (cOpn3). In situ hybridization demonstrated expression of cTMT in subsets of differentiating cells in the inner retina and, as development progressed, predominant localization to retinal horizontal cells (HCs). Immunohistochemistry (IHC) revealed cTMT in HCs as well as in small numbers of cells in the ganglion and inner nuclear layers of the post-hatch chicken retina. In contrast, cOpn3-IR cells were found in distinct subsets of cells in the inner nuclear layer. cTMT-IR cells were also found in subsets of cells in the hypothalamus. Finally, we found differential distribution of cOpn3 and cTMT proteins in specific cells of the cerebellum. The present results suggest that a novel TMT-type opsin 3 may function as a photoreceptor in the chicken retina and brain.


Conflict of interest statement

Olympus Corporation: this commercial affiliation does not alter our adherence to all PLOS ONE policies on sharing data and materials. Pfizer Japan Inc.: this commercial funder does not alter our adherence to PLOS ONE policies on sharing data and materials, either.

Figures

Fig 1
Fig 1. Phylogenetic tree of opsin 3-related proteins.
The opsin proteins are depicted by the neighbor-joining method. Bovine rhodopsin was used as the outgroup. The scale bar is calibrated to substitutions per site. Numbers show bootstrap confidence values. Amino acid sequences used in the tree construction were deduced from the nucleotide sequences listed in S2 Table.
Fig 2
Fig 2. Intron-exon structure of Opn3 (A) and TMT (B) in chicken, mouse, and zebrafish.
Exons and introns are indicated with open boxes and solid bars, respectively. Approximate gene sizes are shown. Flanking genes (see S3 Table) are shown in parenthesis. Direction of transcription is indicated with an arrow. Note that the fourth exon of cTMT-L is in the intron of the next gene, st6gal2.
Fig 3
Fig 3. Syntenic regions encompassing the Opn3 (A) and TMT1 (B) loci.
The Opn3 and TMT1 genes are indicated as opn3 and tmtop1 in red, respectively. The same colored boxes designate orthologous genes. Open boxes indicate non-orthologous gene displacement. Gene products and symbol definitions are listed in S3 Table.
Fig 4
Fig 4. Ca2+ responses after light stimulation of cTMT-L-expressing cells.
Cells transfected with both cTMT-L and cpGL-CaM were treated with 11-cis-retinal (5 μM) and luciferin (2 mM). Luminescence intensity in images acquired every 10 s was calculated relative to that measured at imaging onset (Lt/L0) for cells in the indicated ROI (upper left) as shown in the trace. Representative bioluminescence images acquired before (upper center) and after (upper right) illumination are shown. Relative bioluminescence signals (Lt/L0) of cTMT-L-expressing cells decreased following blue light pulses (470–490 nm; 10 s at 0.2 μW/mm2; blue arrows), but not with green light pulses (535–555 nm; 10 s at 0.2 μW/mm2; green arrows). Representative imaging data from three independent experiments are shown. Scale bars: 50 μm.
Fig 5
Fig 5. Wavelength dependence of Go activation efficiencies of cTMT-L.
An action spectrum was constructed from wavelength-dependent Go activation efficiencies of cTMT-L-transfected (closed circle) or mock-transfected (open circle) HEK293T cell membranes. G protein activation efficiency was measured by irradiation with eleven different light wavelengths of various intensities (S2 Fig). The relative Go activation efficiencies obtained by irradiation at around 2.3 × 10¹³ photons/mm2 were calculated by normalizing the maximum value to 1.0. The data were best fitted to a Govardovskii template with a λmax of 463 nm (solid curve). All data represent the mean ± S.D. of four independent experiments.
Fig 6
Fig 6. In situ hybridization of cTMT in the developing and post-hatch retina.
Central retina is shown, vitreal side up, unless otherwise indicated. Negative sense-probe controls are shown in panels B, F, and I. (A) Diffuse cTMT mRNA in the E10 retina. (C) cTMT expression in subsets of cells in the gcl and inl at E14. (D, E) cTMT-expressing cells (arrowheads) in the gcl or inl are distinctly observed at E17. (G, H) cTMT expression in HCs at P10. Putative ganglion and amacrine cells (arrows) are enlarged in panels J and K, respectively, and peripheral retina is shown in panel G. (L-N) The same sections, showing the HCs with cTMT mRNA shown in blue (L), Lhx1 protein shown in green (M), and a merged view (N). Abbreviations: gcl, ganglion cell layer; inl, inner nuclear layer; ipl, inner plexiform layer; onl, outer nuclear layer; rpe, retinal pigment epithelium; GC, putative ganglion cell; AC, putative amacrine cell; HC, putative horizontal cell.
Fig 7
Fig 7. Localization of cTMT-L protein in P10 retina.
Immunoreactivity for cTMT-L is shown in green (white in panel B), and DAPI counterstained nuclei appear blue. (A) A cTMT-IR cell in the gcl (arrow). Intense cTMT-L labeling in the processes of HCs in the opl (arrowheads). (B) Highly magnified cTMT-IR HCs. Note the intense signal in the processes of opl HCs. (C) Merged image of section highlighted in B with DAPI nuclear counterstain. (D) Highly magnified cTMT-IR cell in the gcl (arrow in A). (E) cTMT-IR cells in the inl abutting the ipl. (F-T) Sections double labeled for cTMT-L (left panels) and HC markers (middle panels). Merged images are shown in the right panels. Arrows highlight cTMT-IR HCs. In J, there are Lhx1-positive (+) and weakly positive (w) cells among cTMT-IR cells. In M, there is a mixture of Islet1-positive (+) and -negative (-) cTMT-IR cells. Abbreviations: gcl, ganglion cell layer; inl, inner nuclear layer; ipl, inner plexiform layer; onl, outer nuclear layer; opl, outer plexiform layer. Scale bars: 50 μm in A, 12.5 μm in B-E, and 25 μm in F-T.
Fig 8
Fig 8. Localization of cOpn3 protein in E17 (A, A’) and P10 (B-C’) retina.
cOpn3 immunoreactivity is shown in white in the upper panels (A–C) and in green together with DAPI nuclear counterstain in blue in the lower panels (A’-C’). Highly magnified cOpn3-IR cell are shown in C/C’. cOpn3-IR cells can be seen in the inl abutting the opl with processes directed upward toward the ipl. Typically, each cOpn3-IR cell is heavily labeled in the soma from which a single long process emerges. Z-stack images (14 μm for B/B’, 13 μm for D/D’). Abbreviations: gcl, ganglion cell layer; ipl, inner plexiform layer; inl, inner nuclear layer. Scale bars: 100 μm in A, 25 μm in B and C, and 10 μm in D.
Fig 9
Fig 9. Localization of cOpn3 (A-C) and cTMT (D-I) proteins in P10 cerebellum (sagittal sections).
cOpn3 or cTMT, Calbindin (Purkinje cell marker) or Calretinin (stellate and basket cell marker), and cell nuclei (DAPI) are shown in green, magenta, and blue, respectively. (A-C) cOpn3 is localized to Calbindin-IR Purkinje cells. Arrow in B shows a soma of a Purkinje cell. (D, G) cTMT-L is present in small Calbindin-negative cells near Purkinje cells and in neurofibers in the cerebellar granule cell layer. (E) Calbindin-labeled Purkinje cells. Arrow in E shows a soma of a Purkinje cell. (F) Calbindin-negative cTMT-IR cells. (H) Calretinin-labeled stellate and basket cells (arrows) in the molecular layer. Mossy fibers and cerebellar glomeruli in the granule cell layer are also labeled by Calretinin (magenta). (I) Calretinin-negative cTMT-IR cells. Abbreviations: ml, molecular layer of the cerebellum; pl, Purkinje cell layer; gl, granule cell layer. Scale bar: 50 μm in all. Z-stack images (10 μm) are shown in (D-F, G-I).
Fig 10
Fig 10. Localization of cOpn3 protein in P10 thalamus (sagittal sections).
Expression of cOpn3 in the dorsomedial anterior nucleus (DMA) (A) and medial geniculate nucleus (MG) (C) of the thalamus. High magnification views of boxed areas in A and C are shown in B and D, respectively. Calbindin-IR neurons are present posterior to the MG (C). Z-stack images (7 μm for B, 4 μm for D). Abbreviations: DMA, dorsomedial anterior nuclei; DMP, dorsomedial posterior nuclei; MG, medial geniculate nuclei. Scale bars: 50μm.
Fig 11
Fig 11. Localization of cTMT protein in P10 anterior hypothalamus (coronal sections).
(A) Arrowheads show cTMT-IR neurons dorsal to tyrosine hydroxylase (TH)-IR neurons and lateral to the third ventricle (asterisk). (B) Highly magnified cTMT-L-IR neurons. (C) cTMT-IR neurons in the subgeniculate nucleus (SubG). (D) Highly magnified cTMT-IR neurons (arrowheads in C). Abbreviations: AH, anterior hypothalamic area; AM, nucleus anterior medialis hypothalami, Apir, amygdalo-piriform transition area; Co, optic chiasm; LH, lateral hypothalamic area; Lv, lateral ventricle; Pa, paraventricular nucleus; IIIv, third ventricle. Scale bar: 50 μm.

Similar articles

Cited by

References

    1. Terakita A. The opsins. Genome Biol. 2005;6(3):213 10.1186/gb-2005-6-3-213 - DOI - PMC - PubMed
    1. Do MT, Yau KW. Intrinsically photosensitive retinal ganglion cells. Physiol Rev. 2010;90(4):1547–1581. 10.1152/physrev.00013.2010 - DOI - PMC - PubMed
    1. Tomonari S, Migita K, Takagi A, Noji S, Ohuchi H. Expression patterns of the opsin 5-related genes in the developing chicken retina. Dev Dyn. 2008;237(7):1910–1922. 10.1002/dvdy.21611 - DOI - PubMed
    1. Nakane Y, Ikegami K, Ono H, Yamamoto N, Yoshida S, Hirunagi K, et al. A mammalian neural tissue opsin (Opsin 5) is a deep brain photoreceptor in birds. Proc Natl Acad Sci U S A. 2010;107(34):15264–15268. 10.1073/pnas.1006393107 - DOI - PMC - PubMed
    1. Yamashita T, Ohuchi H, Tomonari S, Ikeda K, Sakai K, Shichida Y. Opn5 is a UV-sensitive bistable pigment that couples with Gi subtype of G protein. Proc Natl Acad Sci U S A. 2010;107(51):22084–22089. 10.1073/pnas.1012498107 - DOI - PMC - PubMed

MeSH terms