. 2016 Nov 18;10(11):e0005144.
doi: 10.1371/journal.pntd.0005144. eCollection 2016 Nov.

Maternal Filarial Infection Influences the Development of Regulatory T Cells in Children from Infancy to Early Childhood

Affiliations

Maternal Filarial Infection Influences the Development of Regulatory T Cells in Children from Infancy to Early Childhood

Madhusmita Bal et al. PLoS Negl Trop Dis. .

Abstract

Background: Children born from filarial infected mothers are comparatively more susceptible to filarial infection than the children born to uninfected mothers. But the mechanism of such increased susceptibility to infection in early childhood is not exactly known. Several studies have shown the association of active filarial infection with T cell hypo-responsiveness which is mediated by regulatory T cells (Tregs). Since the Tregs develop in the thymus from CD4+ CD25hi thymocytes at an early stage of the human fetus, it can be hypothesized that the maternal infection during pregnancy affects the development of Tregs in children at birth as well as early childhood. Hence the present study was designed to test the hypothesis by selecting a cohort of pregnant mothers and children born to them subsequently in a filarial endemic area of Odisha, India.

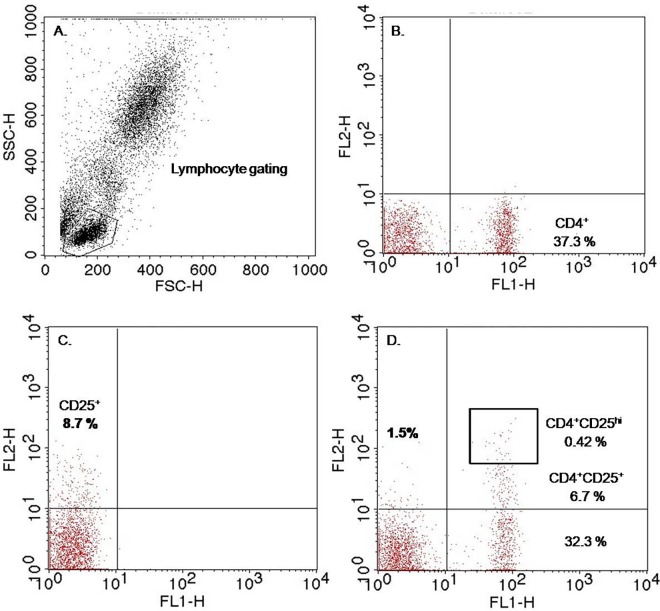
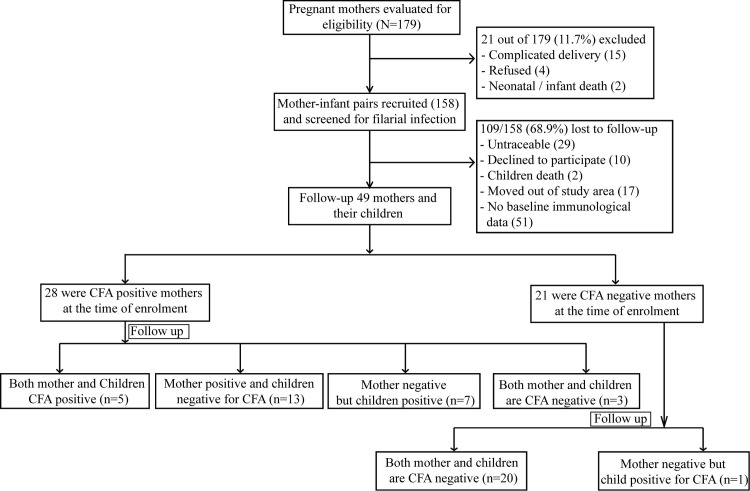
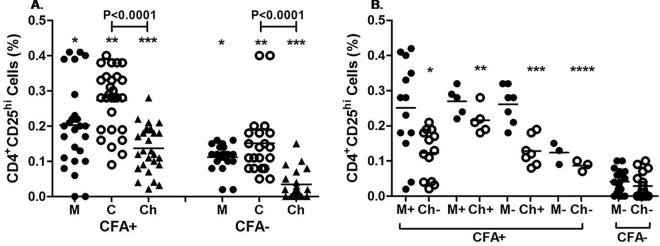
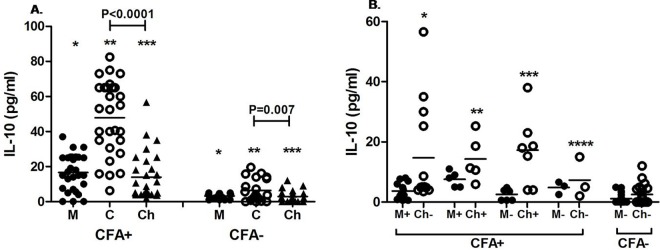
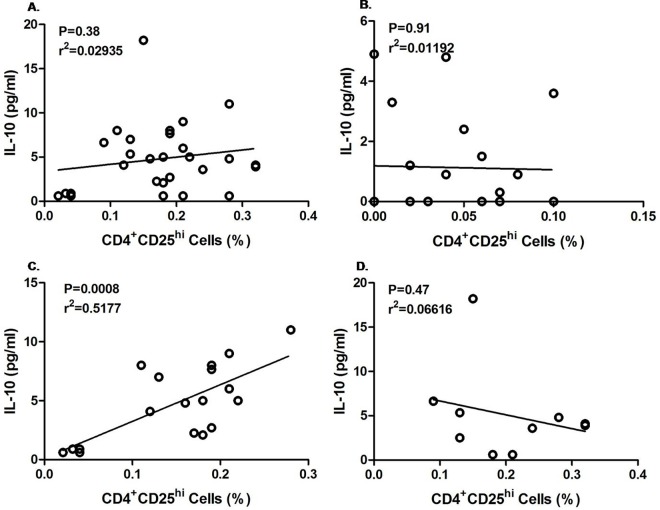
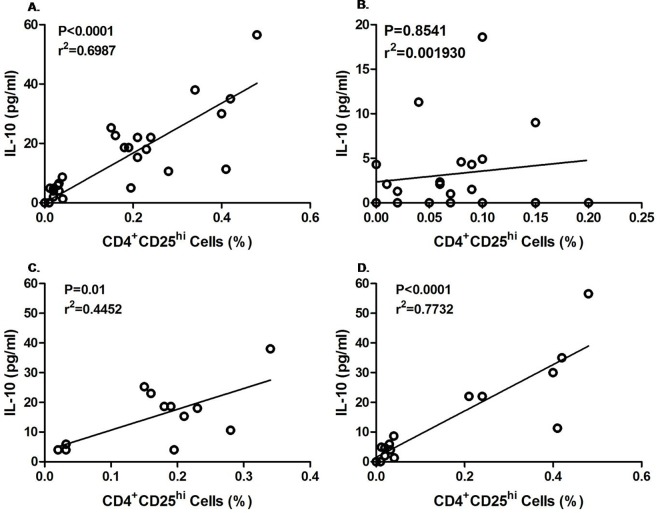
Methodology and principal finding: A total number of 49 pregnant mothers and children born to them subsequently have been followed up (mean duration 4.4 years) in an area where the microfilariae (Mf) rate has come down to <1% after institution of 10 rounds of annual mass drug administration (MDA). The infection status of mother, cord and children were assessed through detection of microfilariae (Mf) and circulating filarial antigen (CFA). Expression of Tregs cells were measured by flow cytometry. The levels of IL-10 were evaluated by using commercially available ELISA kit. A significantly high level of IL-10 and Tregs have been observed in children born to infected mother compared to children of uninfected mother at the time of birth as well as during early childhood. Moreover a positive correlation between Tregs and IL-10 has been observed among the children born to infected mother.

Significance: From these observations we predict that early priming of the fetal immune system by filarial antigens modulate the development of Tregs, which ultimately scale up the production of IL-10 in neonates and creates a milieu for high rate of acquisition of infection in children born to infected mothers. The mechanism of susceptibility and implication of the results in global elimination programme of filariasis has been discussed.


Conflict of interest statement

The authors have declared that no competing interests exist.

Figures

Fig 1
Fig 1. Gating strategy of regulatory T Cells (CD4 cells expressing High CD25 Marker, CD4+CD25hi).
CD4+ CD25hi cells were characterized by flow cytometry. Fig 1A represents a dot plot showing lymphocyte gating from the PBMC population based on forward and side scatter. Lymphocytes were analyzed by flow cytometry for CD4 and CD25 expression after staining with anti-human CD4-FITC and anti-human CD25-PE. The CD4+ T cells expressing the highest level of CD25+ are considered as T regulatory (Tregs) cells. % of Tregs frequencies (CD4+CD25hi) were calculated from total lymphocyte gated. Numbers in each quadrant represent the percentages of that cell type calculated from total lymphocyte gated. Lower right quadrant of Fig 1B represents CD4+cells, Upper left quadrant of Fig 1C- represents CD25+cells, Upper right quadrant of Fig 1D represents CD4 + CD25+ cells and Box represent CD4 cells expressing high levels of CD25 marker.
Fig 2
Fig 2. The flow diagram of the cohort study.
Fig 3
Fig 3. Expression profile of Tregs (CD4+CD25hi) cells in mother and cord at the time of enrollment and in children during follow-up.
Each dot represents an individual’s frequency of Tregs and lines represent the mean values. A. Treg frequency of CFA+ve (n = 28) and CFA-ve (n = 21) mother (M) and their cord (C) at the time of delivery and in children (Ch) during follow up. CFA +: mothers CFA +ve at the time of enrolment. CFA-: Mothers who were CFA-ve at the time of enrolment.* p = 0.016, **p<0.001, ***p<0.0001 B. Treg frequency of CFA+ve and CFA-ve mother and their children (Ch) at the time of follow up. M+Ch+: mother and children CFA+ve (n = 5), M+Ch-: mother CFA+ and children CFA-ve (n = 13), M-Ch+: mother CFA-ve and children CFA+ve (n = 7), M-Ch-: mother and children are CFA-ve (n = 3). M-Ch-: born from uninfected (CFA–ve) mother (n = 20).*p<0.0001, **p = 0.0008, ***p = 0.0003, ****P = 0.02 as compared to children (M-Ch-) of CFA–ve group.
Fig 4
Fig 4. Plasma level of IL-10 in CFA +ve and CFA-ve mothers and their children at the time of delivery and during follow-up.
Each dot represents an individual’s IL-10 level and lines represents the mean values. A. IL-10 level of CFA+ve (n = 28) and CFA-ve (n = 21) mother (M) and their cord (C) at the time of delivery and in children (Ch) during follow up. CFA +: mothers CFA +ve at the time of enrolment. CFA-: Mothers who were CFA-ve at the time of enrolment.* p<0.0001, **p<0.0001, ***p<0.0001. B. IL-10 levels in mother and their children at the time of follow up. M+Ch+: mother and children CFA+ve (n = 5), M+Ch-: mother CFA+ and children CFA-ve (n = 13), M-Ch+: mother CFA-ve and children CFA+ve (n = 7), M-Ch-: mother and children are CFA-ve (n = 3). M-Ch-: children born from uninfected (CFA–ve) mother (n = 20).*p = 0.001, **p = 0.002, ***p = 0.002, ****p = 0.03 as compared to children (M-Ch-) of CFA–ve group.
Fig 5
Fig 5. Correlation between Tregs (CD4+CD25hi) with IL-10 level in enrolled CFA+ve and CFA–ve mothers during follow up.
Each dot represents value from a single subject while the solid lines represent the regression lines. Values of p and r derive from Pearson’s correlation analysis. A. enrolled CFA+ve mothers (n = 28, p = 0.38, r2 = 0.029) and B. Enrolled CFA–ve mother (n = 21, p = 0.91, r2 = 0.012). C. Enrolled CFA +ve mothers who remained CFA+ve during follow up (n = 18, p = 0.008, r2 = 0.518). D. Enrolled CFA+ve mothers who became CFA-ve during follow up (n = 10, p = 0.47, r2 = 0.066)
Fig 6
Fig 6. The relationship between regulatory Tregs (CD4+CD25hi) with IL-10 level of children born to mother who were CFA +ve and CFA–ve at the time of enrolment.
Each dot represents value from a single subject while the solid lines represent the regression lines. Values of p and r derive from Pearson’s correlation analysis. (A) Children of enrolled CFA +ve mother (n = 28, p< 0.0001, r2 = 0.6987) (B) children of enrolled CFA-ve mother (n = 21, p = 0.8541, r2 = 0.001930).(C) CFA +ve children born to enrolled CFA+ve mother (n = 12,p = 0.01, r2 = 0.445) (D) CFA-ve children born to enrolled CFA+ve mother (n = 16, p<0.001, r2 = 0.7732).

References

    1. Rebollo MP, Bockarie MJ. Toward the elimination of lymphatic filariasis by 2020: treatment updates and impact assessment for the endgame. Expert Rev Anti Infect Ther.2013; 11: 723–31. 10.1586/14787210.2013.811841 - DOI - PubMed
    1. Bal MS, Mandal NN, Das MK, Kar SK, Sarangi SS, Beuria MK. Transplacental transfer of filarial antigens from Wuchereria bancrofti-infected mothers to their offspring. Parasitol. 2010; 137: 669–673. - PubMed
    1. Bal MS, Beuria MK, Mandal NN, Das MK. Antigenemia in young children living in Wuchereria bancrofti endemic areas of Orissa, India. Trans R Soc Trop Med Hyg. 2009; 103: 262–65. 10.1016/j.trstmh.2008.08.006 - DOI - PubMed
    1. Mandal NN, Bal MS, Das MK, Achary KG., Kar SK. Lymphatic filariasis in children: age dependent prevalence in an area of India endemic for Wuchereria bancrofti infection. Trop Biomed. 2010; 27(1): 41–46. - PubMed
    1. Yenny Djuardi Y, Supali T, Wibowo H, Kruize YCM, Versteeg SA, Ree RV, et al. The development of TH2 responses from infancy to 4 years of age and atopic sensitization in areas endemic for helminth infections. Allergy Asthma Clin Immunol. 2013, 9:13 Available 10.1186/1710-1492-9-13 - DOI - PMC - PubMed

Publication types