. 2016 Nov 18;11(11):e0166583.
doi: 10.1371/journal.pone.0166583. eCollection 2016.

Exploring Molecular Mechanisms of Paradoxical Activation in the BRAF Kinase Dimers: Atomistic Simulations of Conformational Dynamics and Modeling of Allosteric Communication Networks and Signaling Pathways

Affiliations

Exploring Molecular Mechanisms of Paradoxical Activation in the BRAF Kinase Dimers: Atomistic Simulations of Conformational Dynamics and Modeling of Allosteric Communication Networks and Signaling Pathways

Amanda Tse et al. PLoS One. .

Abstract

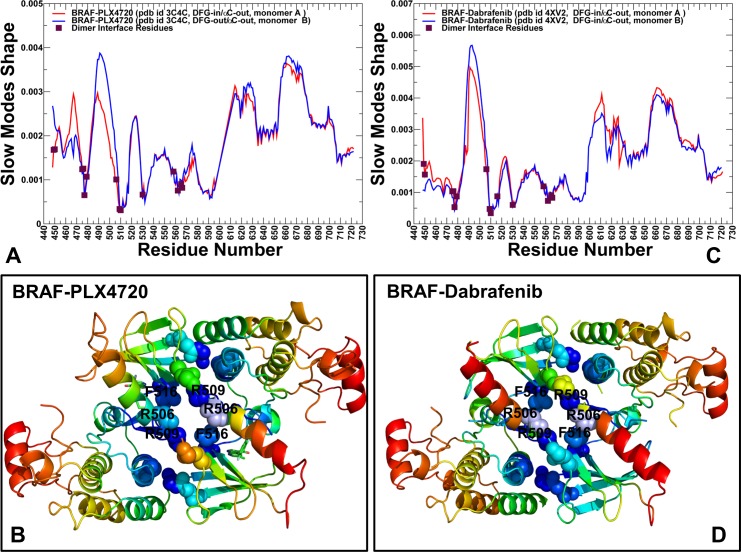
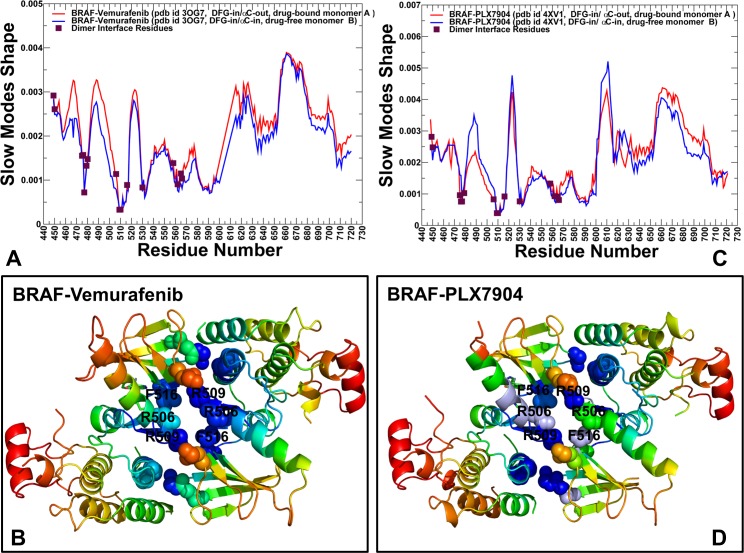
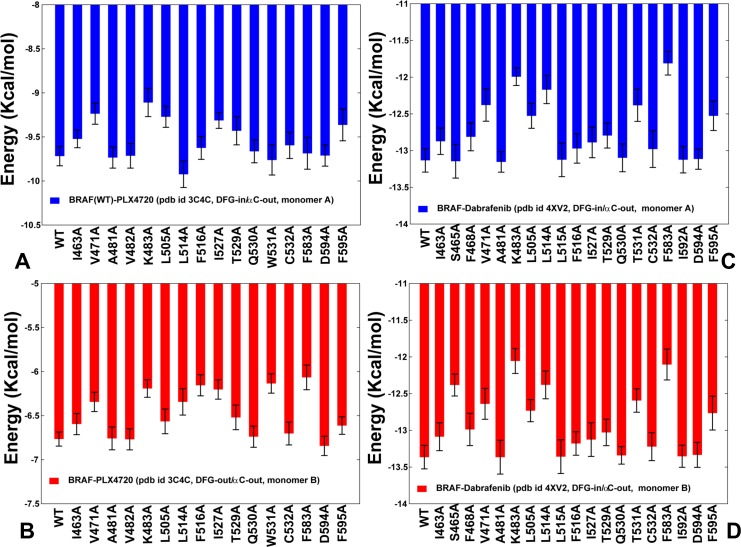
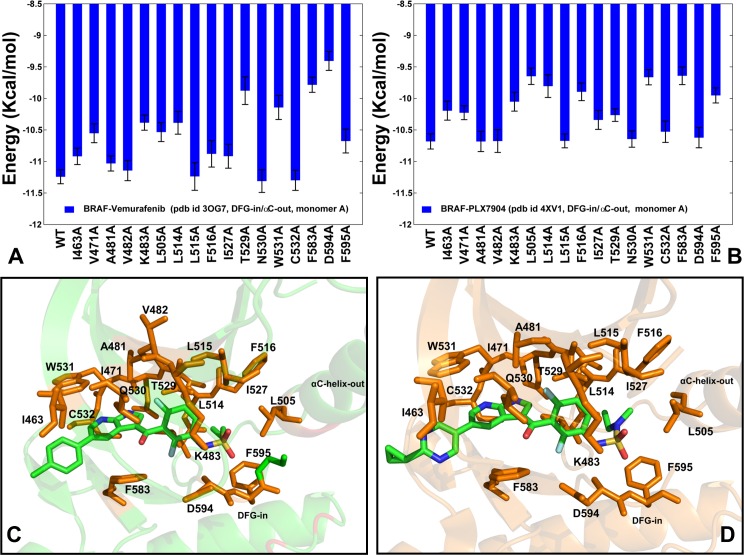
The recent studies have revealed that most BRAF inhibitors can paradoxically induce kinase activation by promoting dimerization and enzyme transactivation. Despite rapidly growing number of structural and functional studies about the BRAF dimer complexes, the molecular basis of paradoxical activation phenomenon is poorly understood and remains largely hypothetical. In this work, we have explored the relationships between inhibitor binding, protein dynamics and allosteric signaling in the BRAF dimers using a network-centric approach. Using this theoretical framework, we have combined molecular dynamics simulations with coevolutionary analysis and modeling of the residue interaction networks to determine molecular determinants of paradoxical activation. We have investigated functional effects produced by paradox inducer inhibitors PLX4720, Dabrafenib, Vemurafenib and a paradox breaker inhibitor PLX7904. Functional dynamics and binding free energy analyses of the BRAF dimer complexes have suggested that negative cooperativity effect and dimer-promoting potential of the inhibitors could be important drivers of paradoxical activation. We have introduced a protein structure network model in which coevolutionary residue dependencies and dynamic maps of residue correlations are integrated in the construction and analysis of the residue interaction networks. The results have shown that coevolutionary residues in the BRAF structures could assemble into independent structural modules and form a global interaction network that may promote dimerization. We have also found that BRAF inhibitors could modulate centrality and communication propensities of global mediating centers in the residue interaction networks. By simulating allosteric communication pathways in the BRAF structures, we have determined that paradox inducer and breaker inhibitors may activate specific signaling routes that correlate with the extent of paradoxical activation. While paradox inducer inhibitors may facilitate a rapid and efficient communication via an optimal single pathway, the paradox breaker may induce a broader ensemble of suboptimal and less efficient communication routes. The central finding of our study is that paradox breaker PLX7904 could mimic structural, dynamic and network features of the inactive BRAF-WT monomer that may be required for evading paradoxical activation. The results of this study rationalize the existing structure-functional experiments by offering a network-centric rationale of the paradoxical activation phenomenon. We argue that BRAF inhibitors that amplify dynamic features of the inactive BRAF-WT monomer and intervene with the allosteric interaction networks may serve as effective paradox breakers in cellular environment.


Conflict of interest statement

The authors have declared that no competing interests exist.

Figures

Fig 1
Fig 1. Structural Landscape of the BRAF Kinase Dimer Complexes with Small Molecule Inhibitors.
(A) Structural alignment of the crystal structures of the BRAF kinase dimers with type I inhibitors (DFG-in/αC-in kinase conformation) are shown in green (monomer A) and cyan (monomer B) and included pdb entries 2FB8, 3D4Q, 3PSB, 3PRF, 3PRI, 3PPK, 3PPJ, 3Q4C, 3PSD, 4E26, 4H58, 4MNF, and 3OMV. (B) The structures of BRAF complexes with type II inhibitors (DFG-out/αC-in kinase conformation) included pdb entries 1UWH, 1UWJ, 5V9C, 5CT7, 4KSP, 4KSQ, 4FC0, 4G9R, 4G9C, 4DBN, 3Q96, 3II5, 3IDP, and 4JVG. (C) The crystal structures of BRAF complexes with type I½ inhibitors (DFG-in/αC-out kinase conformation) included pdb entries 3C4C, 3OG7, 4FK3, 4EHG, 3SKC, 3TV4, 3TV6, 4E4X, 4EHE, 4MBJ, 4PP7, 4CQE, 4XV1, 4XV2, 4XV3, 4XV9. In this class of BRAF complexes, some crystal structures (pdb entries 3SKC, 3TV4, 3TV6, 4E4X, 4EHE, 4MBJ, 4PP7) have a small helical motif in the activation segment. (D) The superposition of the crystal structures of BRAF dime complexes with PLX4720 (pdb id 3C4C) (in green), Vemurafenib (pdb id 3OG7) (in red), PLX7904 (pdb id 4XV1) (in blue), and Dabrafenib (pdb id 4XV2, 5CSW) (in cyan). The regulatory regions are annotated and structural arrangements of the αC-helix and the DFG motif in BRAF complexes are highlighted.
Fig 2
Fig 2. Chemical Structures and Structural Binding Modes of the BRAF Inhibitors.
Chemical structures of studied BRAF inhibitors: (A) PLX4720, (B) Vemurafenib (B), PLX7904 (C) and Dabrafenib (D). (E) The binding modes of the BRAF inhibitors in the first binding site (monomer A). PLX4720 (in green), Vemurafenib (in red), PLX7904 (in blue), and Dabrafenib (in cyan). (F) The binding modes of the BRAF inhibitors in the second binding sites (monomer B). Among studied inhibitors, only PLX4720 (in green) and Dabrafenib (in cyan) bind to the second monomer. Note structural similarity of the inhibitor binding mode and DFG-in/αC-out kinase conformation in the first monomer, while alternative inhibitor binding modes and conformational variability in the second monomer.
Fig 3
Fig 3. Conformational Dynamics Profiles of the BRAF Structures.
Conformational dynamics profiles of the BRAF dimer complexes with PLX4720 (pdb id 3C4C) (A), Dabrafenib (pdb id 4XV2) (B), Vemurafenib (pdb id 3OG7) (C), and PLX7904 (pdb id 4XV1) (D). Conformational mobility profiles of the BRAF dimer complexes are plotted with the reference to the dynamics profile of the BRAF-WT monomeric structure (pdb id 4WO5). The computed B-factors are annotated and colored as follows: the BRAF-WT monomer (in green), the first monomer of the BRAF dimer (in red) and the second monomer of the BRAF dimer (in blue). The positions of the dimer interface residues (D449, W450, K475, W476, H477, D479, R506, R509, H510, F516, Q562, D565, and Y566) are shown on the dynamics profiles filled maroon circles.
Fig 4
Fig 4. The GNM-Based Essential Mobility Profiles of the BRAF Dimer Complexes with PLX4720 and Dabrafenib.
Collective dynamics of the BRAF dimers is analyzed using the cumulative contributions of the first five slowest GNM modes. Conformational mobility profiles and structural maps of collective motions are shown for the BRAF dimer complex with PLX4720 (pdb id 3C4C) (A, B) and Dabrafenib (pdb id 4XV2) (C, D). The slow mode shapes are annotated and colored in red (first monomer) and blue (second monomer). Structural maps of collective dynamics are based on fluctuations driven by the slowest five modes. The color gradient from red to blue indicates the increasing structural rigidity and refers to an average value over the backbone atoms in each residue.
Fig 5
Fig 5. The GNM-Based Essential Mobility Profiles of the BRAF Dimer Complexes with Vemurafenib and PLX7904.
Collective dynamics of the BRAF dimers is analyzed using the cumulative contributions of the first five slowest GNM modes. Conformational mobility profiles and structural maps of collective motions are shown for the BRAF dimer complex with Vemurafenib (pdb id 3OG7) (A,B) and PLX7904 (pdb id 4XV1) (C,D). The slow mode shapes are annotated and colored in red (first monomer) and blue (second monomer). Structural maps of collective dynamics are based on fluctuations driven by the slowest five modes.
Fig 6
Fig 6. Binding Free Energy Calculations of the BRAF Dimer Complexes with PLX4720 and Dabrafenib.
Binding free energies and alanine scanning of the binding site residues in the first and second binding sites of the PLX4720-BRAF complex (A,B) and Dabrafenib-BRAF complex (C,D). The standard errors of binding free energy differences, which are the standard deviation of the mean values, were ~ 0.11–0.25 kcal/mol for the PLX4720-BRAF complex and 0.18–0.22 kcal/mol for the Dabrafenib-BRAF complex. The results of alanine scanning are shown in blue bars for the first binding site (A, C) and in red bars for the second binding site (B, D).
Fig 7
Fig 7. Binding Free Energy Calculations of the BRAF Dimer Complexes with Vemurafenib and PLX7904.
Binding free energies and alanine scanning of the binding site residues in the drug-bound monomer of the Vemurafenib-BRAF complex (A) and the PLX7904-BRAF complex (B). The standard errors of binding free energy differences, which are the standard deviation of the mean values, were ~ 0.15–0.25 kcal/mol for the Vemurafenib-BRAF complex and 0.2–0.3 kcal/mol for the PLX7904-BRAF complex. A close-up of the Vemurafenib binding mode (C) and PLX7904 binding mode (D). The inhibitor is shown in atom-colored sticks and annotated. The binding site residues are shown in orange sticks and annotated.
Fig 8
Fig 8. Coevolutionary Dependencies of the BRAF Kinase Residues.
Sequence conservation and coevolutionary propensities of the BRAF residues. (A) The KL conservation score. The residue numbering in the sequence conservation profile corresponds to the residue numbering in the BRAF crystal structures. (B) The cMI profile measures cumulative accumulation of mutual information per residue. The residue profiles are shown in blue bars. The inter-domain interface residues are shown in red circles. The R-spine residues are highlighted in green squares. (C) Structural mapping of high cMI residues (in blue spheres) onto the crystal structure of the Vemurafenib-BRAF complex (pdb id 3OG7). These residues included V471, A481, L515, F516, W531, L537, H574, L577, K578, S579, F583, L584, F595, W619, M620, D638, Y640, F642, and I644. The first monomer is shown in green ribbons and the second monomer is shown in cyan ribbons. (D) Structural mapping of the protein sectors of coevolving residues is shown in both monomers. The binding site sector residues Q530, W531, C532, F583, and S536 are shown in orange spheres; the regulatory sector residues R506, F516, I572, H574, H568, and F595 are shown in red spheres and the dimerization sector residues D449, W450, E451, L505, R509, L514, and F516 are shown in blue spheres.
Fig 9
Fig 9. Proximity-based Coevolutionary Profiles of the BRAF Dimer Complexes.
The ensemble-based pMI profiles of the BR AF complexes with PLX4720 (A), Dabrafenib (B), Vemurafenib (C), and PLX7904 (D). pMI values for each residue position are evaluated as the sum of cMI values of all residues within 5Å distance from a given residue. The distance between each pair of residues in the structure was calculated as the shortest distance between any two non-hydrogen atoms from respective two residues. pMI profiles are computed using average values obtained from MD trajectories and ensemble-based definition of the local residue environment. The residue profiles are shown in blue bars. The inter-domain interface residues are shown in red circles. The R-spine residues are highlighted in green squares.
Fig 10
Fig 10. Residue-Based Centrality Profiles in the BRAF Structures.
The residue centrality profiles of the BRAF dimer complexes with PLX4720 (pdb id 3C4C) (A), Dabrafenib (pdb id 4XV2) (B), Vemurafenib (pdb id 3OG7) (C), and PLX7904 (pdb id 4XV1) (D). The distribution for the BRAF-WT (in green) is shown for comparison on all panels. The centrality profiles for the first monomer are shown in red lines with filled red squares and for the second monomer in blue lines with filled blue circles. The centralities of the R-spine residues in the drug-bound monomer are highlighted as filled maroon squares.
Fig 11
Fig 11. Allosteric Communication Propensities in the BRAF Structures.
The residue-based CP profiles of the BRAF complexes with PLX4720 (A), Dabrafenib (B), Vemurafenib (C) and PLX7904 (D). The profiles for the first monomer are shown in red lines with filled red squares and for the second monomer in blue lines with filled blue circles. The R-spine residues are highlighted as filled maroon squares.
Fig 12
Fig 12. Structural Map of Allosteric Communication Pathways in the BRAF Dimer Complexes.
The most probable communication pathways in the PLX4720-BRAF complex (pdb id 3C4C) (A), Dabrafenib-BRAF complex (pdb id 4XV2) (B), Vemurafenib-BRAF complex (pdb id 3OG7) (C), and PLX7904-BRAF complex (pdb id 4XV1) (D). The BRAF structures are shown in ribbons, with the monomer A in orange and monomer B in cyan. The key residues along the communication routes are annotated and shown in green spheres. The error bars on the pathway occupancies are within 5%.

Similar articles

Cited by

References

    1. Huse M, Kuriyan J. The conformational plasticity of protein kinases. Cell. 2002;109: 275–282. - PubMed
    1. Nolen B, Taylor S, Ghosh G. Regulation of protein kinases; controlling activity through activation segment conformation. Mol Cell. 2004;;15: 661–675. - PubMed
    1. Taylor SS, Kornev AP. Protein kinases: evolution of dynamic regulatory proteins. Trends Biochem Sci. 2011;;36: 65–77. - PMC - PubMed
    1. Endicott JA, Noble ME, Johnson LN. The structural basis for control of eukaryotic protein kinases. Annu Rev Biochem. 2012;;81: 587–613. - PubMed
    1. Taylor SS, Keshwani MM, Steichen JM, Kornev AP. Evolution of the eukaryotic protein kinases as dynamic molecular switches. Philos Trans R Soc Lond B Biol Sci. 2012;;367: 2517–2528. - PMC - PubMed