. 2016 Nov 18;11(11):e0166974.
doi: 10.1371/journal.pone.0166974. eCollection 2016.

Long-Range Control of Renin Gene Expression in Tsukuba Hypertensive Mice

Affiliations

Long-Range Control of Renin Gene Expression in Tsukuba Hypertensive Mice

Aki Ushiki et al. PLoS One. .

Abstract

Renin, a rate-limiting enzyme in the renin-angiotensin system, is regulated to maintain blood pressure homeostasis: renin gene expression in the kidney is suppressed in a hypertensive environment. We found that expression of a 15-kb human RENIN (hREN) transgene was aberrantly upregulated (>4.2-fold), while the endogenous mouse renin (mRen) gene was suppressed (>1.7-fold) in Tsukuba hypertensive mice (THM), a model for genetically induced hypertension. We then generated transgenic mice using a 13-kb mRen gene fragment that was homologous to the 15-kb hREN transgene and found that its expression was also upregulated (>3.1-fold) in THM, suggesting that putative silencing elements of the renin genes were distally located in the loci. We next examined the possible role of a previously identified mouse distal enhancer (mdE) located outside of the 13-kb mRen gene fragment. Deletion of the mdE in the context of a 156-kb mRen transgene did not affect its transcriptional repression in THM, implying that although the silencing element of the mRen gene is located within the 156-kb fragment tested, it is distinct from the mdE. Consistent with these results, deletion of the 63-kb region upstream of the mdE from the endogenous mRen gene locus abrogated its transcriptional repression in THM. We finally tested whether dysregulation of the short renin transgenes also occurred in the fetal or neonatal kidneys of THM and found that their expression was not aberrantly upregulated, demonstrating that aberrant regulation of short renin transgenes commences sometime between neonate and adult periods.


Conflict of interest statement

The authors have declared that no competing interests exist.

Figures
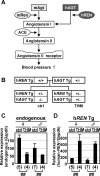
Fig 1
Fig 1. Expression of endogenous mouse Renin and human RENIN transgenes in THM.
(A) Schematic representation of chimeric renin-angiotensin system in Tsukuba hypertensive mice. mRen, mouse Renin; mAgt, mouse Angiotensinogen; hREN, human RENIN; hAGT, human ANGIOTENSINOGEN; ACE, Angiotensin-converting enzyme. (B) Breeding strategy for obtaining normotensive (control; ctrl) and hypertensive mice (Tsukuba hypertensive mice; THM). hREN, human RENIN; hAGT, human ANGIOTENSINOGEN; Tg, Transgene. (C and D) Total RNA was isolated from the kidney of normotensive (ctrl) or hypertensive (THM) TgM (8-week old). Levels of endogenous mouse Ren (endogenous; C) or human transgenic REN (hREN Tg; D) gene expression were analyzed by qRT-PCR. Each value represents the ratio of endogenous mRen or hREN Tg gene expression to that of Gapdh. The expression value of male control animals in each group was arbitrarily set at 100. qPCR analyses were repeated three times. Number of animals analyzed is shown in parentheses below each panel and mean ± SD are shown. Statistically significant differences between the control animals and THM were determined using an unpaired t-test (##, P < 0.01).
Fig 2
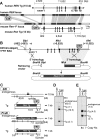
Fig 2. Generation of mouse renin transgenic mice.
(A) Homology comparison of the human and mouse Ren gene loci determined by the Ensembl genome browser (http://www.ensembl.org, [29]). Conserved regions are indicated by shaded lines. Human RENIN (top, 15 kb) and mouse renin (bottom, 13 kb) Tg fragments used for microinjection are shown with their exon–intron organization. Lengths of the gene body, and the 5' and 3' flanking regions are shown in bp. (B) The RPCI23-240p23+FRT BAC carries the mouse Ren gene locus with the FRT sequences inserted at the 3'-untranslated region of the gene (top, [14]). Restriction enzyme sites with their positions relative to the transcriptional start site (+1) are shown. The 5' (nucleotides −962 to −683 relative to the transcription start site) and 3' (nt +5,525 to +11,552) homology fragments were prepared by PCR amplification and restriction enzyme digestion (MluI/AfeI), respectively, of the BAC clone and subcloned into the retrieving vector (middle). Following the retrieving reaction (bottom), the BssHII fragment was released and used for microinjection. Gene body and flanking regions are shown as solid and open rectangles, respectively. (C) Partial restriction enzyme map of the mouse endogenous and Tg Ren gene loci. Knock-in of the FRT sequences (gray rectangle) generated artificial SfiI and PvuII sites in the Tg locus, which were used to discriminate the endogenous and Tg loci. The positions of restriction enzyme sites and expected restriction enzyme fragments with their sizes are shown beneath each map (top SfiI, bottom PvuII). The probe used for Southern blot analysis in D and E is indicated by a gray rectangle. (D and E) DNAs from thymic cells of non-Tg and Tg animals were digested with SfiI (D) or PvuII (E) in agarose plugs, separated by electrophoresis, and hybridized to the probe shown in C. On the right of each panel are expected bands with their sizes (in kb). A partial digestion product is marked by an asterisk. Signal intensities of the bands in (E) were quantified by phosphorimager, and the Tg copy numbers were estimated by calculating Tg/endogenous. ratios (beneath the panel). Tg, transgene. Lines in D and E indicate that lanes were run on the same gel but were noncontiguous.
Fig 3
Fig 3. Ren gene expression in TgM.
(A) Northern blot analysis of the TgM. Total RNA samples (20 μg) from the kidney of non-Tg and Tg animals (8-week old) were electrophoresed on a 1.2% agarose gel and subjected to Northern blot analysis with the mouse Ren (top) and Gapdh (middle) probes. The KpnI/NcoI fragment (exons 3–9) from the mouse Ren-1C cDNA was used for simultaneous expression analysis of the endogenous and Tg Ren genes. Ethidium bromide staining of the gel is shown at the bottom (the positions of 28S and 18S rRNA are indicated). Lines indicate that lanes were run on the same gel but were noncontiguous. (B) Sequences of the mouse Ren Tg (Ren+FRT). Hatched region is the FRT sequence. Positions of primers used for qRT-PCR in C are underlined. (C) Expression levels of the mouse Ren Tg were analyzed by qRT-PCR. Each value represents the ratio of mRen Tg expression to that of Gapdh. Each sample was analyzed at least three times, and mean ± SD are shown.
Fig 4
Fig 4. Expression of the mouse Ren Tg in THM.
(A) Breeding strategy for introducing mouse Ren Tg (mRen Tg) into normotensive (ctrl) or hypertensive (THM) mice. (B-G) Total RNA was isolated from the kidney of normotensive (ctrl) or hypertensive (THM) animals (8-week old) and subjected to qRT-PCR analyses. Expression levels of mouse Ren Tg (mRen Tg; lines 244 and 179 in B and C, respectively), endogenous Ren (endogenous, D and E), human REN Tg (hREN Tg; F and G), and Gapdh (data not shown) were determined. Each value represents the ratio of mRen Tg, endogenous, or hREN Tg expression to that of Gapdh. Expression value of male control animals in each group was arbitrarily set at 100. qPCR analyses were repeated twice. Number of animals analyzed is shown in parentheses below each panel and mean ± SD are shown. Statistically significant differences between ctrl and THM were determined using an unpaired t-test (#, P < 0.05; ##, P < 0.01).
Fig 5
Fig 5. Expression of the mouse Ren BAC Tg in THM.
(A) Breeding strategy for introducing the mouse Ren BAC Tg (mdE wild-type, wt, or mutant, mut) into normotensive (ctrl) or hypertensive (THM) mice. (BD) Total RNA was isolated from the kidney of normotensive or hypertensive animals (8-week old) and subjected to qRT-PCR analyses. Expression levels of mouse Ren BAC Tg (BAC-Tg; B), endogenous Ren (endogenous; C), human REN Tg (hREN Tg; D), and Gapdh (data not shown) were determined. Each value represents the ratio of BAC-Tg, endogenous, or hREN Tg expression to that of Gapdh. Expression value of wt control animals in each group was arbitrarily set at 100. Number of animals analyzed is shown in parentheses below each panel and mean ± SD are shown. Statistically significant differences between ctrl and THM were determined using an unpaired t-test (#, P < 0.05; ##, P < 0.01).
Fig 6
Fig 6. Generation of endogenous mouse renin mutant alleles by genome editing.
(A) Schematic representation of the 156-kb mRen Tg, endogenous 5'-large-del and endogenous pseudo-WT alleles. Positions of mdE and FRT sequences are indicated by gray rectangles. (B) Partial restriction enzyme maps of the mouse endogenous WT and mutant alleles. The Cas9 target sites for generating 5'-large-del and pseudo-WT alleles are shown by solid and open arrowheads, respectively. Targeting at two upstream sites removes 63-kb sequence from the 5'-upstream region of mRen gene, generating a 2.4-kb EcoRV restriction fragment in the mutant allele. Knock-in of the FRT sequence at a downstream site introduces artificial PvuII site, generating 4.0- and 3.6-kb PvuII restriction fragments in the mutant allele. Probes used for Southern blot analysis in C are indicated by gray rectangles. (C) DNAs of WT and mutant animals were digested with EcoRV or PvuII, separated by electrophoresis, and hybridized to the probes shown in B. Shown on the right of each panel are expected bands with their sizes (in kb). (D) Sequence alignment of WT (reference) and 5'-large-del alleles confirmed the 63-kb sequence deletion in the 5'-large-del allele of mRen gene. PAM and g(uide)RNA sequences are shaded and underlined, respectively. Cleavage sites predicted from PAM locations are indicated by arrowheads.
Fig 7
Fig 7. mRen gene expression in the 5'-large-del mutant allele.
(A) Expression of mRen gene in the 5'-large-del mutant allele was analyzed in normotensive (ctrl) and hypertensive (THM) mouse environments. (BD) Total RNA was isolated from the kidney of normotensive or hypertensive animals (8-week old) and subjected to qRT-PCR analyses. Expression levels of endogenous 5'-large-del mREN (B), endogenous pseudo-WT mREN (C), hREN Tg (D), and Gapdh (data not shown) were determined. Each value represents the ratio of renin genes expression to that of Gapdh and mean ± SD is shown. Values of male control animals in each group was arbitrarily set at 100. Number of animals analyzed is shown in parentheses below each panel. Statistically significant differences between ctrl and THM were determined using an unpaired t-test (N.S., not significant; #, P < 0.05; ##, P < 0.01).
Fig 8
Fig 8. Renin genes expression in the fetal and neonatal kidney of THM.
(AF) Total RNA was isolated from the kidney of 17.5-dpc mRen TgM carrying either hREN Tg alone (control) or both hREN and hAGT genes (THM) and subjected to qRT-PCR analyses. Expression levels of mouse Ren Tg (mRen Tg; lines 244 and 179 in A and B, respectively), endogenous Ren (endogenous; C and D), human REN Tg (hREN; E and F), and Gapdh (data not shown) were determined. (GH) Total RNA was isolated from the kidney of neonatal (one-day-old) TgM carrying either hREN Tg alone (control) or both hREN and hAGT genes (THM) and subjected to qRT-PCR analyses. Expression levels of endogenous mRen gene (endogenous; G), human REN Tg (hREN; H), and Gapdh (data not shown) were determined. Each value represents the ratio of endogenous or hREN Tg expression to that of Gapdh. Expression value of male control animals in each group was arbitrarily set at 100. qPCR analyses were repeated twice. Number of animals analyzed is shown in parentheses below each panel and mean ± SD are shown. Statistically significant differences between ctrl and THM were determined using an unpaired t-test (N.S., not significant; ##, P < 0.01).

Similar articles

Cited by

References

    1. Bader M, Ganten D. Regulation of renin: new evidence from cultured cells and genetically modified mice. J Mol Med (Berl). 2000;78(3):130–9. Epub 2000/06/27. . - PubMed
    1. Tanimoto K, Sugiyama F, Goto Y, Ishida J, Takimoto E, Yagami K, et al. Angiotensinogen-deficient mice with hypotension. J Biol Chem. 1994;269(50):31334–7. Epub 1994/12/16. . - PubMed
    1. Thompson MW, Smith SB, Sigmund CD. Regulation of human renin mRNA expression and protein release in transgenic mice. Hypertension. 1996;28(2):290–6. Epub 1996/08/01. . - PubMed
    1. Keen HL, Sigmund CD. Paradoxical regulation of short promoter human renin transgene by angiotensin ii. Hypertension. 2001;37(2 Pt 2):403–7. Epub 2001/03/07. . - PubMed
    1. Castrop H, Hocherl K, Kurtz A, Schweda F, Todorov V, Wagner C. Physiology of kidney renin. Physiol Rev. 2010;90(2):607–73. Epub 2010/04/16. doi: 90/2/607 [pii] 10.1152/physrev.00011.2009 . - DOI - PubMed