

Correlation of FDG-PET hypometabolism and SEEG epileptogenicity mapping in patients with drug-resistant focal epilepsy
- PMID: 27861778
- PMCID: PMC5214566
- DOI: 10.1111/epi.13592
Correlation of FDG-PET hypometabolism and SEEG epileptogenicity mapping in patients with drug-resistant focal epilepsy
Abstract
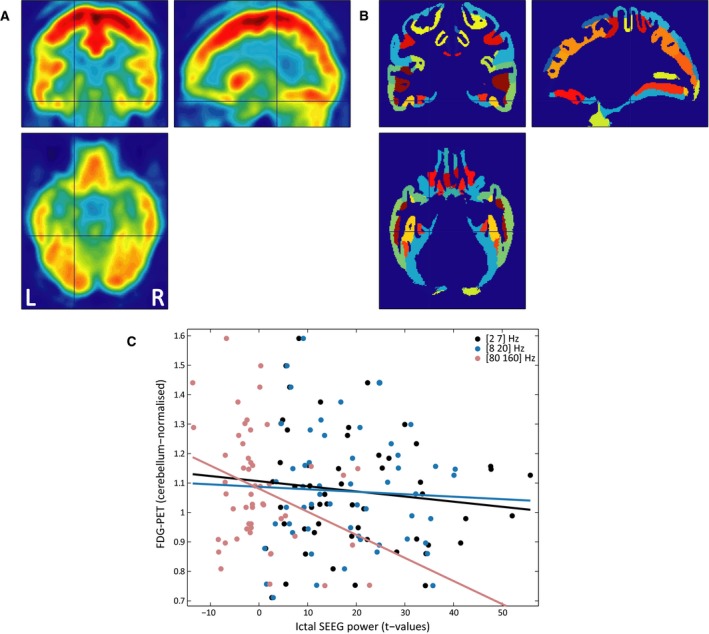
Objective: Interictal [18F]fluorodeoxyglucose-positron emission tomography (FDG-PET) is used in the presurgical evaluation of patients with drug-resistant focal epilepsy. We aimed at clarifying its relationships with ictal high-frequency oscillations (iHFOs) shown to be a relevant marker of the seizure-onset zone.
Methods: We studied the correlation between FDG-PET and epileptogenicity maps in an unselected series of 37 successive patients having been explored with stereo-electroencephalography (SEEG).
Results: At the group level, we found a significant correlation between iHFOs and FDG-PET interictal hypometabolism only in cases of temporal lobe epilepsy. This correlation was found with HFOs, and the same comparison between FDG-PET and ictal SEEG power of lower frequencies during the same epochs did not show the same significance.
Significance: This finding suggests that interictal FDG-PET and ictal HFOs may share common underlying pathophysiologic mechanisms of ictogenesis in temporal lobe epilepsy, and combining both features may help to identify the seizure-onset zone.
Keywords: SEEG; Epileptogenicity map; FDG-PET; Focal epilepsy; Ictal HFO.
© 2016 The Authors. Epilepsia published by Wiley Periodicals, Inc. on behalf of International League Against Epilepsy.
Figures


References
-
- Rosenow F, Lüders H. Presurgical evaluation of epilepsy. Brain 2001;124:1683–1700. - PubMed
-
- Swartz BE, Halgren E, Delgado‐Escueta AV, et al. Neuroimaging in patients with seizures of probable frontal lobe origin. Epilepsia 1989;30:547–558. - PubMed
-
- Henry TR, Sutherling WW, Engel J, et al. Interictal cerebral metabolism in partial epilepsies of neocortical origin. Epilepsy Res 1991;10:174–182. - PubMed
-
- Drzezga A, Arnold S, Minoshima S, et al. 18F‐FDG PET studies in patients with extratemporal and temporal epilepsy: evaluation of an observer‐independent analysis. J Nucl Med 1999;40:737–746. - PubMed
Publication types
MeSH terms
Substances
LinkOut - more resources
Full Text Sources
Other Literature Sources
