

Phenotypically resembling myeloid derived suppressor cells are increased in children with HIV and exposed/infected with Mycobacterium tuberculosis
- PMID: 27861788
- PMCID: PMC5233566
- DOI: 10.1002/eji.201646658
Phenotypically resembling myeloid derived suppressor cells are increased in children with HIV and exposed/infected with Mycobacterium tuberculosis
Abstract
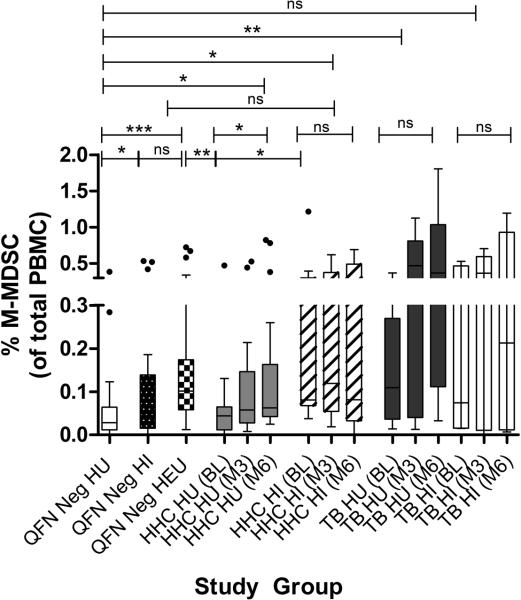
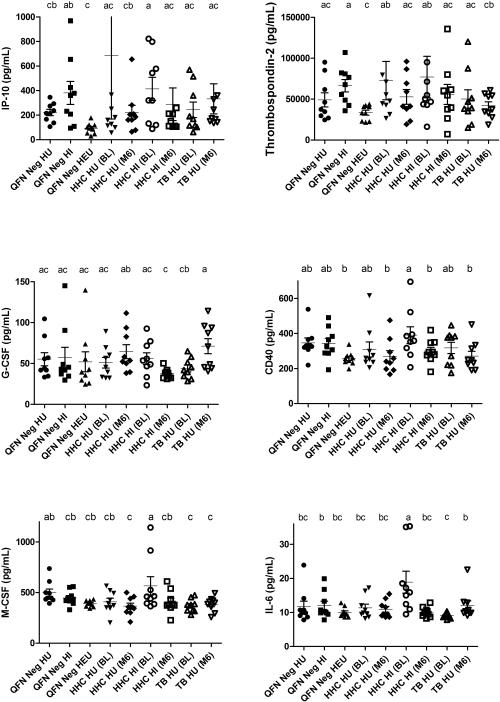
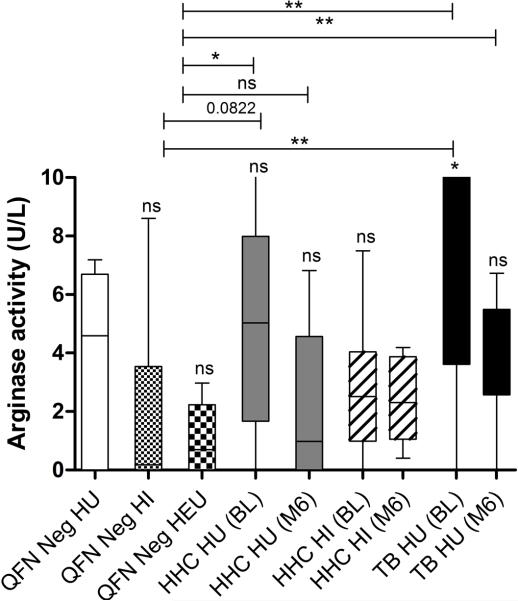
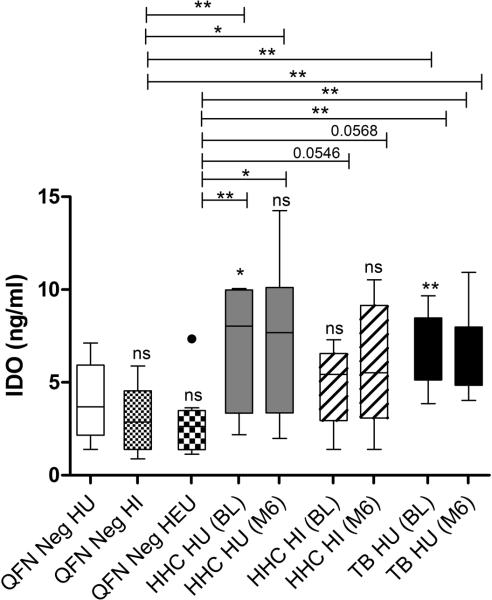
Increased disease susceptibility during early life has been linked to immune immaturity, regulatory T-cell/TH2 immune biasing and hyporesponsiveness. The contribution of myeloid derived suppressor cells (MDSCs) remains uninvestigated. Here, we assessed peripheral MDSC in HIV-infected and -uninfected children with tuberculosis (TB) disease before, during and after TB treatment, along with matched household contacts (HHCs), HIV-exposed, -infected and -uninfected children without recent TB exposure. Serum analytes and enzymes associated with MDSC accumulation/activation/function were measured by colorimetric- and fluorescence arrays. Peripheral frequencies of cells phenotypically resembling MDSCs were significantly increased in HIV-exposed uninfected (HEU) and M.tb-infected children, but peaked in children with TB disease and remained high following treatment. MDSC in HIV-infected (HI) children were similar to unexposed uninfected controls; however, HAART-mediated MDSC restoration to control levels could not be disregarded. Increased MDSC frequencies in HHC coincided with enhanced indoleamine-pyrrole-2,3-dioxygenase (IDO), whereas increased MDSC in TB cases were linked to heightened IDO and arginase-1. Increased MDSC were paralleled by reduced plasma IP-10 and thrombospondin-2 levels in HEU and significantly increased plasma IL-6 in HI HHC. Current investigations into MDSC-targeted treatment strategies, together with functional analyses of MDSCs, could endorse these cells as novel innate immune regulatory mechanism of infant HIV/TB susceptibility.
Keywords: Children; Early life immunity; HIV exposure; Myeloid derived suppressor cells (MDSCs); Tuberculosis.
© 2016 WILEY-VCH Verlag GmbH & Co. KGaA, Weinheim.
Figures

Similar articles
-
Monocytic-Myeloid Derived Suppressor Cells of HIV-Infected Individuals With Viral Suppression Exhibit Suppressed Innate Immunity to Mycobacterium tuberculosis.Front Immunol. 2021 Apr 28;12:647019. doi: 10.3389/fimmu.2021.647019. eCollection 2021. Front Immunol. 2021. PMID: 33995365 Free PMC article.
-
Monocytic myeloid-derived suppressor cells reflect tuberculosis severity and are influenced by cyclooxygenase-2 inhibitors.J Leukoc Biol. 2021 Jul;110(1):177-186. doi: 10.1002/JLB.4A0720-409RR. Epub 2020 Nov 6. J Leukoc Biol. 2021. PMID: 33155730 Free PMC article.
-
Myeloid-Derived Suppressor Cells Mediate T Cell Dysfunction in Nonhuman Primate TB Granulomas.mBio. 2021 Dec 21;12(6):e0318921. doi: 10.1128/mbio.03189-21. Epub 2021 Dec 14. mBio. 2021. PMID: 34903057 Free PMC article.
-
The Emerging Role of Myeloid-Derived Suppressor Cells in Tuberculosis.Front Immunol. 2019 Apr 30;10:917. doi: 10.3389/fimmu.2019.00917. eCollection 2019. Front Immunol. 2019. PMID: 31114578 Free PMC article. Review.
-
Mycobacterium tuberculosis and myeloid-derived suppressor cells: Insights into caveolin rich lipid rafts.EBioMedicine. 2020 Mar;53:102670. doi: 10.1016/j.ebiom.2020.102670. Epub 2020 Feb 26. EBioMedicine. 2020. PMID: 32113158 Free PMC article. Review.
Cited by
-
Heat-killed Mycobacterium tuberculosis prime-boost vaccination induces myeloid-derived suppressor cells with spleen dendritic cell-killing capability.JCI Insight. 2019 Jun 4;5(13):e128664. doi: 10.1172/jci.insight.128664. JCI Insight. 2019. PMID: 31162143 Free PMC article.
-
Friends and foes of tuberculosis: modulation of protective immunity.J Intern Med. 2018 May 27:10.1111/joim.12778. doi: 10.1111/joim.12778. Online ahead of print. J Intern Med. 2018. PMID: 29804292 Free PMC article.
-
MDSC expansion during HIV infection: regulators, ART and immune reconstitution.Genes Immun. 2024 Jun;25(3):242-253. doi: 10.1038/s41435-024-00272-9. Epub 2024 Apr 11. Genes Immun. 2024. PMID: 38605259 Review.
-
Monocytic-Myeloid Derived Suppressor Cells of HIV-Infected Individuals With Viral Suppression Exhibit Suppressed Innate Immunity to Mycobacterium tuberculosis.Front Immunol. 2021 Apr 28;12:647019. doi: 10.3389/fimmu.2021.647019. eCollection 2021. Front Immunol. 2021. PMID: 33995365 Free PMC article.
-
Human Monocytic Suppressive Cells Promote Replication of Mycobacterium tuberculosis and Alter Stability of in vitro Generated Granulomas.Front Immunol. 2018 Oct 23;9:2417. doi: 10.3389/fimmu.2018.02417. eCollection 2018. Front Immunol. 2018. PMID: 30405617 Free PMC article.
References
-
- Danzhen Y, Wardlaw T, Jin Rou N. Estimates Developed by the UN Inter-agency Group for Child Mortality Estimation. The Inter-agency Group for Child Mortality Estimation (IGME); 2012. Levels & Trends in Child Mortality. Report 2012.
-
- Vakili R, Emami Moghadam Z, Khademi G, Vakili S, Saeidi M. Child Mortality at Different World Regions: A Comparison Review. Int J Pediatr. 2015 Aug 1;3(4.2):809–16.
-
- Black RE, Cousens S, Johnson HL, Lawn JE, Rudan I, Bassani DG, Jha P, et al. Global, regional, and national causes of child mortality in 2008: a systematic analysis. The Lancet. 2010 Jun 11;375(9730):1969–87. - PubMed
-
- Prescott SL, Macaubas C, Holt BJ, Smallacombe TB, Loh R, Sly PD, Holt PG. Transplacental Priming of the Human Immune System to Environmental Allergens: Universal Skewing of Initial T Cell Responses Toward the Th2 Cytokine Profile. J Immunol. 1998 May 15;160(10):4730–7. - PubMed
Publication types
MeSH terms
Substances
Grants and funding
LinkOut - more resources
Full Text Sources
Other Literature Sources
Medical
Research Materials
