. 2017 Mar 1;595(5):1497-1513.
doi: 10.1113/JP273327. Epub 2016 Dec 29.

Differences in TRPC3 and TRPC6 channels assembly in mesenteric vascular smooth muscle cells in essential hypertension

Affiliations

Differences in TRPC3 and TRPC6 channels assembly in mesenteric vascular smooth muscle cells in essential hypertension

Inés Álvarez-Miguel et al. J Physiol. .

Abstract

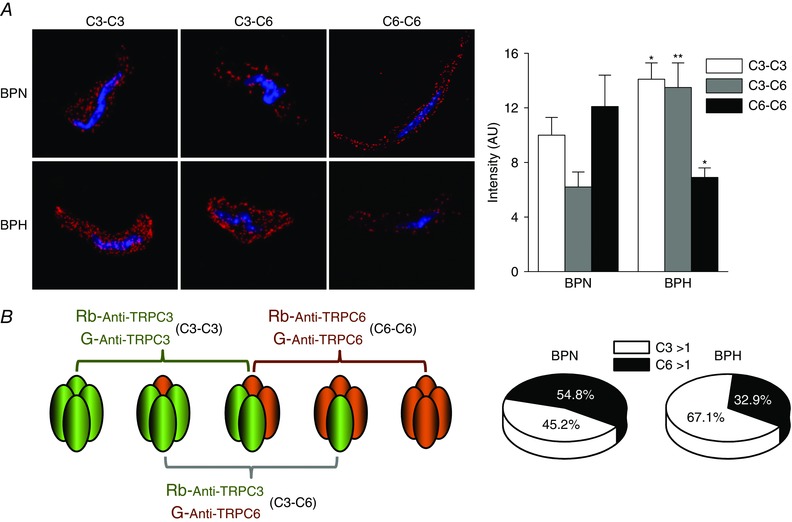
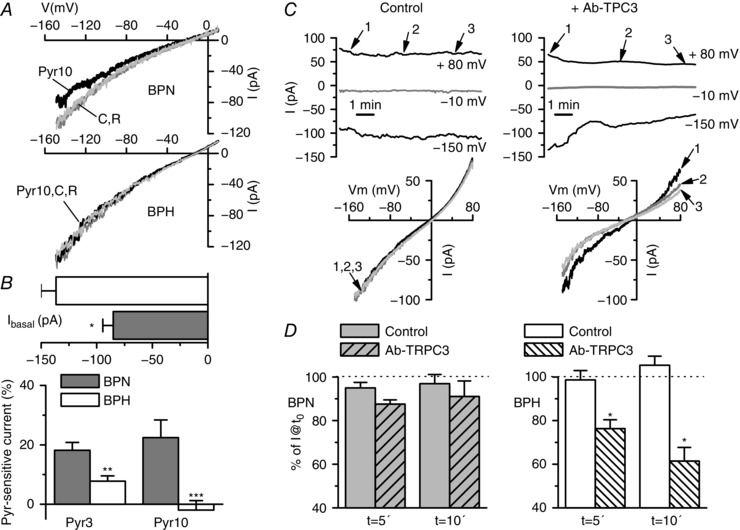
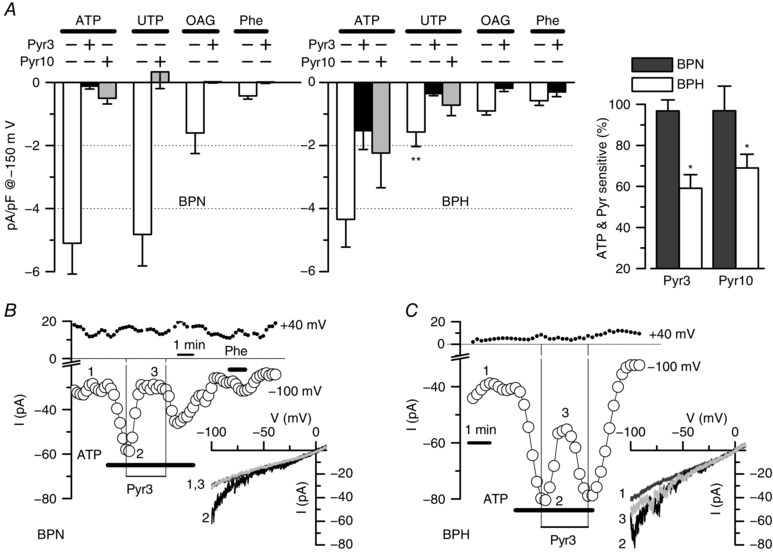
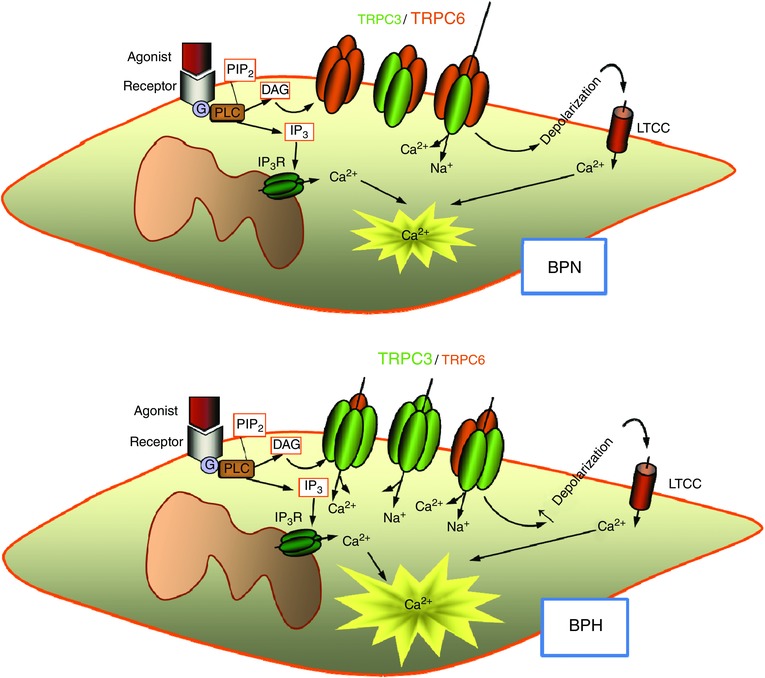
Key points: Canonical transient receptor potential (TRPC)3 and TRPC6 channels of vascular smooth muscle cells (VSMCs) mediate stretch- or agonist-induced cationic fluxes, contributing to membrane potential and vascular tone. Native TRPC3/C6 channels can form homo- or heterotetrameric complexes, which can hinder individual TRPC channel properties. The possibility that the differences in their association pattern may change their contribution to vascular tone in hypertension is unexplored. Functional characterization of heterologously expressed channels showed that TRPC6-containing complexes exhibited Pyr3/Pyr10-sensitive currents, whereas TRPC3-mediated currents were blocked by anti-TRPC3 antibodies. VSMCs from hypertensive (blood pressure high; BPH) mice have larger cationic basal currents insensitive to Pyr10 and sensitive to anti-TRPC3 antibodies. Consistently, myography studies showed a larger Pyr3/10-induced vasodilatation in BPN (blood pressure normal) mesenteric arteries. We conclude that the increased TRPC3 channel expression in BPH VSMCs leads to changes in TRPC3/C6 heteromultimeric assembly, with a higher TRPC3 channel contribution favouring depolarization of hypertensive VSMCs.

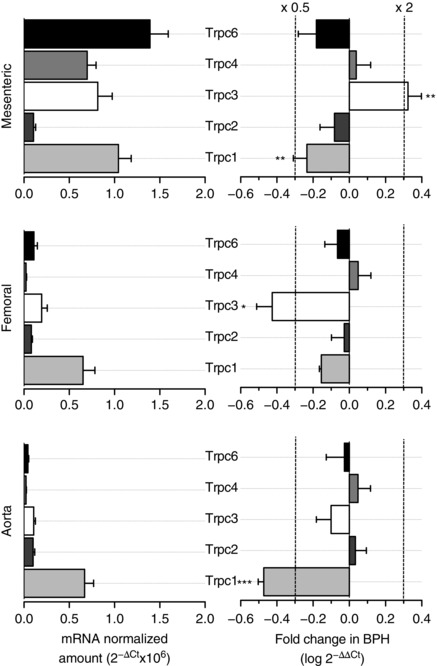
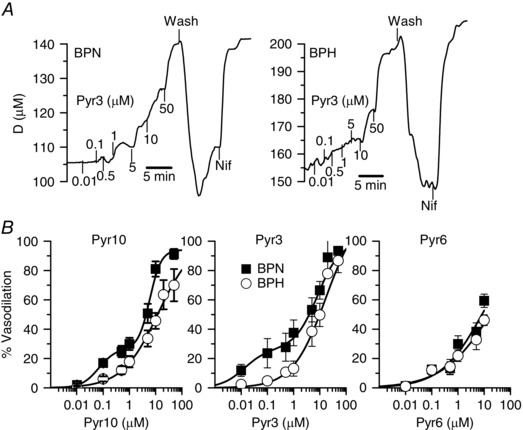
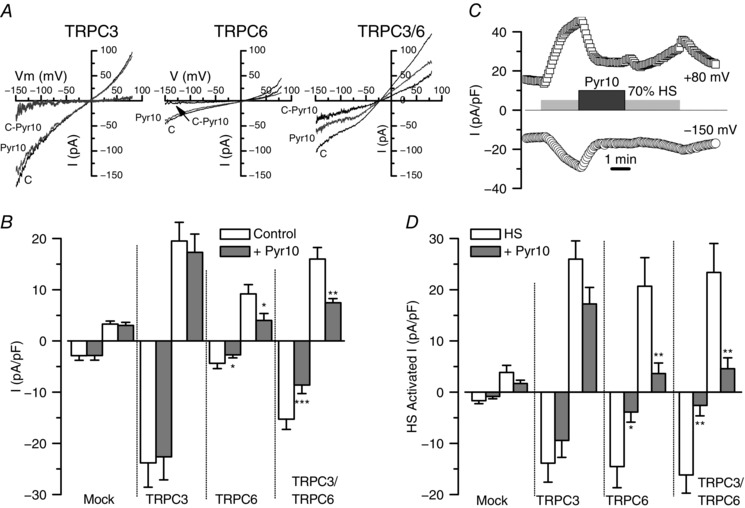
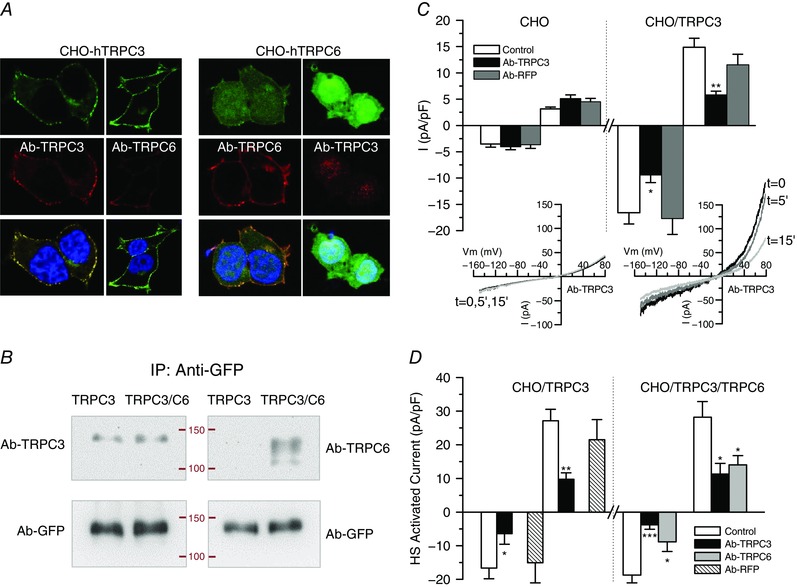
Abstract: Increased vascular tone in essential hypertension involves a sustained rise in total peripheral resistance. A model has been proposed in which the combination of membrane depolarization and higher L-type Ca2+ channel activity generates augmented Ca2+ influx into vascular smooth muscle cells (VSMCs), contraction and vasoconstriction. The search for culprit ion channels responsible for membrane depolarization has provided several candidates, including members of the canonical transient receptor potential (TRPC) family. TRPC3 and TRPC6 are diacylglycerol-activated, non-selective cationic channels contributing to stretch- or agonist-induced depolarization. Conflicting information exists regarding changes in TRPC3/TRPC6 functional expression in hypertension. However, although TRPC3-TRPC6 channels can heteromultimerize, the possibility that differences in their association pattern may change their functional contribution to vascular tone is largely unexplored. We probe this hypothesis using a model of essential hypertension (BPH mice; blood pressure high) and its normotensive control (BPN mice; blood pressure normal). First, non-selective cationic currents through homo- and heterotetramers recorded from transfected Chinese hamster ovary cells indicated that TRPC currents were sensitive to the selective antagonist Pyr10 only when TRPC6 was present, whereas intracellular anti-TRPC3 antibody selectively blocked TRPC3-mediated currents. In mesenteric VSMCs, basal and agonist-induced currents were more sensitive to Pyr3 and Pyr10 in BPN cells. Consistently, myography studies showed a larger Pyr3/10-induced vasodilatation in BPN mesenteric arteries. mRNA and protein expression data supported changes in TRPC3 and TRPC6 proportions and assembly, with a higher TRPC3 channel contribution in BPH VSMCs that could favour cell depolarization. These differences in functional and pharmacological properties of TRPC3 and TRPC6 channels, depending on their assembly, could represent novel therapeutical opportunities.

Keywords: TRP channels; essential hypertension; vascular smooth muscle.


Figures

Figure 1
Figure 1. mRNA profile of TRPC channels in BPN and BPH VSMCs
Left: relative abundance of TRPC family channels in VSMC from BPN mesenteric, femoral and aorta arteries normalized by the amount of RP18S. Data are expressed as 2−ΔCt, where ΔCt = Ctchannel – Ct18S. Right: showing, for each vascular bed, the changes in TRPC channels expression in BPH arteries using BPN arteries as the calibrator. Differences are expressed as log (2−ΔΔCt) where ΔΔCt = ΔCtBPH – ΔCtBPN. With the log scale, a value of 0 represents no change, increases in expression are depicted as positive changes, and decreased expression appears as a negative value. For reference, the values of a two‐fold increase or a two‐fold decrease are indicated by the dotted lines. Each bar is the mean ± SEM, n = 6–10 values from at least three independent experiments. All through the figures * P < 0.05; ** P < 0.01; *** P < 0.001.
Figure 2
Figure 2. Effects of Pyr compounds on the vascular tone in BPN and BPH mesenteric arteries
A, representative examples of the effect of Pyr3 application at the indicated concentrations (in μm) on the external diameter of a BPN (left) and a BPH artery (right). In both cases, the arteries were pressurized to 70 mmHg and pre‐contracted with bath application of 5 μm phenylephrine (Phe). Increased concentrations of Pyr3 were applied in the continuous presence of Phe. At the end of the experiment 10 μm nifedipine (Nif) was applied to determine the maximal diameter. B, dose–response effect of Pyr10, Pyr3 and Pyr6 in BPN (filled squares) and BPH (open circles) arteries. Data are normalized to the maximal diameter values obtained in the presence of nifedipine and expressed as percentage of relaxation (mean ± SEM; 5–9 arteries in each group). Data are fitted to Hill functions with apparent K d values between 6 and 20 μm. For Pyr3 and Pyr10, the fitting of BPN data includes an additional high‐affinity component representing 25% of the response and with apparent K d values of 10 and 60 nm, respectively.
Figure 3
Figure 3. Functional contribution of TRPC3 and TRPC6 channels to basal and stretch‐activated, non‐selective cationic currents in CHO cells
A, representative examples of the traces recorded in the whole‐cell configuration from unstimulated CHO cells transfected with TRPC3, TRPC6 and TRPC3/6 channels using ramp protocols from −150 mV to +80 mV. The effect of the application of Pyr10 (10 μm) in each case and the subtracted (C‐Pyr), Pyr‐10 sensitive current are also represented in the plots. B, lower bars plot shows average current densities (pA/pF) measured at −150 mV and +80 mV for each condition, as well as for untransfected CHO cells. Data are the mean ± SEM of seven to 23 cells in each condition. C, example of the experimental protocol used to explore the effect of Pyr10 on stretch‐activated currents in a CHO cell transfected with TRPC3/6. The plot shows the time course of the current density recorded at −150 mV and +80 mV together with the time of application of the different stimuli. D, summary of Pyr10 effects on stretch‐activated currents under all of the conditions explored. Bar plot shows average current densities elicited by application of a hypotonic solution (HS, 70% Standarde solution) and the inhibitory effect of Pyr10 (10 μm). Data are the mean ± SEM; 13–22 cells in each group.
Figure 4
Figure 4. Use of antibodies to determine functional contribution, location and association of TRPC3 and TRPC6 channels in CHO cells
A, representative confocal images of immunolabelling with anti‐TRPC3 and anti‐TRPC6 of CHO cells transfected with TRPC3 (left) or TRPC6 (right). Immunostaining was predominant at the cell membrane and shows a good correlation with GFP‐labelling for TRPC3 (a fusion protein). No cross‐reactivity was observed in either case. B, TRPC3‐GFP or TRPC3‐GFP/TRPC6 cotransfected cells were immunoprecipitated with anti‐GFP‐trap and immunoblotted with GFP antibody (as a load control) or with anti‐TRPC3 or anti‐TRPC6 antibody. Labelling with anti‐TRPC6 was detected on the cotransfected cells, demonstrating heteromultimeric association. Data are representative of two independent experiments. C, blocking effect of intracellularly applied antibodies on the cationic currents observed in transfected CHO cells. Average basal current density at −150 mV (open bars) and +80 mV (dashed bars) was obtained from whole‐cell ramps applied every 5 s to control untransfected CHO cells and to cells transfected with TRPC3. The plots show the current density after 5–10 min of recording in control pipette solution or in the presence of the indicated antibodies. Each bar is the mean ± SEM of nine to 14 cells from at least four different experiments. The inset shows the current traces obtained at the indicated times in an untransfected CHO cell (left) or in a TRPC3‐transfected CHO cell (right) with anti‐TRPC3 antibody in the pipette solution. * p < 0.05; ** p < 0.01 compared to CHO/TRPC3 control cells. D, the same protocol was used to explore the blocking effect of anti‐TRPC3 or anti‐TRPC6 on stretch‐activated currents elicited from TRPC3 and TRPC3/C6 transfected cells upon exposure to the hypotonic solution (HS). The effects were calculated by subtracting basal, unstimulated currents and after 5–10 min of recording in control conditions or in the presence of the indicated antibodies. Data are the mean ± SEM, n = 8–10 cells.
Figure 5
Figure 5. Differences in TRPC assembly in BPN and BPH mesenteric VSMCs
A, representative confocal images of the puncta density distribution using the PLA assay in BPN (upper) and BPH (lower) native VSMC cells. The bars plot shows the averaged density of puncta obtained in the three conditions represented in (A) for BPN and BPH cells. Data are the mean ± SEM; 36–64 cells in each group from four independent experiments. * p < 0.05, ** p < 0.01 compared to the same condition in BPN. B, scheme of the possible associations between C3‐C3, C6‐C6 and/or C3‐C6 subunits that can be recognized with each combination of antibodies used for the PLA assay. Following this scheme, the chart illustrates an interpretation of the data, considering 100% as the sum of the intensity of C3‐C3 and C6‐C6 groups and assuming that the C3‐C6 group will be included in both. Accordingly, the C3‐C3 group will contain associations with more than one C3 subunit (C3 > 1) and C6‐C6 those with more than one C6 subunit (C6 > 1).
Figure 6
Figure 6. Characterization of basal cationic currents in BPH and BPN mesenteric VSMCs and effects of anti‐TRPC3 antibody
A, basal cationic currents were obtained by voltage ramps in the presence of TRP external solution. The figure shows representative examples of current–voltage traces obtained in a BPN and a BPH mesenteric VSMC in control conditions (C), in the presence of 10 μm Pyr10 and after washout of the blocker (R). B, upper bar plot showing the current amplitude at −150 mV for both BPN and BPH cells (mean ± SEM, 40–60 cells in each group). The lower plot shows the average fraction of the Pyr3‐ or Pyr10‐sensitive current at −150 mV in BPN (grey bars) or BPH cells (white bars). Each bar is the mean ± SEM of 10 cells (for Pyr3) and 23 cells (for Pyr10). C, representative examples of the time course of the currents elicited by voltage ramps in a BPH cell recorded with anti‐RFP (left) or with anti‐TRPC3 antibody (4 μg ml−1) in the pipette solution (right). The plots show the current amplitude at −150 mV, +80 mV and at the holding potential (−10 mV, grey line). The time course of the cell capacitance and the access resistance were obtained simultaneously (not shown). Examples of the actual traces obtained with the ramp protocol at the time points of 0, 5 and 10 min (points 1, 2 and 3 in the graphs) are also depicted (bottom). D, average current amplitude at 5 and 10 min is represented as a fraction of the initial current amplitude both in control cells (solid bars) and in anti‐TRPC3 treated cells (striped bars), for BPH (left plot) and BPN mesenteric VSMCs (right plot). Each bar is the mean ± SEM of seven to 14 cells in each group. For the control group, untreated cells and cells with anti‐RFP antibody in the pipette solution were pooled together.
Figure 7
Figure 7. Effect of Pyr blockers on agonist‐activated cationic currents in native VSMCs
A, summary data showing the current density at −150 mV of the current activated in the presence of ATP (30 μm), UTP (50 μm), OAG (100 μm) and phenylephrine (Phe, 30 μm) alone or in the presence of Pyr3 (10 μm) or Pyr 10 (10 μm) as indicated. Data were obtained from voltage ramps after subtracting basal, unstimulated currents. Data were obtained from BPN and BPH isolated mesenteric VSMCs. Blockers were applied in the presence of the agonists, and their effects were calculated after subtracting basal current as well. Agonist‐induced currents are the average from 17–36 cells in each group, whereas the effect of the blockers was tested in 6–14 cells in each group. ** p < 0.01 compared with UTP‐activated currents in BPN cells. The inset shows the fraction of the ATP‐activated current that can be blocked by Pyr3 or Pyr10 in BPN (black bars) and BPH cells (white bars). * p < 0.05 compared to UTP effect in BPN. B and C, representative examples of a BPN and a BPH cells that were stimulated with 30 μm ATP alone or with 10 μm Pyr3 as indicated in the graphs. The time course of the current amplitude at −100 mV (open circles) and +40 mV (filled circles) was obtained from voltage ramps applied every 5 s. Traces in control conditions (1) in the presence of ATP (2) or of ATP + Pyr3 (3) are shown in the inset. BPN cell was also challenged with 30 μm Phe as indicated.
Figure 8
Figure 8. Diagram of the proposed changes in TRPC3/C6 composition upon hypertension
Homo‐ and heteromultimeric TRPC3/C6 channels contribute to basal cationic currents in VSMCs, thus modulating resting membrane potential and hence basal [Ca2+] concentration and cell excitability. BPN cells may have a dominant expression of TRPC6 channels, associated with either homo‐ or heterotetramers, which show strong inward rectification. This will result in low basal currents at values around the resting membrane potential. In BPH cells, the increased expression of TRPC3 channels determines a change in the properties of heteromultimers, which will have now a larger proportion of TRPC3 subunits. TRPC3 channels show weak rectification, which will determine an increased basal current at negative potential contributing to cell depolarization, raising the [Ca2+] concentration and increasing basal tone.

Similar articles

Cited by

References

    1. Adebiyi A, Thomas‐Gatewood CM, Leo MD, Kidd MW, Neeb ZP & Jaggar JH (2012). An elevation in physical coupling of type 1 inositol 1,4,5‐trisphosphate (IP3) receptors to transient receptor potential 3 (TRPC3) channels constricts mesenteric arteries in genetic hypertension. Hypertension 60, 1213–1219. - PMC - PubMed
    1. Albert AP & Large WA (2006). Signal transduction pathways and gating mechanisms of native TRP‐like cation channels in vascular myocytes. J Physiol 570, 45–51. - PMC - PubMed
    1. Beech DJ, Muraki K & Flemming R (2004). Non‐selective cationic channels of smooth muscle and the mammalian homologues of Drosophila TRP. J Physiol 559, 685–706. - PMC - PubMed
    1. Cidad P, Moreno‐Domínguez A, Novensá L, Roqué M, Barquín L, Heras M, Pérez‐García MT & López‐López JR (2010). Characterization of ion channels involved in the proliferative response of femoral artery smooth muscle cells. Arterioscler Thromb Vasc Biol 30, 1203–1211. - PubMed
    1. Dietrich A, Chubanov V, Kalwa H, Rost BR & Gudermann T (2006). Cation channels of the transient receptor potential superfamily: their role in physiological and pathophysiological processes of smooth muscle cells. Pharmacol Ther 112, 744–760. - PubMed

Substances

LinkOut - more resources