Consequences of maternal omega-3 polyunsaturated fatty acid supplementation on respiratory function in rat pups
- PMID: 27861919
- PMCID: PMC6426158
- DOI: 10.1113/JP273471
Consequences of maternal omega-3 polyunsaturated fatty acid supplementation on respiratory function in rat pups
Abstract
Key points: Incomplete development of the neural circuits that control breathing contributes to respiratory disorders in pre-term infants. Manifestations include respiratory instability, prolonged apnoeas and poor ventilatory responses to stimuli. Based on evidence suggesting that omega-3 polyunsaturated fatty acids (n-3 PUFA) improves brain development, we determined whether n-3 PUFA supplementation (via the maternal diet) improves respiratory function in 10-11-day-old rat pups. n-3 PUFA treatment prolonged apnoea duration but augmented the relative pulmonary surface area and the ventilatory response to hypoxia. During hypoxia, the drop in body temperature measured in treated pups was 1 °C less than in controls. n-3 PUFA treatment also reduced microglia cell density in the brainstem. Although heterogeneous, the results obtained in rat pups constitute a proof of concept that n-3 PUFA supplementation can have positive effects on neonatal respiration. This includes a more sustained hypoxic ventilatory response and a decreased respiratory inhibition during laryngeal chemoreflex.
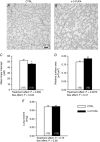
Abstract: Most pre-term infants present respiratory instabilities and apnoeas as a result of incomplete development of the neural circuits that control breathing. Because omega-3 polyunsaturated fatty acids (n-3 PUFA) benefit brain development, we hypothesized that n-3 PUFA supplementation (via the maternal diet) improves respiratory function in rat pups. Pups received n-3 PUFA supplementation from an enriched diet (13 g kg-1 of n-3 PUFA) administered to the mother from birth until the experiments were performed (postnatal days 10-11). Controls received a standard diet (0.3 g kg-1 of n-3 PUFA). Breathing was measured in intact pups at rest and during hypoxia (FiO2 = 0.12; 20 min) using whole body plethysmography. The duration of apnoeas induced by stimulating the laryngeal chemoreflex (LCR) was measured under anaesthesia. Lung morphology was compared between groups. Maternal n-3 PUFA supplementation effectively raised n-3 PUFA levels above control levels both in the blood and brainstem of pups. In intact, resting pups, n-3 PUFA increased the frequency and duration of apnoeas, especially in females. During hypoxia, n-3 PUFA supplemented pups hyperventilated 23% more than controls; their anapyrexic response was 1 °C less than controls. In anaesthetized pups, n-3 PUFA shortened the duration of LCR-induced apnoeas by 32%. The relative pulmonary surface area of n-3 PUFA supplemented pups was 12% higher than controls. Although n-3 PUFA supplementation augments apnoeas, there is no clear evidence of deleterious consequences on these pups. Based on the improved lung architecture and responses to respiratory challenges, this neonatal treatment appears to be beneficial to the offspring. However, further experiments are necessary to establish its overall safety.
Keywords: control of breathing; development; plasticity; prematurity.
© 2016 The Authors. The Journal of Physiology © 2016 The Physiological Society.
Figures


Similar articles
-
Perinatal exposure to omega-3 fatty acid imbalance leads to early behavioral alterations in rat pups.Behav Brain Res. 2020 Aug 17;392:112723. doi: 10.1016/j.bbr.2020.112723. Epub 2020 May 31. Behav Brain Res. 2020. PMID: 32492499
-
Sex-Specific Consequences of Neonatal Stress on Cardio-Respiratory Inhibition Following Laryngeal Stimulation in Rat Pups.eNeuro. 2018 Jan 4;4(6):ENEURO.0393-17.2017. doi: 10.1523/ENEURO.0393-17.2017. eCollection 2017 Nov-Dec. eNeuro. 2018. PMID: 29308430 Free PMC article.
-
Maternal thyroid hormone deficiency and cardiorespiratory disorder in rat pups.Exp Neurol. 2019 Oct;320:112960. doi: 10.1016/j.expneurol.2019.112960. Epub 2019 May 18. Exp Neurol. 2019. PMID: 31108087
-
n-3 Fatty Acid Supplementation in Mothers, Preterm Infants, and Term Infants and Childhood Psychomotor and Visual Development: A Systematic Review and Meta-Analysis.J Nutr. 2018 Mar 1;148(3):409-418. doi: 10.1093/jn/nxx031. J Nutr. 2018. PMID: 29546296 Free PMC article.
-
Marine Omega-3 Fatty Acids, Complications of Pregnancy and Maternal Risk Factors for Offspring Cardio-Metabolic Disease.Mar Drugs. 2018 Apr 24;16(5):138. doi: 10.3390/md16050138. Mar Drugs. 2018. PMID: 29695082 Free PMC article. Review.
Cited by
-
High doses of enteral docosahexaenoic acid omega-3 supplementation for prevention of bronchopulmonary dysplasia in very preterm infants: a protocol for a systematic review and meta-analysis.BMJ Open. 2022 Oct 17;12(10):e064515. doi: 10.1136/bmjopen-2022-064515. BMJ Open. 2022. PMID: 36253040 Free PMC article.
-
Fundamental Neurochemistry Review: Lipids across microglial states.J Neurochem. 2025 Jan;169(1):e16259. doi: 10.1111/jnc.16259. J Neurochem. 2025. PMID: 39696753 Free PMC article. Review.
-
Association Between Enteral Supplementation With High-Dose Docosahexaenoic Acid and Risk of Bronchopulmonary Dysplasia in Preterm Infants: A Systematic Review and Meta-analysis.JAMA Netw Open. 2023 Mar 1;6(3):e233934. doi: 10.1001/jamanetworkopen.2023.3934. JAMA Netw Open. 2023. PMID: 36943265 Free PMC article.
-
Can prenatal conditions impact the effect of omega-3 on bronchopulmonary dysplasia in very preterm infants? A secondary analysis of a randomized controlled trial.Eur J Pediatr. 2025 Mar 12;184(4):243. doi: 10.1007/s00431-025-06053-4. Eur J Pediatr. 2025. PMID: 40072608 Clinical Trial.
-
Supplementation with dietary omega-3 PUFA mitigates fetal brain inflammation and mitochondrial damage caused by high doses of sodium nitrite in maternal rats.PLoS One. 2022 Mar 24;17(3):e0266084. doi: 10.1371/journal.pone.0266084. eCollection 2022. PLoS One. 2022. PMID: 35324981 Free PMC article.
References
-
- Abu‐Shaweesh JM & Martin RJ (2008). Neonatal apnea: what's new? Pediatr Pulmonol 43, 937–944. - PubMed
-
- Bairam A, Boutroy MJ, Badonnel Y & Vert P (1987). Theophylline versus caffeine: comparative effects in treatment of idiopathic apnea in the preterm infant. J Pediatr 110, 636–639. - PubMed
-
- Bissonnette JM (2000). Mechanisms regulating hypoxic respiratory depression during fetal and postnatal life. Am J Physiol Regul Integr Comp Physiol 278, R1391–R1400. - PubMed
-
- Chalon S (2006). Omega‐3 fatty acids and monoamine neurotransmission. Prostaglandins Leukot Essent Fatty Acids 75, 259–269. - PubMed
Publication types
MeSH terms
Substances
Grants and funding
LinkOut - more resources
Full Text Sources
Other Literature Sources
Medical

