Review
. 2017 Apr;30(4):10.1002/nbm.3655.
doi: 10.1002/nbm.3655. Epub 2016 Nov 11.

Effects of biological tissue structural anisotropy and anisotropy of magnetic susceptibility on the gradient echo MRI signal phase: theoretical background

Affiliations
Review

Effects of biological tissue structural anisotropy and anisotropy of magnetic susceptibility on the gradient echo MRI signal phase: theoretical background

Dmitriy A Yablonskiy et al. NMR Biomed. 2017 Apr.

Abstract

Quantitative susceptibility mapping is a potentially powerful technique for mapping tissue magnetic susceptibility from gradient recalled echo (GRE) MRI signal phase. In this review, we present up-to-date theoretical developments in analyzing the relationships between GRE signal phase and the underlying tissue microstructure and magnetic susceptibility at the cellular level. Two important phenomena contributing to the GRE signal phase are at the focus of this review - tissue structural anisotropy (e.g. cylindrical axonal bundles in white matter) and magnetic susceptibility anisotropy. One of the most intriguing and challenging problems in this field is calculating the so-called Lorentzian contribution to the phase shift induced by the local environment - magnetized tissue structures that have dimensions smaller than the imaging voxel (e.g. cells, cellular components, blood capillaries). In this review, we briefly discuss a "standard" approach to this problem, based on introduction of an imaginary Lorentzian cavity, as well as a more recent method - the generalized Lorentzian tensor approach (GLTA) - that is based on a statistical approach and a direct solution of the magnetostatic Maxwell equations. The latter adequately accounts for both types of anisotropy: the anisotropy of magnetic susceptibility and the structural tissue anisotropy. In the GLTA the frequency shift due to the local environment is characterized by the Lorentzian tensor L^, which has a substantially different structure than the susceptibility tensor χ^. While the components of χ^ are compartmental susceptibilities "weighted" by their volume fractions, the components of L^ are weighted by specific numerical factors depending on tissue geometrical microsymmetry. In multi-compartment structures, the components of the Lorentzian tensor also depend on the compartmental relaxation properties, hence the MR pulse sequence settings. Copyright © 2016 John Wiley & Sons, Ltd.

Keywords: generalized Lorentzian tensor approach; magnetic susceptibility; phase contrast; quantitative susceptibility mapping; white matter.


Figures

Figure 1.
Figure 1.
Left (courtesy of Jie Luo): example of the frequency distribution in human cortical brain tissue – data obtained with 3 T MRI scanner from a normal 25 year old male volunteer. (A) T1w image; (B) magnified view of a selected ROI (white rectangle); (C) frequency map of the same ROI as in B. The plot between B and C represents the frequency profile through the selected yellow line. Peaks match up with GM, deep troughs correspond to CSF, and intermediate troughs are WM tracts. The frequency difference between WM and CSF in this plot is very small, about 3 ppb. Right: a schematic diagram explaining the WM darkness effect. It shows two cylindrical containers: D filled with water, and E filled with water and long water-impermeable bars with arbitrary magnetic susceptibility. Since water containers and long bars are parallel to the magnetic field B0, they do not add to the B0 magnetic field outside themselves (assuming that the lengths of the main cylinders are much longer than their transverse sizes). Hence, there is no difference between water MR signal frequencies in these two objects in spite of the difference in their bulk (average) magnetic susceptibilities.
Figure 2.
Figure 2.
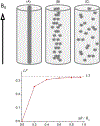
(adopted from Reference (19)). (a) An “ideal” cylindrical structure (black cylinder); (b) “mildly” randomized structure – fragments of the cylinder are slightly scattered; (c) “severely” randomized structure – fragments of the cylinder are scattered randomly. Lower panel – the dependence of the Lorentzian Factor (LF) on the “level of disorder” ΔR/R0R – an average fragment’s displacement, R0 – the outer cylinder radius). The external magnetic field B0 is parallel to the cylinder axis.
Figure 3.
Figure 3.
Experimentally observed TE dependences of the frequency shifts in WM (A – adapted from Reference (29); B – adapted from (31)). The lines correspond to axonal fibers with different orientations with respect to the external field B0. The frequency is practically independent of TE for fibers parallel to B0 and strongly depends on TE for the perpendicular orientation.
Figure 4.
Figure 4.
(adapted from Reference (42)). Phase evolution of the GRE and VISTa signals. The signals are from the fibers that are nearly perpendicular to the external field B0.
Figure 5.
Figure 5.
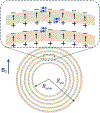
(modified from (30). A schematic structure of an axon (A) with radius RA surrounded by a myelin sheath with external radius Re consisting of interleaved lipoprotein layers (ml) of thickness d marked in grey, separated by aqueous layers (mw) of thickness dw. Each lipoprotein layer is formed by highly organized, radially oriented long molecules (shown as ellipsoids in the inset) with presumed anisotropic magnetic susceptibility.
Figure 6.
Figure 6.
A schematic structure describing the “hop-in-hop-out” mechanism. All the parameters are the same as in Figure 5. Blue dots represent water molecules performing a “hokey pokey dance” from aqueous to lipoprotein layers. When a water molecule jumps from water layer to lipoprotein layer, it experiences an additional field δh (shown as arrows) induced by the surface charges.
Figure 7.
Figure 7.
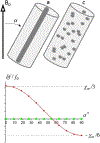
The relative frequency shift as a function of the angle α between the external magnetic field B0 and the cylinder’s axis. Green dots – “ideal” structure (black cylinder) shows zero frequency shift for all angles α; red dots – fully disordered structure.
Figure 8.
Figure 8.
The orientation dependence of the frequency shift in WM in the human (A; adapted from Reference (45)) and rat (B; adapted from Reference (46)) brain. (A) Measurements for a single direction of the external field B0 but for different fibers forming variable angles with B0, evaluated by means of DTI. (B) The actually measured angular dependence of the frequency shift in fibers in a rat brain that was rotated within a static B0.
Figure 9.
Figure 9.
(adopted from (22)). Example of experimental data for fresh and fixed nerves. Filled circles – experimental data; lines – linear fits against sin2 α. (A, C) Frequency shifts inside nerve versus surrounding medium; (B, D) characteristic function Δfc(α) determining the frequency shifts outside the nerve.
Figure 10.
Figure 10.
(adapted from (19)). Schematic structure of the MR signal phase/frequency change with MS lesion severity for two types of tissue destruction. Left, myelin injury (assuming positive magnetic susceptibility of myelin); right, neurofilament injury. Minor myelin injury corresponds to the initial ascending portion of the plot in the left-hand panel; i.e., phase/frequency increases. Neurofilament injury corresponds to the initial descending portion of the plot in the right-hand panel; i.e., phase/frequency decreases. Severe lesions with significant destruction of both myelin and axons might disappear from phase images.
Figure 11.
Figure 11.
(adopted from (19)). T1w (T1-weighted), FLAIR (flow attenuated inversion recovery), GEPCI FST2* (CSF-suppressed T2*), frequency, and GEPCI T1f (a combination of T1w and frequency) maps from a subject with secondary progressive MS. Rectangles outline abnormalities observed on FLAIR and/or frequency (phase) maps. Lesion severity is determined by the TDS, which ranges from zero for healthy tissue to unity for fully destroyed tissue (64). Orange rectangles denote an alteration seen in phase images (bright contrast) but not T1w FLAIR, or GEPCI FST2*. This alteration may rep-resent a very mild lesion with damaged myelin, and it is also seen on the GEPCI T1f image as negative (dark) contrast. Blue rectangles outline a small MS lesion that is barely seen on FLAIR and GEPCI FST2*; this lesion is also visible on the phase image. Red rectangles outline a severe MS lesions (very high TDS score) that is seen in T1w, FLAIR, and GEPCI FST2* but does not have a footprint on the phase image. A magnified view of this lesion is shown in the inset with overlaid GEPCI TDS score in color according to the color bar.

Similar articles

Cited by

References

    1. Duyn JH, van Gelderen P, Li TQ, de Zwart JA, Koretsky AP, Fukunaga M. High-field MRI of brain cortical substructure based on signal phase. Proc. Natl. Acad. Sci. U. S. A 2007; 104(28): 11796–11801. - PMC - PubMed
    1. Zhong K, Leupold J, von Elverfeldt D, Speck O. The molecular basis for gray and white matter contrast in phase imaging. Neuroimage 2008; 40(4): 1561–1566. - PubMed
    1. Marques JP, Maddage R, Mlynarik V, Gruetter R. On the origin of the MR image phase contrast: an in vivo MR microscopy study of the rat brain at 14.1 T. Neuroimage 2009; 46(2): 345–352. - PubMed
    1. Abduljalil AM, Schmalbrock P, Novak V, Chakeres DW. Enhanced gray and white matter contrast of phase susceptibility-weighted images in ultra-high-field magnetic resonance imaging. J. Magn. Reson. Imaging 2003; 18(3): 284–290. - PubMed
    1. Rauscher A, Sedlacik J, Barth M, Mentzel HJ, Reichenbach JR. Magnetic susceptibility-weighted MR phase imaging of the human brain. Am. J. Neuroradiol 2005; 26(4): 736–742. - PMC - PubMed

LinkOut - more resources