

A PTS EII mutant library in Group A Streptococcus identifies a promiscuous man-family PTS transporter influencing SLS-mediated hemolysis
- PMID: 27862457
- PMCID: PMC5263093
- DOI: 10.1111/mmi.13573
A PTS EII mutant library in Group A Streptococcus identifies a promiscuous man-family PTS transporter influencing SLS-mediated hemolysis
Abstract
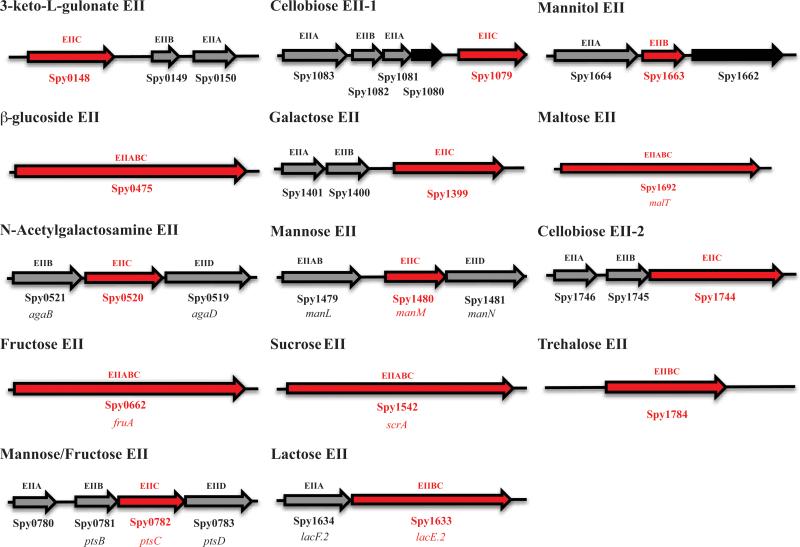
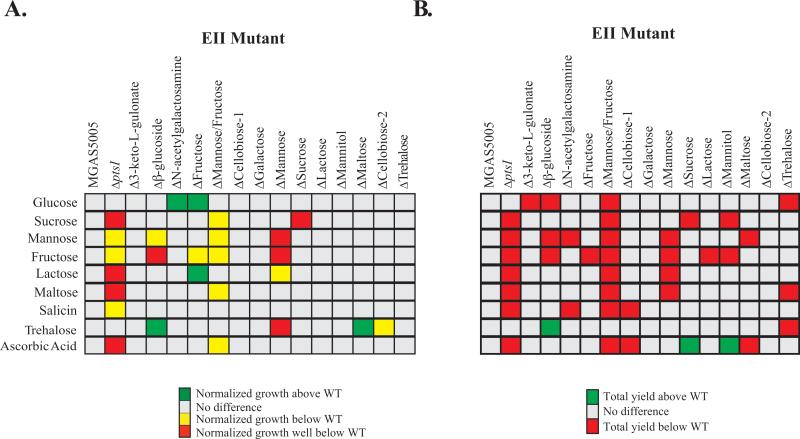
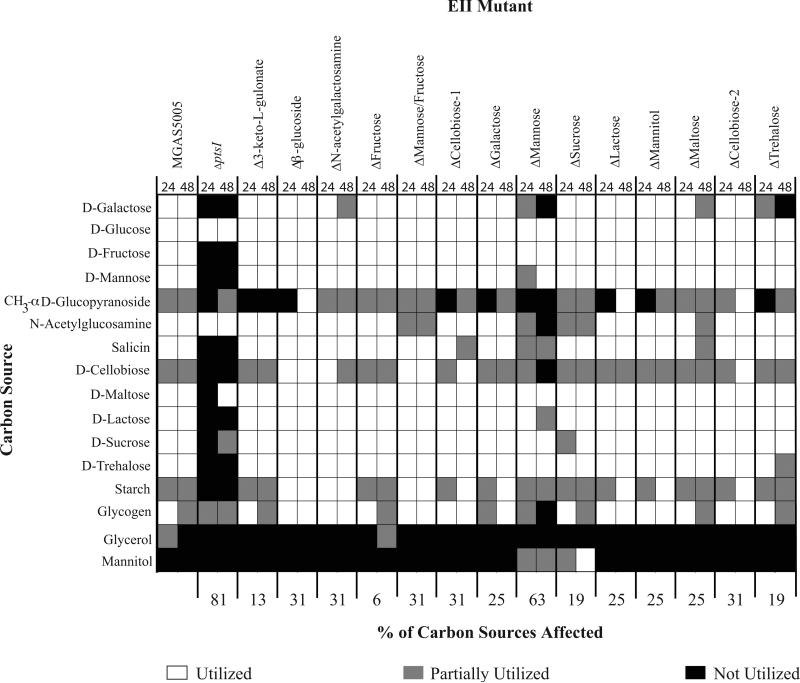
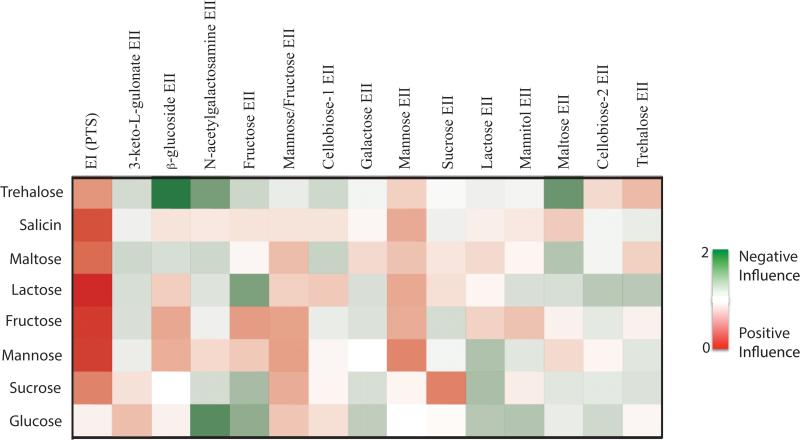
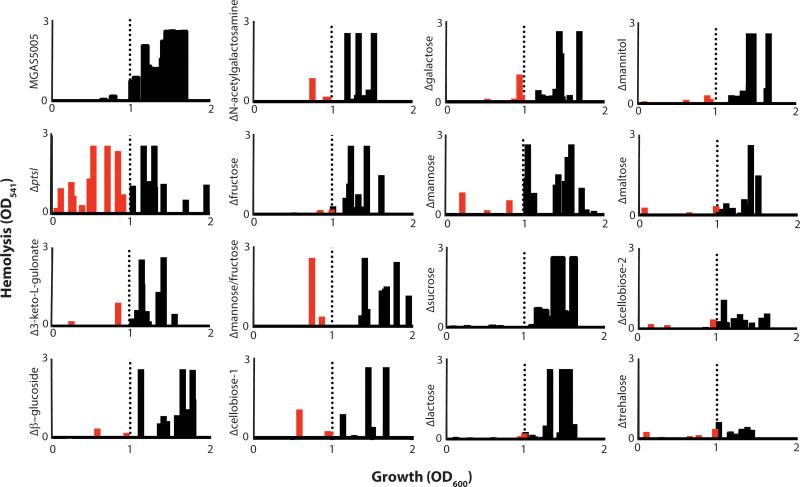
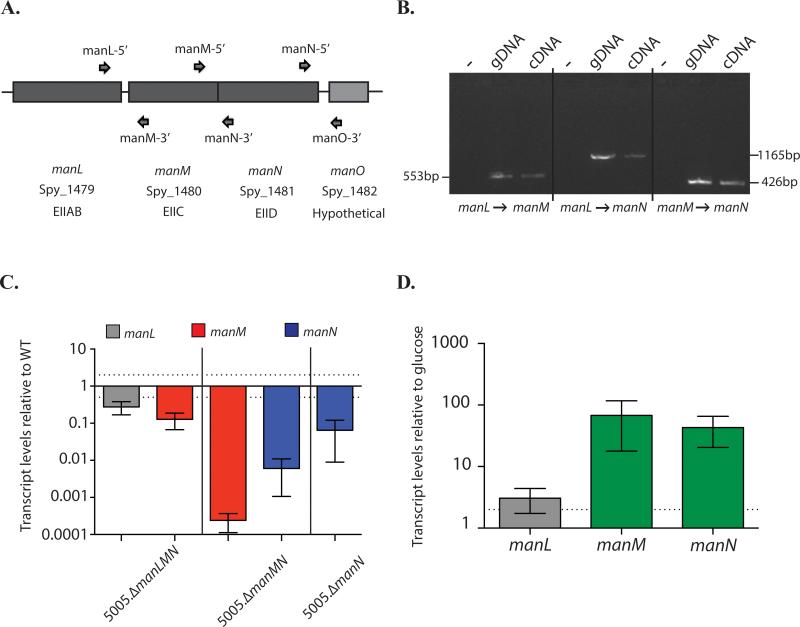
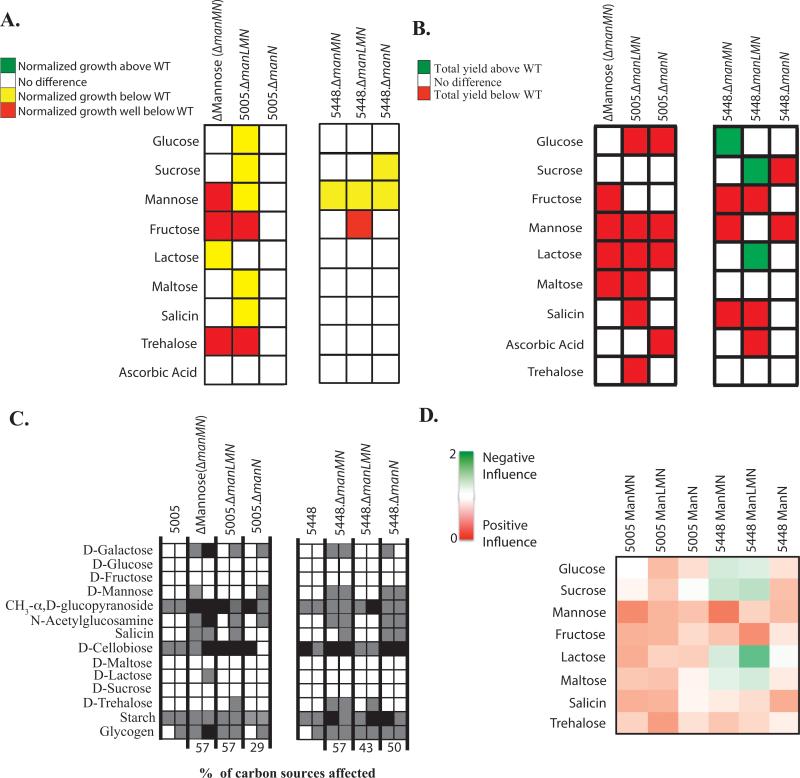
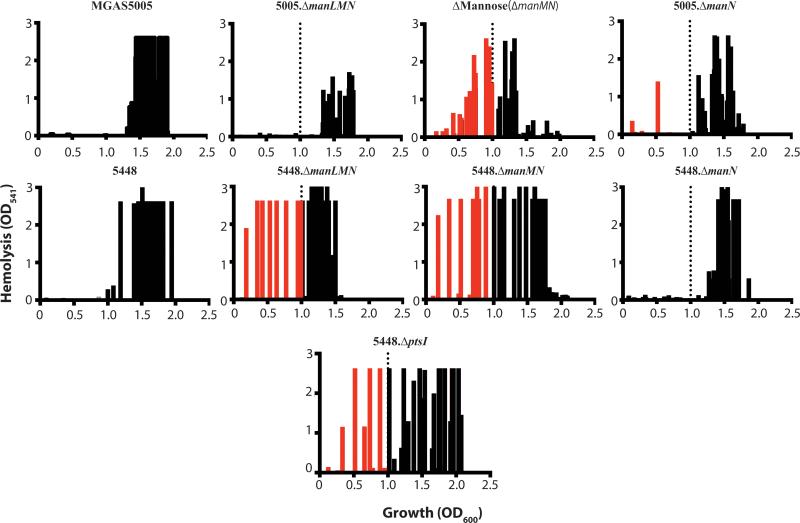
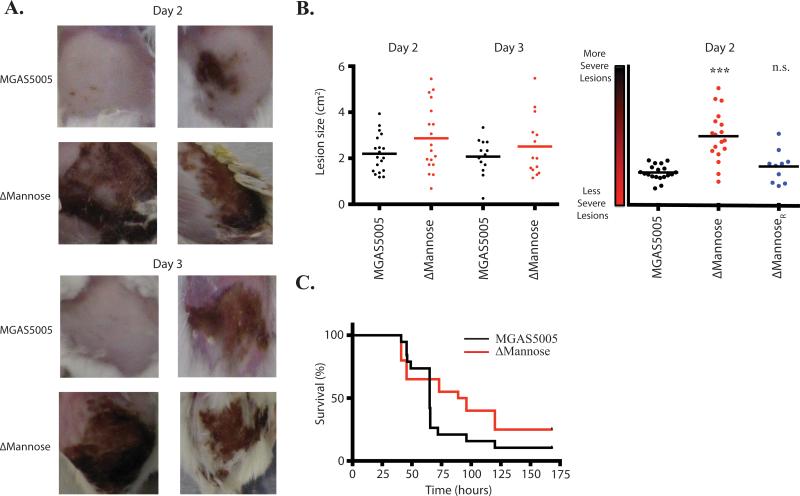
The Group A Streptococcus (GAS, Streptococcus pyogenes) is a Gram-positive human pathogen that must adapt to unique host environments in order to survive. Links between sugar metabolism and virulence have been demonstrated in GAS, where mutants in the phosphoenolpyruvate-dependent phosphotransferase system (PTS) exhibited Streptolysin S (SLS)-mediated hemolysis during exponential growth. This early onset hemolysis correlated with an increased lesion size and severity in a murine soft tissue infection model when compared with parental M1T1 MGAS5005. To identify the PTS components responsible for this phenotype, we insertionally inactivated the 14 annotated PTS EIIC-encoding genes in the GAS MGAS5005 genome and subjected this library to metabolic and hemolysis assays to functionally characterize each EIIC. It was found that a few EIIs had a very limited influence on PTS sugar metabolism, whereas others were fairly promiscuous. The mannose-specific EII locus, encoded by manLMN, was expressed as a mannose-inducible operon that exhibited the most influence on PTS sugar metabolism, including mannose. Importantly, components of the mannose-specific EII also acted to prevent the early onset of SLS-mediated hemolysis. Interestingly, these roles were not identical in two different M1T1 GAS strains, highlighting the possible versatility of the PTS to adapt to strain-specific needs.
© 2016 John Wiley & Sons Ltd.
Figures
Similar articles
-
Phosphotransferase System Uptake and Metabolism of the β-Glucoside Salicin Impact Group A Streptococcal Bloodstream Survival and Soft Tissue Infection.Infect Immun. 2020 Sep 18;88(10):e00346-20. doi: 10.1128/IAI.00346-20. Print 2020 Sep 18. Infect Immun. 2020. PMID: 32719156 Free PMC article.
-
Coordinated Regulation of the EIIMan and fruRKI Operons of Streptococcus mutans by Global and Fructose-Specific Pathways.Appl Environ Microbiol. 2017 Oct 17;83(21):e01403-17. doi: 10.1128/AEM.01403-17. Print 2017 Nov 1. Appl Environ Microbiol. 2017. PMID: 28821551 Free PMC article.
-
The Streptococcus pyogenes mannose phosphotransferase system (Man-PTS) influences antimicrobial activity and niche-specific nasopharyngeal infection.J Bacteriol. 2025 Apr 17;207(4):e0049224. doi: 10.1128/jb.00492-24. Epub 2025 Mar 26. J Bacteriol. 2025. PMID: 40135874 Free PMC article.
-
The complete phosphotransferase system in Escherichia coli.J Mol Microbiol Biotechnol. 2001 Jul;3(3):329-46. J Mol Microbiol Biotechnol. 2001. PMID: 11361063 Review.
-
How phosphotransferase system-related protein phosphorylation regulates carbohydrate metabolism in bacteria.Microbiol Mol Biol Rev. 2006 Dec;70(4):939-1031. doi: 10.1128/MMBR.00024-06. Microbiol Mol Biol Rev. 2006. PMID: 17158705 Free PMC article. Review.
Cited by
-
The pneumococcal social network.PLoS Pathog. 2020 Oct 29;16(10):e1008931. doi: 10.1371/journal.ppat.1008931. eCollection 2020 Oct. PLoS Pathog. 2020. PMID: 33119698 Free PMC article. Review.
-
Transporters of glucose and other carbohydrates in bacteria.Pflugers Arch. 2020 Sep;472(9):1129-1153. doi: 10.1007/s00424-020-02379-0. Epub 2020 May 6. Pflugers Arch. 2020. PMID: 32372286 Review.
-
Genome-wide analysis of in vivo CcpA binding with and without its key co-factor HPr in the major human pathogen group A Streptococcus.Mol Microbiol. 2021 Jun;115(6):1207-1228. doi: 10.1111/mmi.14667. Epub 2020 Dec 29. Mol Microbiol. 2021. PMID: 33325565 Free PMC article.
-
Route of Glucose Uptake in the Group a Streptococcus Impacts SLS-Mediated Hemolysis and Survival in Human Blood.Front Cell Infect Microbiol. 2018 Mar 14;8:71. doi: 10.3389/fcimb.2018.00071. eCollection 2018. Front Cell Infect Microbiol. 2018. PMID: 29594067 Free PMC article.
-
Carbohydrate Metabolism Affects Macrophage-Mediated Killing of Enterococcus faecalis.mSystems. 2021 Oct 26;6(5):e0043421. doi: 10.1128/mSystems.00434-21. Epub 2021 Sep 7. mSystems. 2021. PMID: 34491082 Free PMC article.
References
-
- Afzal M, Shafeeq S, Henriques-Normark B, Kuipers OP. UlaR activates expression of the ula operon in Streptococcus pneumoniae in the presence of ascorbic acid. Micriobiology. 2015:41–49. - PubMed
-
- Carapetis JR, Steer AC, Mulholland EK, Weber M. The global burden of group A streptococcal diseases. Lancet Infectious Diseases. 2005;5:685–694. - PubMed
-
- Chatellier S, Ihendyane N, Kansal RG, Khambaty F, Basma H, Norrby-Teglund A, Low DE, McGeer A, Kotb M. Genetic relatedness and superantigen expression in group A streptococcus serotype M1 isolates from patients with severe and nonsevere invasive diseases. Infection and Immunity. 2000;68:3523–3534. - PMC - PubMed
Publication types
MeSH terms
Substances
Grants and funding
LinkOut - more resources
Full Text Sources
Other Literature Sources
