

Nicotine-induced protein expression profiling reveals mutually altered proteins across four human cell lines
- PMID: 27862958
- PMCID: PMC5540149
- DOI: 10.1002/pmic.201600319
Nicotine-induced protein expression profiling reveals mutually altered proteins across four human cell lines
Abstract
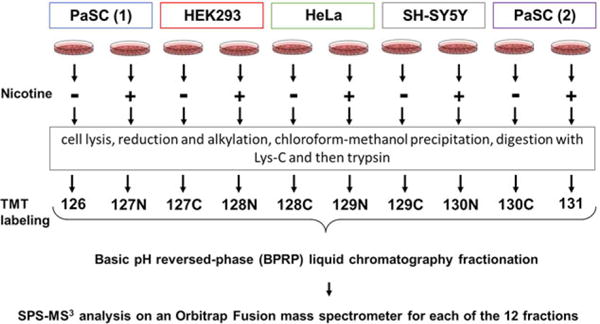
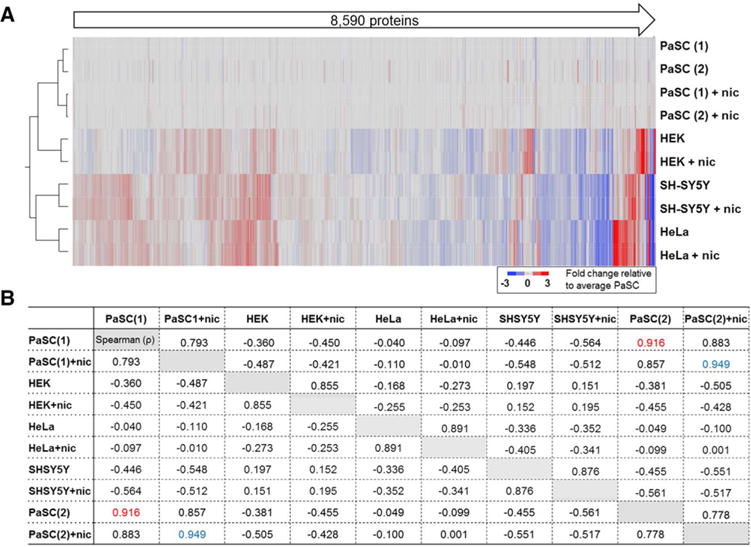
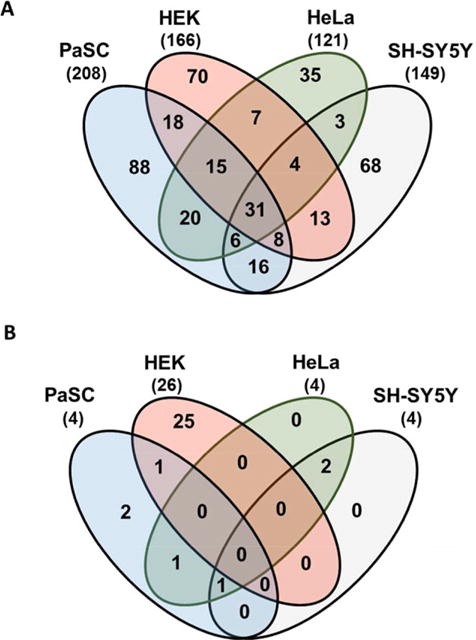
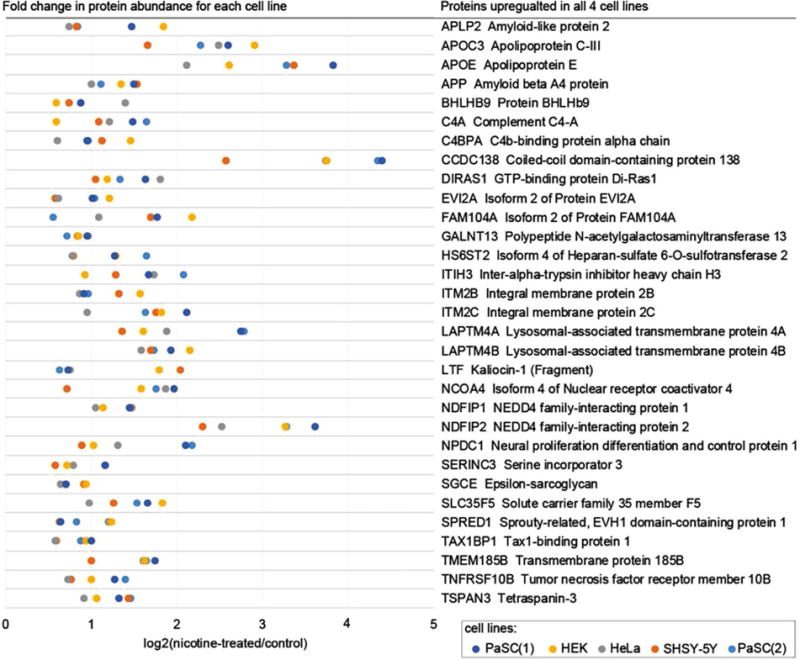
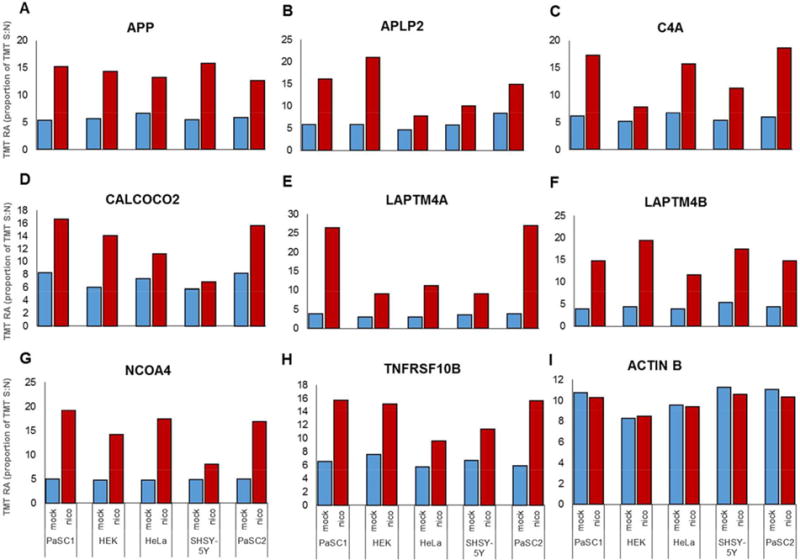
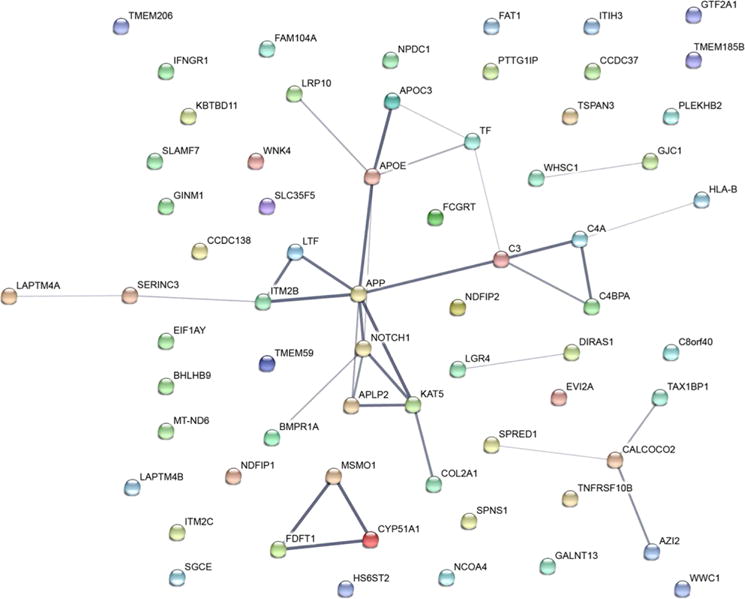
Mass spectrometry-based proteomic strategies can profile the expression level of proteins in response to external stimuli. Nicotine affects diverse cellular pathways, however, the nicotine-induced alterations on the global proteome across human cell lines have not been fully elucidated. We measured perturbations in protein levels resulting from nicotine treatment in four cell lines-HEK, HeLa, PaSC, and SH-SY5Y-in a single experiment using tandem mass tags (TMT10-plex) and high-resolution mass spectrometry. We quantified 8590 proteins across all cell lines. Of these, nicotine increased the abundance of 31 proteins 1.5-fold or greater in all cell lines. Likewise, considering proteins with altered levels in at least three of the four cell lines, 64 were up-regulated, while one was down-regulated. Gene ontology analysis revealed that ∼40% of these proteins were membrane bound, and functioned in transmembrane signaling and receptor activity. We highlighted proteins, including APP, APLP2, LAPTM4B, and NCOA4, which were dysregulated by nicotine in all cell lines investigated and may have implications in downstream signaling pathways, particularly autophagy. Using the outlined methodology, studies in additional (including primary) cell lines will provide further evidence that alterations in the levels of these proteins are indeed a general response to nicotine and thereby merit further investigation.
Keywords: Cell biology; Nicotine; Orbitrap fusion; Pancreas; SPS-MS3; TMT.
© 2016 WILEY-VCH Verlag GmbH & Co. KGaA, Weinheim.
Conflict of interest statement
The authors have declared no conflict of interest.
Figures
References
-
- Dayon L, Hainard A, Licker V, Turck N, et al. Relative quantification of proteins in human cerebrospinal fluids by MS/MS using 6-plex isobaric tags. Anal Chem. 2008;80:2921–2931. - PubMed
-
- Thompson A, Schafer J, Kuhn K, Kienle S, et al. Tandem mass tags: a novel quantification strategy for comparative analysis of complex protein mixtures by MS/MS. Anal Chem. 2003;75:1895–1904. - PubMed
-
- Ross PL, Huang YN, Marchese JN, Williamson B, et al. Multiplexed protein quantitation in Saccharomyces cerevisiae using amine-reactive isobaric tagging reagents. Mol Cell Proteomics. 2004;3:1154–1169. - PubMed
-
- National Toxicology, P. Tobacco-related exposures: tobacco smoking. Rep Carcinog. 2011;12:408–410. - PubMed
Publication types
MeSH terms
Substances
Grants and funding
LinkOut - more resources
Full Text Sources
Other Literature Sources
Miscellaneous
