. 2017 Jan;6(1):21-28.
doi: 10.1002/psp4.12132. Epub 2016 Nov 8.

Using Model-Based "Learn and Confirm" to Reveal the Pharmacokinetics-Pharmacodynamics Relationship of Pembrolizumab in the KEYNOTE-001 Trial

Affiliations

Using Model-Based "Learn and Confirm" to Reveal the Pharmacokinetics-Pharmacodynamics Relationship of Pembrolizumab in the KEYNOTE-001 Trial

J Elassaiss-Schaap et al. CPT Pharmacometrics Syst Pharmacol. 2017 Jan.

Abstract

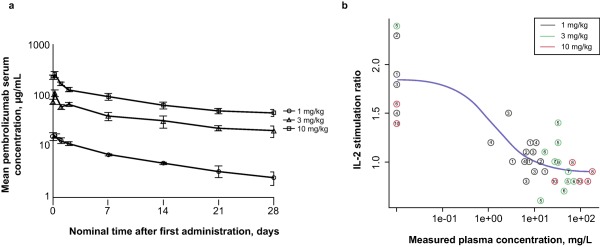
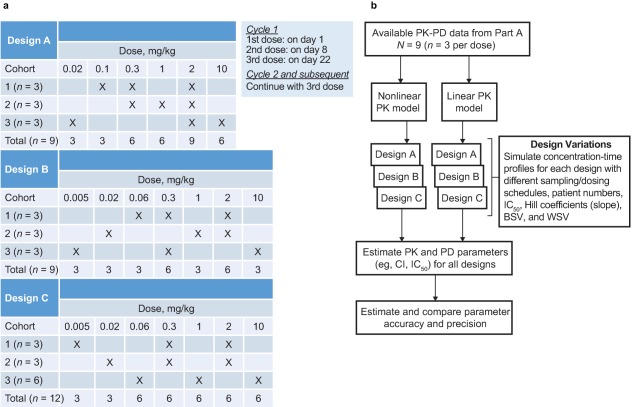
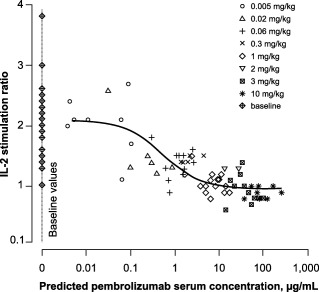
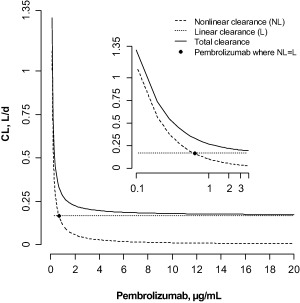
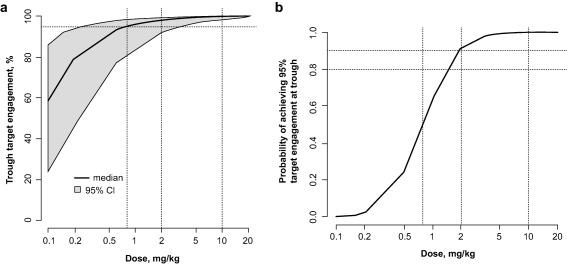
Evaluation of pharmacokinetic/pharmacodynamic (PK/PD) properties played an important role in the early clinical development of pembrolizumab. Because analysis of data from a traditional 3 + 3 dose-escalation design revealed several critical uncertainties, a model-based approach was implemented to better understand these properties. Based on anticipated scenarios for potency and PK nonlinearity, a follow-up study was designed and thoroughly evaluated. Execution of 14,000 virtual trials led to the selection and implementation of a robust design that extended the low-dose range by 200-fold. Modeling of the resulting data demonstrated that pembrolizumab PKs are nonlinear at <0.3 mg/kg every 3 weeks, but linear in the clinical dose range. Saturation of ex vivo target engagement in blood began at ≥1 mg/kg every 3 weeks, and a steady-state dose of 2 mg/kg every 3 weeks was needed to reach 95% target engagement, supporting examination of 2 mg/kg every 3 weeks in ongoing trials in melanoma and other advanced cancers.


Figures

Figure 1
Figure 1
Initial pharmacokinetic (PK) and pharmacodynamic (PD) results from part A1 (reprinted with permission from Patnaik A. et al.15). (a) Arithmetic mean ± SE of the concentration‐time profiles of pembrolizumab following intravenous administration at 1, 3, or 10 mg/kg to patients with solid tumors in cycle 1 of parts A and A1 (linear‐log scale). (b) The interleukin 2 (IL‐2) stimulation ratio as a function of plasma concentration of pembrolizumab. The numbers in the circles are subject numbers.
Figure 2
Figure 2
Overview of trial design variations and method for evaluating them. (a) Overview of the three study designs. Each design started with a low dose (0.005 or 0.02 mg/kg) and escalated to either 2 or 10 mg/kg every 3 weeks. Two designs (A and B) differed with respect to the starting dose (0.02 or 0.005 mg/kg, respectively) and the subsequent dose (0.1 mg/kg or 0.06 mg/kg, respectively). In the third design (C), 3 additional patients were included in one group in order to achieve a balanced number per dose level, or 12 patients in total (4 per group), whereas the other designs included 9 patients. For design A, an additional 6 patients per group, and for design B, an additional 4, 6, and 8 patients per group were evaluated to establish the influence of sample size. Thus, the total number of design variations evaluated was seven. (b) Flow chart of design evaluation. With 20 scenarios per design variation, a total number of 140 sets were simulated and reestimated, 100 times each (in total, 14,000 trial simulations). BSV, between‐subject variability; CI, confidence interval; IC50, the concentration of pembrolizumab required to cause 50% inhibition of the IL‐2 stimulation ratio; PK‐PD, pharmacokinetic‐pharmacodynamic, WSV, within‐subject variability.
Figure 3
Figure 3
Pharmacodynamic (PD) observations (symbols by dose) and population‐predicted (solid line) programmed death 1 (PD‐1) receptor modulation as a function of pembrolizumab exposure under the extended dose range. Model‐predicted serum concentrations were used to allow inclusion of all PD observations through interpolation and extrapolation of exposure where no observed values were available. IL‐2, interleukin 2. Reprinted with permission from Patnaik A, et al.15
Figure 4
Figure 4
Dependence of total, linear, and nonlinear clearance on pembrolizumab concentrations. Inset: log‐linear plot. CL, clearance.
Figure 5
Figure 5
(a) Target engagement as a function of concentration at steady state. Percentage of target engagement with a band denoting the 95% confidence interval (95% CI) for an every‐3‐weeks dosing regimen, based on simulations taking into account the uncertainty in the pharmacodynamic parameter estimates. (b) Probability (percentage of subjects within a simulated population) of achieving 95% target engagement at trough for different doses given every 3 weeks.

References

    1. Pardoll, D.M. The blockade of immune checkpoints in cancer immunotherapy. Nat. Rev. Cancer 12, 252–264 (2012). - PMC - PubMed
    1. McDermott, D.F. & Atkins, M.B. PD‐1 as a potential target in cancer therapy. Cancer Med. 2, 662–673 (2013). - PMC - PubMed
    1. Ishida, Y. , Agata, Y. , Shibahara, K. & Honjo, T. Induced expression of PD‐1, a novel member of the immunoglobulin gene superfamily, upon programmed cell death. EMBO J. 11, 3887–3895 (1992). - PMC - PubMed
    1. Nishimura, H. , Nose, M. , Hiai, H. , Minato, N. & Honjo, T. Development of lupus‐like autoimmune diseases by disruption of the PD‐1 gene encoding an ITIM motif‐carrying immunoreceptor. Immunity 11, 141–151 (1999). - PubMed
    1. Drake, C.G. , Jaffee, E. & Pardoll, D.M. Mechanisms of immune evasion by tumors. Adv. Immunol. 90, 51–81 (2006). - PubMed

Publication types

MeSH terms