. 2017 Jan;6(1):11-20.
doi: 10.1002/psp4.12130. Epub 2016 Nov 8.

Translational Pharmacokinetic/Pharmacodynamic Modeling of Tumor Growth Inhibition Supports Dose-Range Selection of the Anti-PD-1 Antibody Pembrolizumab

Affiliations

Translational Pharmacokinetic/Pharmacodynamic Modeling of Tumor Growth Inhibition Supports Dose-Range Selection of the Anti-PD-1 Antibody Pembrolizumab

A Lindauer et al. CPT Pharmacometrics Syst Pharmacol. 2017 Jan.

Abstract

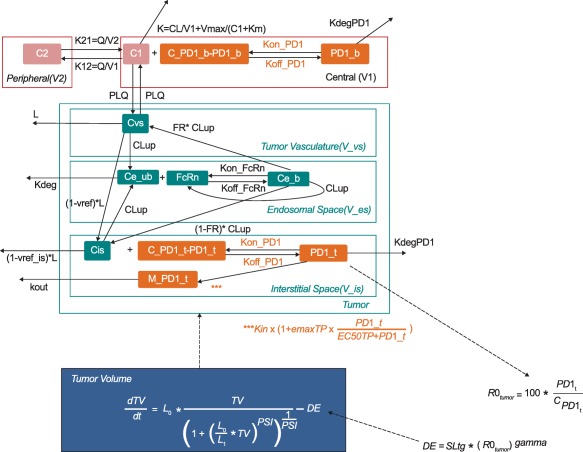
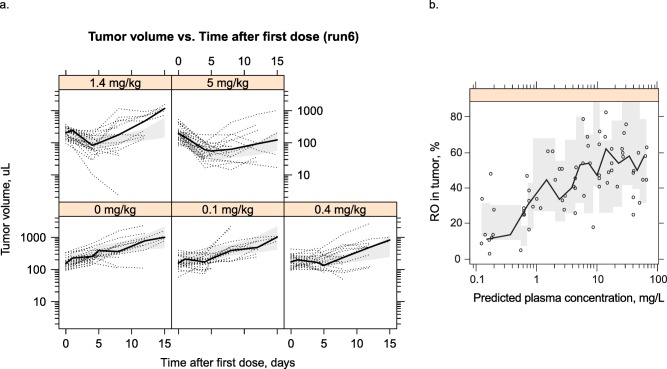
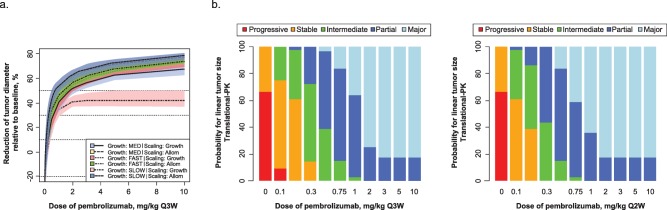
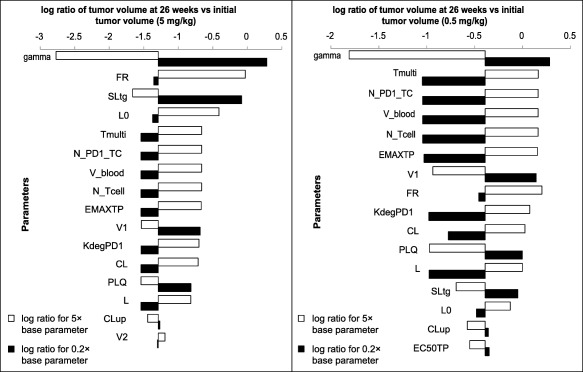
Pembrolizumab, a humanized monoclonal antibody against programmed death 1 (PD-1), has a manageable safety profile and robust clinical activity against advanced malignancies. The lowest effective dose for evaluation in further dose-ranging studies was identified by developing a translational model from preclinical mouse experiments. A compartmental pharmacokinetic model was combined with a published physiologically based tissue compartment, linked to receptor occupancy as the driver of observed tumor growth inhibition. Human simulations were performed using clinical pharmacokinetic data, literature values, and in vitro parameters for drug distribution and binding. Biological and mathematical uncertainties were included in simulations to generate expectations for dose response. The results demonstrated a minimal increase in efficacy for doses higher than 2 mg/kg. The findings of the translational model were successfully applied to select 2 mg/kg as the lowest dose for dose-ranging evaluations.


Figures

Figure 1
Figure 1
PK/PD model. Parameters are described in Table 1. State variables are abbreviated as follows: C1 = pembrolizumab concentration in the central compartment; C2 = pembrolizumab concentration in the peripheral compartment; PD‐1_b = pembrolizumab: PD‐1 complex; C_PD‐1_b = total PD‐1 receptor concentration in blood; Cvs = pembrolizumab concentration in the vasculature; Ce_ub = concentration of unbound pembrolizumab in the endosomal space; FcRn = Fc receptor levels; Ce_b = pembrolizumab:PD‐1 complex in the endosomal space; Cis = pembrolizumab concentrations in the interstitial space; C_PD‐1_t = total PD‐1 concentration in the tumor; C_PD‐1_b = total PD‐1 concentration in blood; PD‐1_t = pembrolizumab:PD‐1 complex in the tumor; PD‐1_b = pembrolizumab:PD‐1 complex in blood; M_PD‐1_t = amount of PD‐1 receptors in the tumor; Vmax = maximum elimination rate of the saturable pathway; V1 = volume of distribution in the central compartment; V2 = volume of distribution in the central compartment; Km = Michaelis–Menten constant; V_es = endosomal space of the vascular epithelial cells.
Figure 2
Figure 2
(a) Visual predictive check of tumor volume. Black circles: observations; black line: median of observations; gray area: 90% confidence interval of the median prediction. (b) Receptor occupancy (RO) in tumor vs. plasma concentration of DX400 plotted on a logarithmic scale. Symbols: observations; black line connects median of observations in each bin; shaded gray area: 90% confidence interval around the median prediction.
Figure 3
Figure 3
(a) Simulated tumor response in melanoma (percentage change from baseline diameter) following treatment with pembrolizumab (once every 3 weeks) over 6 months for the six scenarios for melanoma using the fast, medium (MED), and slow growth rates, scaled using two different methods each (see Methods for details). Confidence intervals per scenario are derived on the basis of bootstrap analysis and represent the uncertainty for a typical individual. Allom, allometric. (b) Probability of tumor response of a certain size in melanoma. For each dose level, Monte Carlo simulations were performed taking into account the uncertainty in model parameters, as well as uncertainty in the scaling of the tumor growth/shrinkage. The change from baseline for each simulation replicate was categorized in a manner analogous to RECIST v1.1 (left panel, Q3W; right panel, Q2W).
Figure 4
Figure 4
Tornado plot showing the top 16 parameters that have the greatest effect on percentage change from baseline in tumor volume at 26 weeks either with 5× or 0.2× the base parameter value for the 5 mg/kg (left) and 0.5 mg/kg (right) doses. The values plotted are the log (base 10) ratio of the tumor volume at 26 weeks vs. the initial tumor volume, so that negative values represent reduction in tumor volume. For the 0.5‐mg/kg dose, the y axis crosses the x axis at −0.39, which is the log ratio for the baseline parameter values. Similarly, for the 5‐mg/kg dose, the y axis crosses the x axis at −1.29, which is the log ratio for the base parameter values.

References

    1. Drake, C.G. , Jaffee, E. & Pardoll, D.M. Mechanisms of immune evasion by tumors. Adv. Immunol. 90, 51–81 (2006). - PubMed
    1. Pardoll, D.M. The blockade of immune checkpoints in cancer immunotherapy. Nat. Rev. Cancer 12, 252–264 (2012). - PMC - PubMed
    1. Ribas, A. Tumor immunotherapy directed at PD‐1. N. Engl. J. Med. 366, 2517–2519 (2012). - PubMed
    1. Disis, M.L. Immune regulation of cancer. J. Clin. Oncol. 28, 4531–4538 (2010). - PMC - PubMed
    1. Hodi, F.S. et al Improved survival with ipilimumab in patients with metastatic melanoma. N. Engl. J. Med. 363, 711–723 (2010). - PMC - PubMed

MeSH terms