Meta-Analysis
. 2016 Dec;34(34):4132-4141.
doi: 10.1200/JCO.2016.68.2955. Epub 2016 Oct 31.

Human Papillomavirus Drives Tumor Development Throughout the Head and Neck: Improved Prognosis Is Associated With an Immune Response Largely Restricted to the Oropharynx

Affiliations
Meta-Analysis

Human Papillomavirus Drives Tumor Development Throughout the Head and Neck: Improved Prognosis Is Associated With an Immune Response Largely Restricted to the Oropharynx

Ankur Chakravarthy et al. J Clin Oncol. 2016 Dec.

Abstract

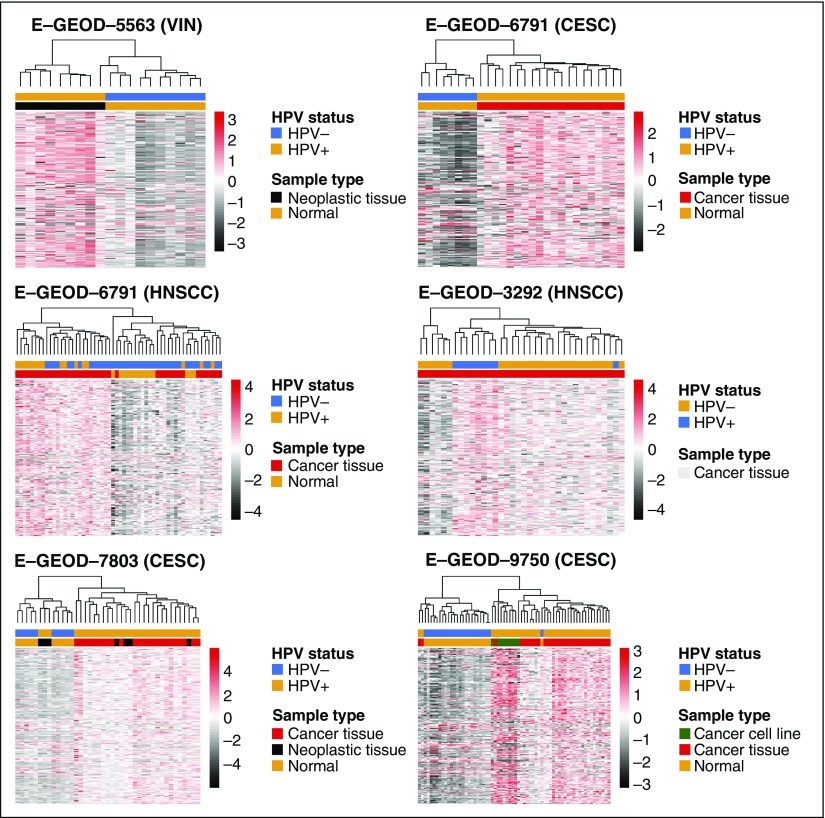
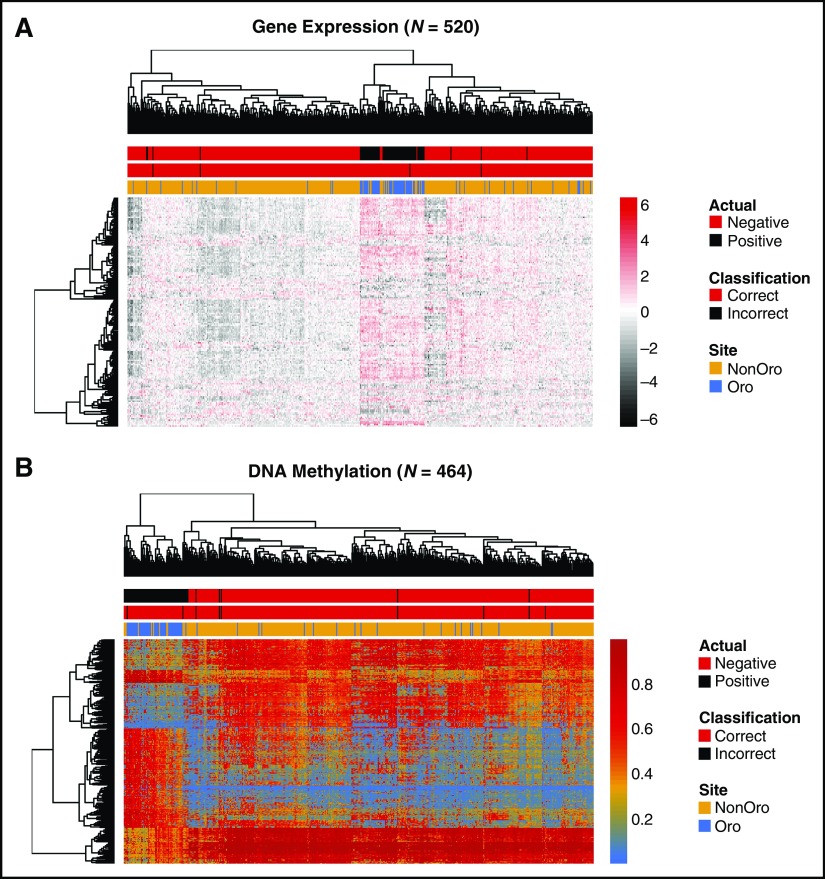
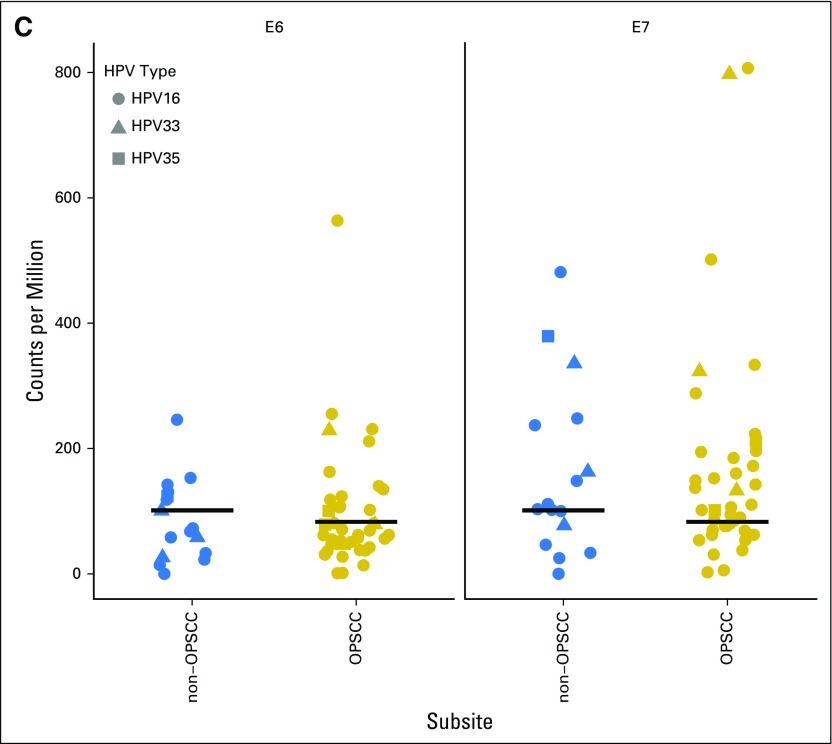
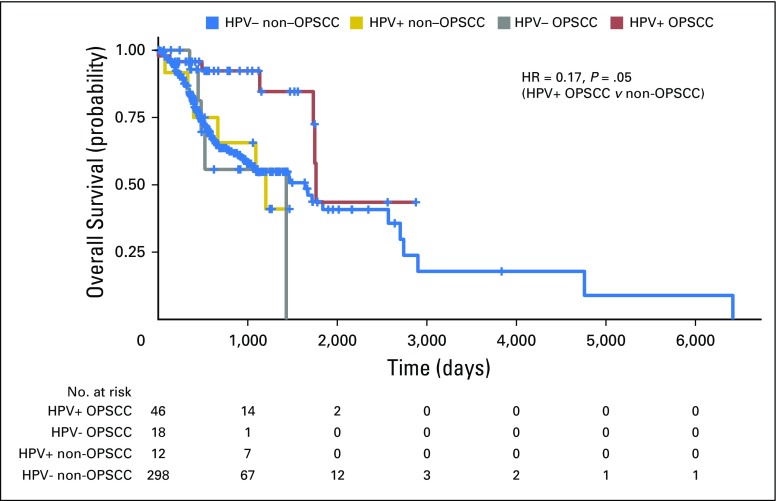
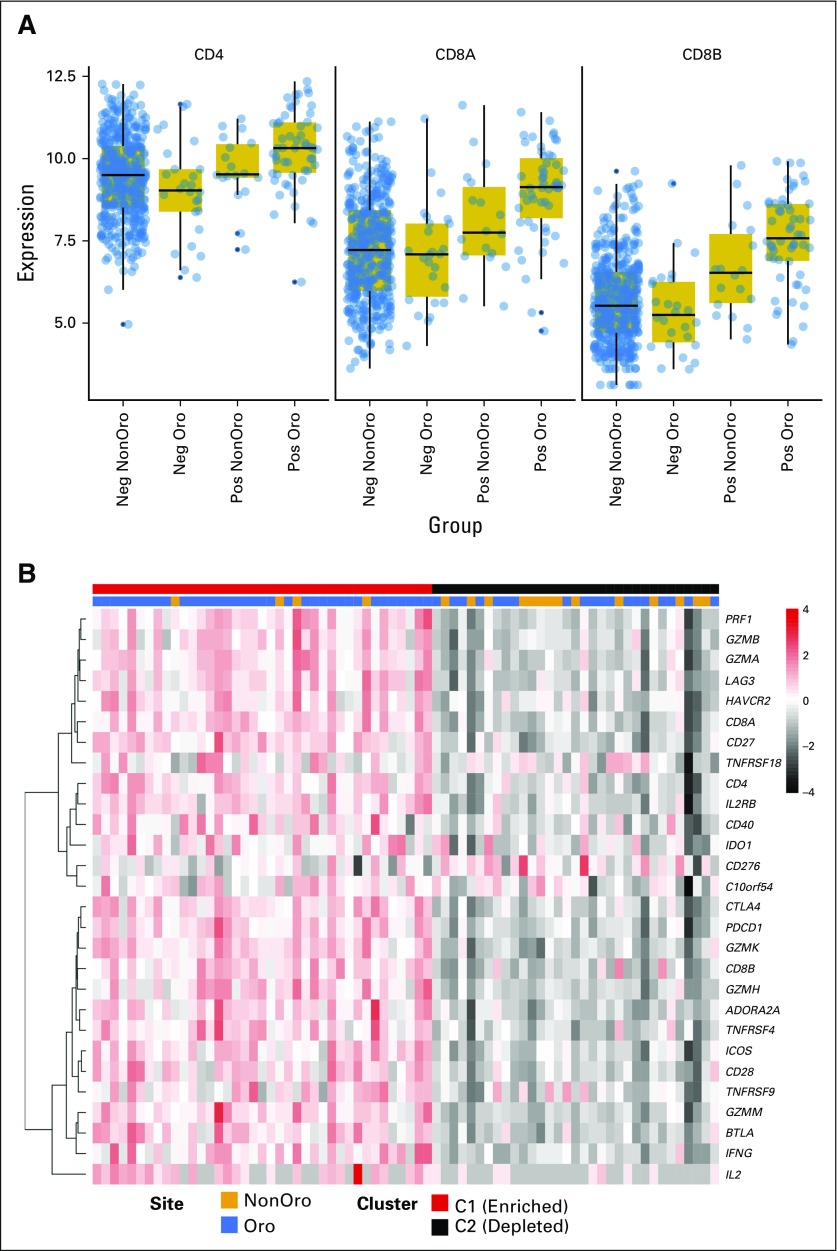
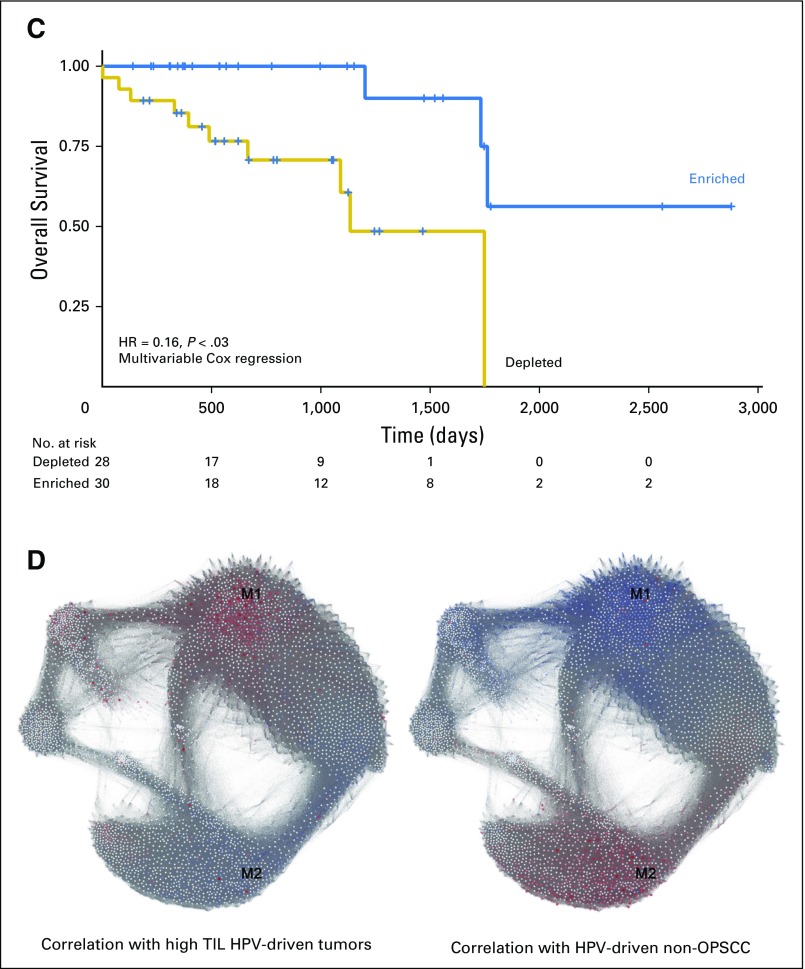
Purpose In squamous cell carcinomas of the head and neck (HNSCC), the increasing incidence of oropharyngeal squamous cell carcinomas (OPSCCs) is attributable to human papillomavirus (HPV) infection. Despite commonly presenting at late stage, HPV-driven OPSCCs are associated with improved prognosis compared with HPV-negative disease. HPV DNA is also detectable in nonoropharyngeal (non-OPSCC), but its pathogenic role and clinical significance are unclear. The objectives of this study were to determine whether HPV plays a causal role in non-OPSCC and to investigate whether HPV confers a survival benefit in these tumors. Methods Meta-analysis was used to build a cross-tissue gene-expression signature for HPV-driven cancer. Classifiers trained by machine-learning approaches were used to predict the HPV status of 520 HNSCCs profiled by The Cancer Genome Atlas project. DNA methylation data were similarly used to classify 464 HNSCCs and these analyses were integrated with genomic, histopathology, and survival data to permit a comprehensive comparison of HPV transcript-positive OPSCC and non-OPSCC. Results HPV-driven tumors accounted for 4.1% of non-OPSCCs. Regardless of anatomic site, HPV+ HNSCCs shared highly similar gene expression and DNA methylation profiles; nonkeratinizing, basaloid histopathological features; and lack of TP53 or CDKN2A alterations. Improved overall survival, however, was largely restricted to HPV-driven OPSCCs, which were associated with increased levels of tumor-infiltrating lymphocytes compared with HPV-driven non-OPSCCs. Conclusion Our analysis identified a causal role for HPV in transcript-positive non-OPSCCs throughout the head and neck. Notably, however, HPV-driven non-OPSCCs display a distinct immune microenvironment and clinical behavior compared with HPV-driven OPSCCs.


Conflict of interest statement

Authors’ disclosures of potential conflicts of interest are found in the article online at www.jco.org. Author contributions are found at the end of this article.

Figures

Fig 1.
Fig 1.
Human papillomavirus (HPV)-driven tumors display a common gene expression signature. Meta-analysis identified 179 probes mapping to 159 gene probes as being significantly differentially expressed between HPV+ tumors and HPV− controls (tumor or normal). Annotations represent sample type data where relevant, and HPV status. CESC, cervical squamous cell carcinoma; HNSCC, squamous cell carcinoma of the head and neck; VIN, vulval intraepithelial neoplasia.
Fig 2.
Fig 2.
Molecular similarities between HPV transcript-positive tumors from different anatomic subsites. Heat maps show clustering of The Cancer Genome Atlas head and neck squamous cell carcinoma tumors using either (A) gene expression data (RNA-seq, n = 520; Illumina, San Diego, CA), on the basis of our 159-gene HPV signature or (B) DNA methylation data (Illumina 450k array, n = 464), on the basis of our 468 methylation variable position signature. Annotation bars indicate HPV status by RNA-seq analysis, OPSCC/non-OPSCC location, and predicted HPV status using our Random Forests classifier. HPV+ tumors generally clustered together, with non-OPSCC HPV+ tumors distributed among HPV+ OPSCCs. The gene expression heat map represents z-scores and the DNA methylation heat map displays β values. (C) Comparison of reads from the bicistronic HPV E6/E7 transcripts in OPSCC and non-OPSCC cases. HPV, human papillomavirus; nonOro, nonoropharyngeal head and neck cancer; OPSCC, oropharyngeal squamous cell carcinoma; Oro, oropharyngeal.
Fig 2.
Fig 2.
Molecular similarities between HPV transcript-positive tumors from different anatomic subsites. Heat maps show clustering of The Cancer Genome Atlas head and neck squamous cell carcinoma tumors using either (A) gene expression data (RNA-seq, n = 520; Illumina, San Diego, CA), on the basis of our 159-gene HPV signature or (B) DNA methylation data (Illumina 450k array, n = 464), on the basis of our 468 methylation variable position signature. Annotation bars indicate HPV status by RNA-seq analysis, OPSCC/non-OPSCC location, and predicted HPV status using our Random Forests classifier. HPV+ tumors generally clustered together, with non-OPSCC HPV+ tumors distributed among HPV+ OPSCCs. The gene expression heat map represents z-scores and the DNA methylation heat map displays β values. (C) Comparison of reads from the bicistronic HPV E6/E7 transcripts in OPSCC and non-OPSCC cases. HPV, human papillomavirus; nonOro, nonoropharyngeal head and neck cancer; OPSCC, oropharyngeal squamous cell carcinoma; Oro, oropharyngeal.
Fig 3.
Fig 3.
Differences in overall survival by HPV status and anatomic subsite. Kaplan-Meier curves display overall survival in The Cancer Genome Atlas cohort for OPSCC (n = 77) and non-OPSCC (n = 432) by HPV status. The table indicates the number of patients still at risk by year. Statistics are from multivariable Cox regression controlling for age, smoking history (more or fewer than 10 pack-years), T stage (T1/2 v T3/4) and N stage (N0-N2a v N2b-N3). HPV, human papillomavirus; HR, hazard ratio; OPSCC, oropharyngeal squamous cell carcinoma.
Fig 4.
Fig 4.
Enhanced lymphocyte infiltration in HPV-driven OPSCC. (A) Variance stabilization transformed mRNA levels of TIL markers CD4, CD8A, and CD8B. Each was significant at a false discover rate < 0.05 (Wilcoxon’s rank-sum test) comparing HPV-driven OPSCC with HPV-driven non-OPSCC. (B) The expression heat map of immune checkpoint gene transcripts highlights a low expression and a moderate/high expression cluster within HPV-driven squamous carcinoma of the head and neck (HNSCC); annotation bars represent anatomic subsite and cluster allocation from consensus clustering. (C) Kaplan-Meier curve of HPV+ HNSCC stratified by TIL status. The table represents the number at risk at the given time points. Statistics are from multivariable Cox regression controlling for age, smoking history (more or fewer than 10 pack-years), subsite, T stage (T1/2 v T3/4) and N stage (N0-N2a v N2b-N3). This also is compared in Table 2. (D) Weighted correlation network analysis network graphs. Each gene is labeled by color according to correlation with the indicated tumor subtype. Red and blue show positive and negative correlation, respectively. HPV, human papillomavirus; Neg, negative; OPSCC: oropharyngeal squamous cell carcinoma; Oro, oropharyngeal; Pos, positive; TIL, tumor-infiltrating lymphocyte.
Fig 4.
Fig 4.
Enhanced lymphocyte infiltration in HPV-driven OPSCC. (A) Variance stabilization transformed mRNA levels of TIL markers CD4, CD8A, and CD8B. Each was significant at a false discover rate < 0.05 (Wilcoxon’s rank-sum test) comparing HPV-driven OPSCC with HPV-driven non-OPSCC. (B) The expression heat map of immune checkpoint gene transcripts highlights a low expression and a moderate/high expression cluster within HPV-driven squamous carcinoma of the head and neck (HNSCC); annotation bars represent anatomic subsite and cluster allocation from consensus clustering. (C) Kaplan-Meier curve of HPV+ HNSCC stratified by TIL status. The table represents the number at risk at the given time points. Statistics are from multivariable Cox regression controlling for age, smoking history (more or fewer than 10 pack-years), subsite, T stage (T1/2 v T3/4) and N stage (N0-N2a v N2b-N3). This also is compared in Table 2. (D) Weighted correlation network analysis network graphs. Each gene is labeled by color according to correlation with the indicated tumor subtype. Red and blue show positive and negative correlation, respectively. HPV, human papillomavirus; Neg, negative; OPSCC: oropharyngeal squamous cell carcinoma; Oro, oropharyngeal; Pos, positive; TIL, tumor-infiltrating lymphocyte.

References

    1. Doorbar J, Quint W, Banks L, et al. The biology and life-cycle of human papillomaviruses. Vaccine. 2012;30(suppl 5):F55–F70. - PubMed
    1. Goon PK, Stanley MA, Ebmeyer J, et al. HPV & head and neck cancer: A descriptive update. Head Neck Oncol. 2009;1:36. - PMC - PubMed
    1. Gillison ML, Chaturvedi AK, Anderson WF, et al. Epidemiology of human papillomavirus-positive head and neck squamous cell carcinoma. J Clin Oncol. 2015;33:3235–3242. - PMC - PubMed
    1. Chaturvedi AK, Engels EA, Pfeiffer RM, et al. Human papillomavirus and rising oropharyngeal cancer incidence in the United States. J Clin Oncol. 2011;29:4294–4301. - PMC - PubMed
    1. Ang KK, Harris J, Wheeler R, et al. Human papillomavirus and survival of patients with oropharyngeal cancer. N Engl J Med. 2010;363:24–35. - PMC - PubMed

Publication types

Substances