. 2016 Nov 17;167(5):1229-1240.e15.
doi: 10.1016/j.cell.2016.10.046.

Decoding Mammalian Ribosome-mRNA States by Translational GTPase Complexes

Affiliations

Decoding Mammalian Ribosome-mRNA States by Translational GTPase Complexes

Sichen Shao et al. Cell. .

Abstract

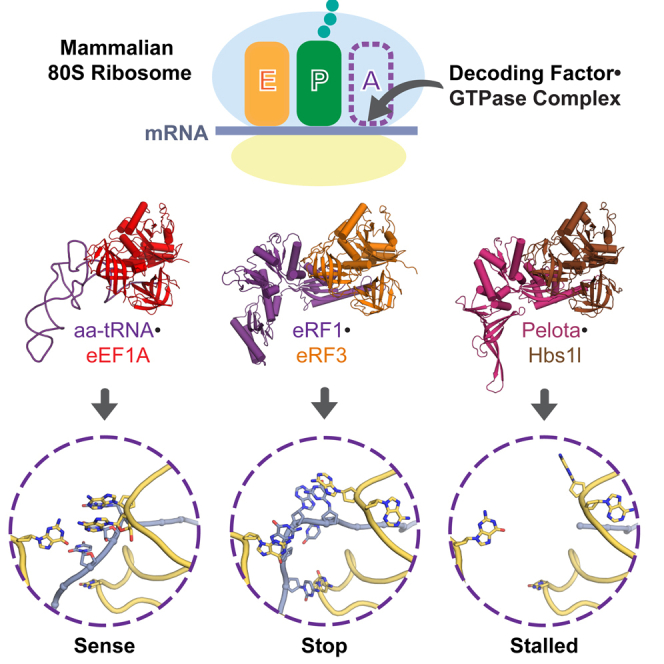
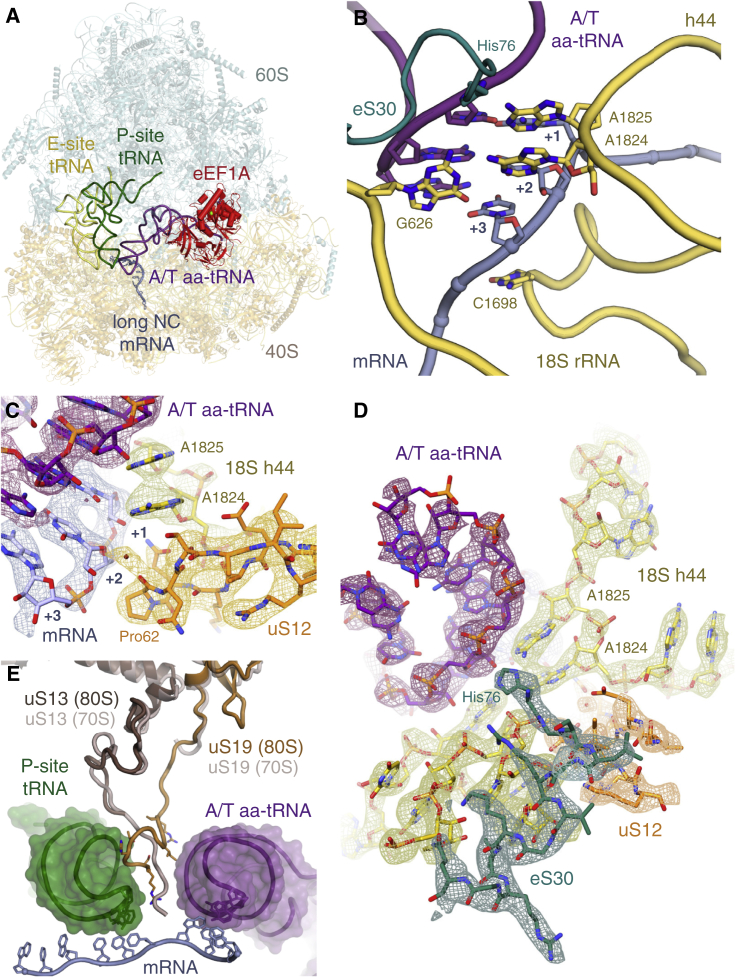
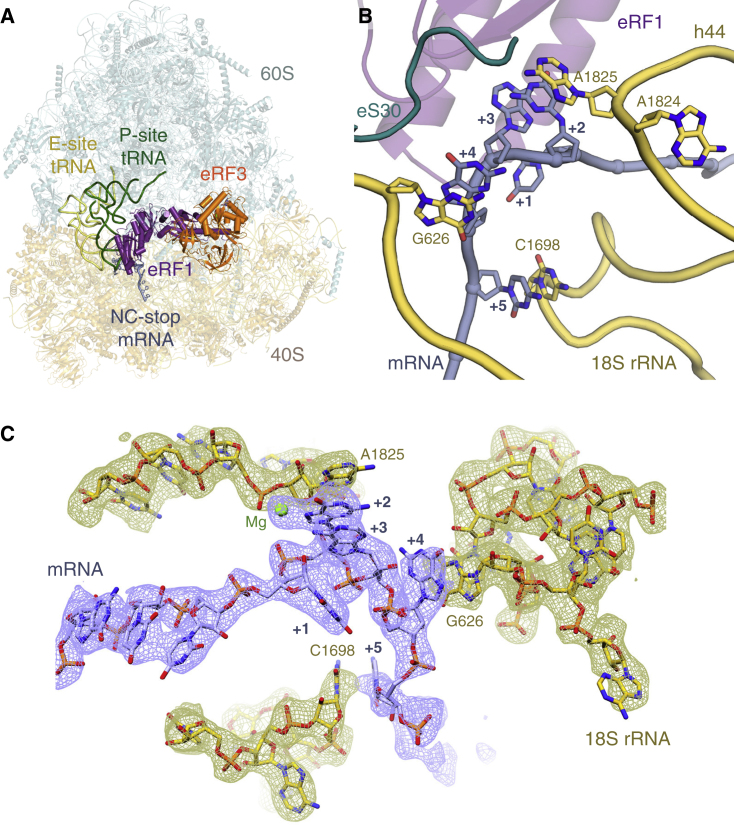
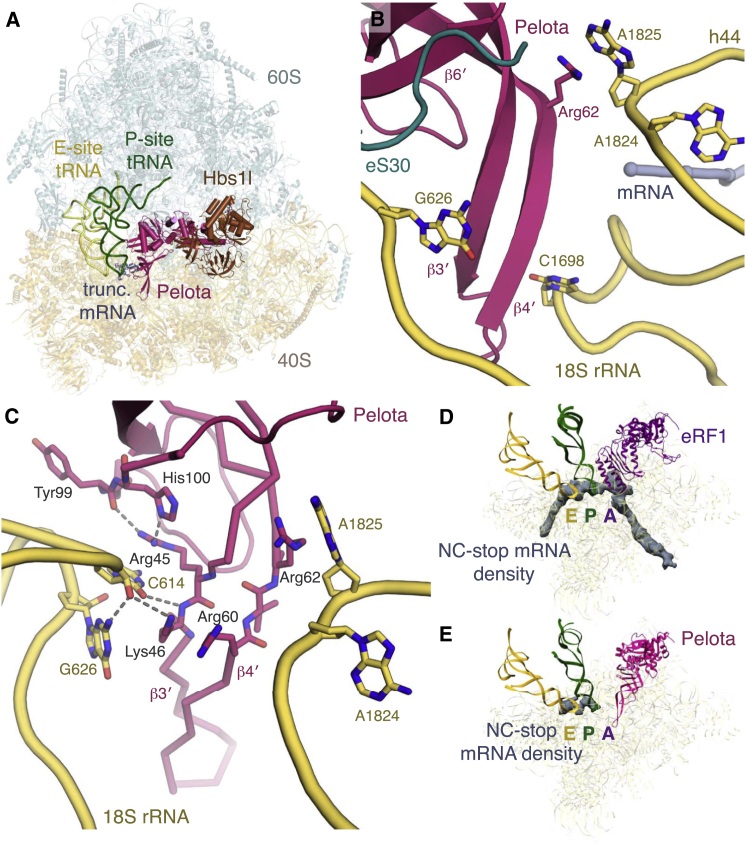
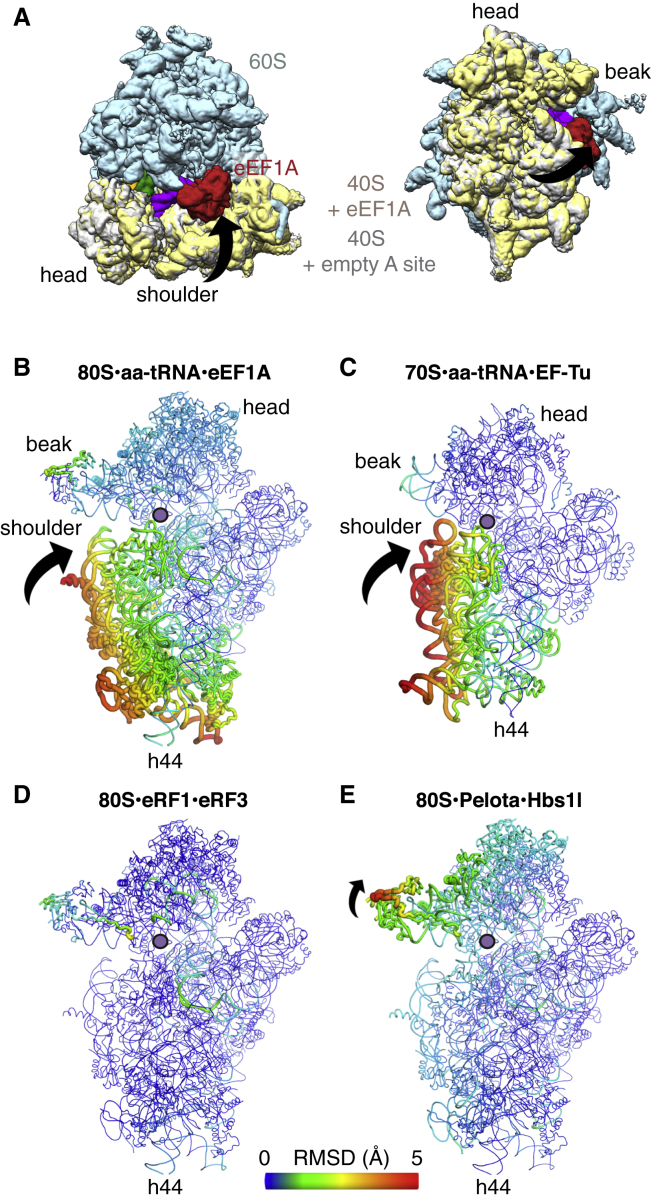
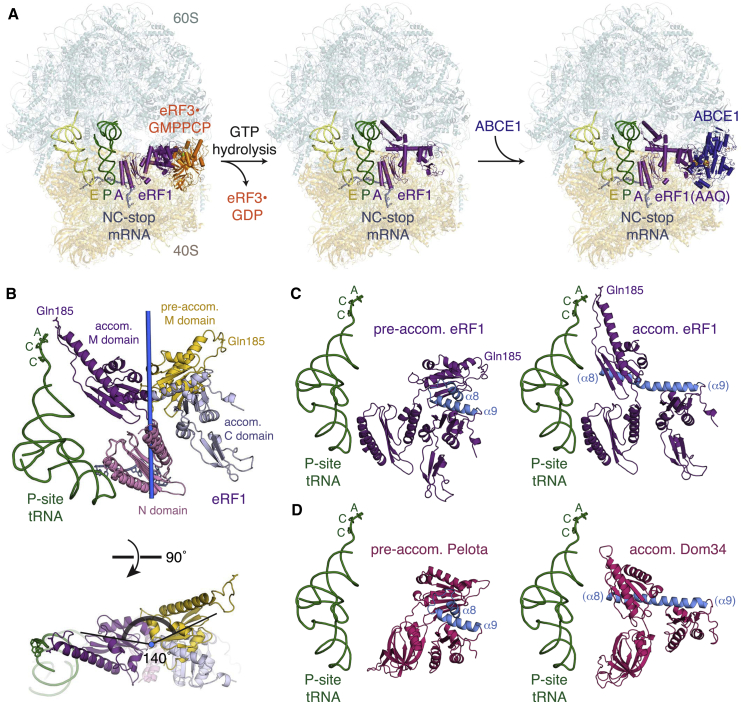
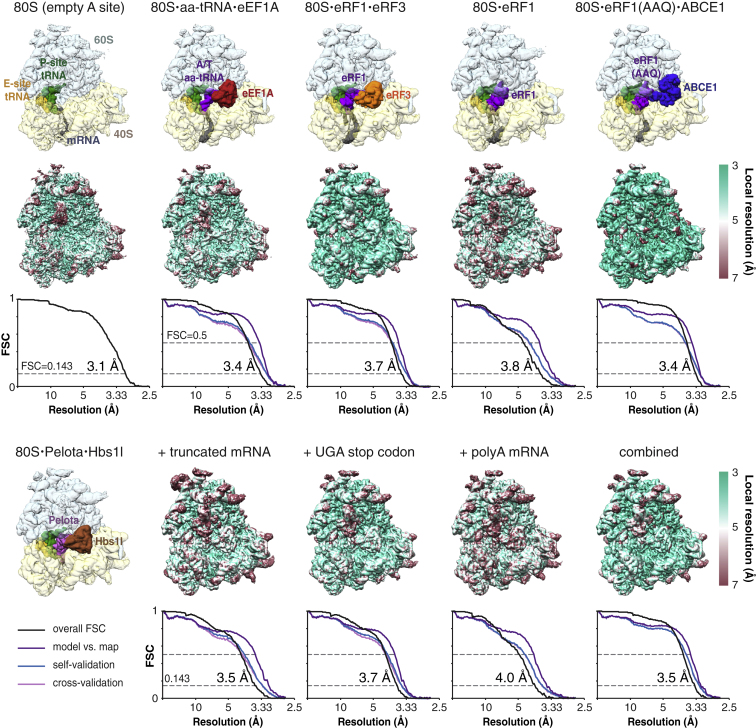
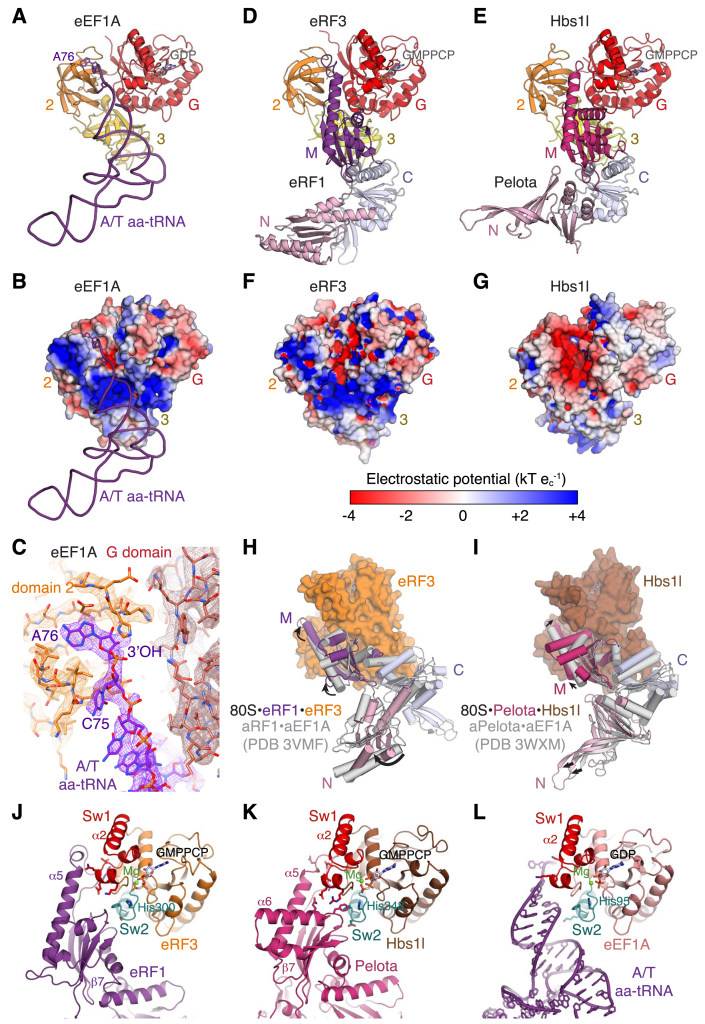
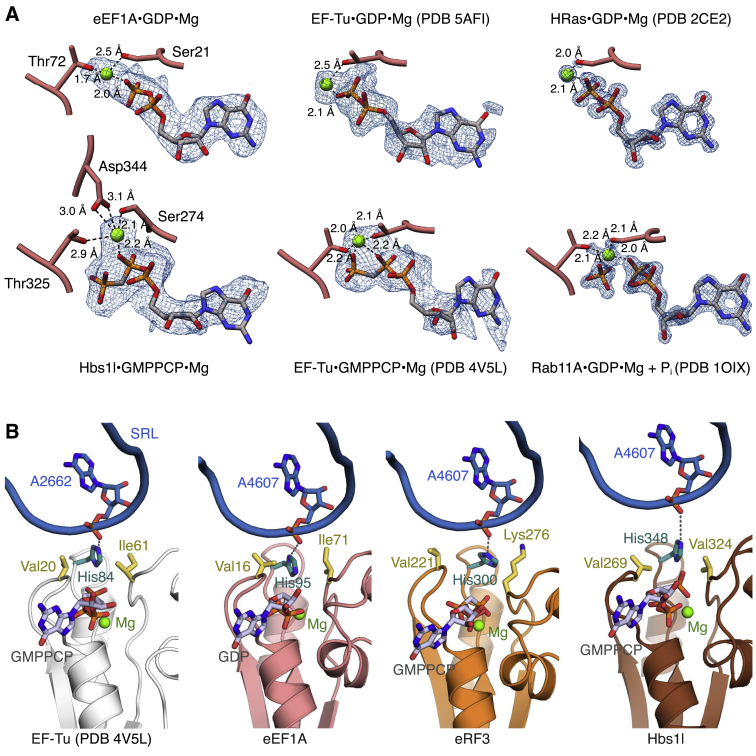
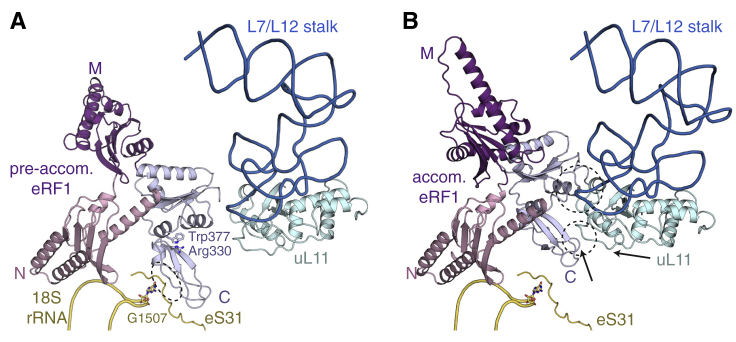
In eukaryotes, accurate protein synthesis relies on a family of translational GTPases that pair with specific decoding factors to decipher the mRNA code on ribosomes. We present structures of the mammalian ribosome engaged with decoding factor⋅GTPase complexes representing intermediates of translation elongation (aminoacyl-tRNA⋅eEF1A), termination (eRF1⋅eRF3), and ribosome rescue (Pelota⋅Hbs1l). Comparative analyses reveal that each decoding factor exploits the plasticity of the ribosomal decoding center to differentially remodel ribosomal proteins and rRNA. This leads to varying degrees of large-scale ribosome movements and implies distinct mechanisms for communicating information from the decoding center to each GTPase. Additional structural snapshots of the translation termination pathway reveal the conformational changes that choreograph the accommodation of decoding factors into the peptidyl transferase center. Our results provide a structural framework for how different states of the mammalian ribosome are selectively recognized by the appropriate decoding factor⋅GTPase complex to ensure translational fidelity.

Keywords: cryo-EM; mRNA decoding; mammalian ribosome; protein translation; translational GTPase.


Figures

None
Graphical abstract
Figure 1
Figure 1
Structure of the Mammalian Elongation Complex (A) Overview of the elongation complex comprising the large (60S) and small (40S) ribosomal subunits, P- (green) and E-site (gold) tRNAs, mRNA (slate), aminoacyl-tRNA in the A/T state (aa-tRNA; purple), and eEF1A (red). (B) Decoding center of the elongation complex. eS30 (teal) and the decoding nucleotides of 18S rRNA (yellow) are indicated. (C) EM map density and models of the interactions within the decoding center of the elongation complex. Decoding nucleotides of 18S rRNA (yellow), aa-tRNA (purple), the A-site codon (+1 to +3) of mRNA (slate), and uS12 (orange) are indicated. (D) Density and models of the interaction between His76 of the N terminus of eS30 (teal) within the decoding center of the elongation complex. In panels (C) and (D), density for mRNA, tRNA, and rRNA is contoured at 9σ; density for uS12 and eS30 is contoured at 5σ. (E) The C termini of uS19 (bronze) and uS13 (brown) of the mammalian (80S) elongation complex compared to the homologous proteins in a 70S bacterial elongation complex (gray, PDB: 4V51), showing the potential interactions of the C terminus of uS19 in mammals or uS13 in bacteria with the anticodon stem loops of A/T aa-tRNA (purple) and P-site tRNA (green). See also Figures S1, S2, S3, and S4.
Figure 2
Figure 2
Structure of the Mammalian Termination Complex (A) Overview of the termination complex assembled with eRF1 (purple) and eRF3 (orange). (B) Decoding center of the termination complex. (C) EM map density (contoured at 6σ) and model showing interactions of the mRNA containing the UGA stop codon (slate) with rRNA elements of the decoding center (yellow).
Figure 3
Figure 3
Structure of the Mammalian Rescue Complex (A) Overview of the rescue complex assembled with Pelota (pink) and Hbs1l (brown). (B) Decoding center of the rescue complex. (C) Hydrogen-bonding interactions between the β3′-β4′ loop of Pelota (pink) and 18S rRNA nucleotides (yellow). (D and E) Density corresponding to mRNA in the (D) termination or (E) rescue complexes both assembled on the same (NC-stop) mRNA stalled with the UGA stop codon in the A site. The ribosomal small subunit, P- and E-site tRNAs, and eRF1 or Pelota are indicated.
Figure 4
Figure 4
Conformational Responses of the Ribosome to Decoding Complexes (A) EM map of the elongation complex (colored) superposed on a ribosome with an empty A site (gray small subunit), demonstrating the movement corresponding to domain closure (illustrated by the arrow). The shoulder region of the small subunit moves toward the large subunit, which maximizes the contacts between a translational GTPase and the ribosome, particularly with the GTPase center. (B–E) Worm diagrams colored by pairwise root-mean-square deviation (RMSD) of the small subunits of (B) the elongation complex relative to a ribosome with an empty A site, (C) of a bacterial elongation complex (PDB: 5AFI) relative to an empty ribosome (PDB: 4UY8), and of the (D) termination and (E) rescue complexes relative to the same reference as in (B). The directions of movements are indicated by arrows. The A site is indicated with a purple dot.
Figure 5
Figure 5
The Didemnin B Binding Site (A) Chemical structure of didemnin B. (B) Fit of the model of didemnin B (blue) to the EM map density contoured at 5σ. (C) Didemnin B binds at the interface between the G domain (red) and domain 3 (yellow) of eEF1A. Domain 2 is shown in orange. Relative to the eEF1A crystal structure (PDB: 4C0S; gray), the β15-β16 hairpin packs against didemnin B. (D) Didemnin B occupies a hydrophobic pocket of eEF1A (orientated as in C), which corresponds to the binding site for kirromycin (green) on EF-Tu. (E) Hydrogen-bonding interactions between didemnin B (blue) and eEF1A (pink). See also Figures S5 and S6.
Figure 6
Figure 6
Interactions between the GTPase and the Ribosome (A) Comparison of the switch 1 loop (red) of eEF1A (pink) in the elongation complex with the EF-Tu switch 1 loop (teal) in the presence of GMPPCP (PDB: 4V5L) (left). The switch 1 (Sw1) loop interacts with proteins and rRNA from both the large (blue) and small (yellow) subunits of the ribosome (right). (B) EM map density and model of the interactions between the eEF1A switch 1 loop (red) with rRNA and proteins of the large (blue) and small (yellow) subunit. Density for rRNA is contoured at 9σ; density for eEF1A and uL14 is contoured at 5σ. (C) Sequence alignment of the switch 1 loop region of selected translational GTPases.
Figure 7
Figure 7
Conformational Changes during Accommodation (A) Structures of ribosomal complexes representing intermediates along the eukaryotic translation termination pathway. (B) The accommodated M domain (purple) of eRF1 is rotated by 140° relative to the pre-accommodated state (yellow). Gln185 of the catalytic GGQ motif, P-site tRNA (green), the N domains in both states (pink), the C domain (pale blue) in the accommodated state, and the axis of M domain rotation (blue) are shown. (C) Comparison of eRF1 (purple) in a pre-accommodated state (left) with an accommodated (right) conformation, showing straightening of α8 and α9 (blue) into a continuous helix upon accommodation. (D) Comparison of Pelota (pink) in a pre-accommodated state (left) with Dom34 (pink) in an accommodated (right) state (right; PDB: 3IZQ), revealing straightening of α8 and α9 (blue). See also Figure S7.
Figure S1
Figure S1
Isolation of Translational Decoding Complexes for Cryo-EM, Related to Figure 1 (A) Schematic of the mRNA constructs used for in vitro translation and isolation of ribosome-nascent chain complexes (RNCs). The start codon (AUG), stop codon (UAG or UGA), and coding regions for the 3X Flag tag (green), the autonomously-folding villin headpiece (VHP) domain (blue), the cytosolic portion of Sec61β (orange), and KRas (purple) are indicated. (B) Experimental strategies for isolating the indicated RNCs from in vitro translation (IVT) reactions. (C) SDS-PAGE and Coomassie staining of isolated RNCs representing the elongation complex (80S⋅aa-tRNA⋅eEF1A); pre-accommodated (80S⋅eRF1⋅eRF3) or accommodated (80S⋅eRF1) termination complexes; and rescue complex (80S⋅Pelota⋅Hbs1l) reconstituted with a truncated mRNA (see panel A). Copurified, exogenously-added, and ribosomal (ribo. prot.) proteins are indicated. (D) The long NC construct (see panel A) was translated in vitro in rabbit reticulocyte lysate (RRL) with the indicated translational inhibitors added at the following concentrations: 50 μg/mL cycloheximide (CHX), 10 μM anisomycin, 200 μM emetine, and 50 μM didemnin B. The translation reactions were affinity purified via the 3X Flag tag on the nascent chain. The elutions and inputs were analyzed by SDS-PAGE and immunoblotting for the indicated proteins, revealing that didemnin B specifically traps eEF1A on the isolated RNCs. (E) The NC-stop construct was translated in vitro in RRL in the presence of 35S-methionine and mutant eRF1(AAQ) to trap RNCs with the UGA stop codon in the A site. The RNCs were isolated under high salt conditions and subjected to affinity purification via the 3X Flag tag on the nascent chain. The isolated RNCs were incubated with 1 mM puromycin or recombinant wild-type eRF1, wild-type eRF3, and 0.5 mM GMPPCP or GTP as indicated, and then directly analyzed by SDS-PAGE and autoradiography. The bands corresponding to ribosome-associated nascent chain-tRNA (NC-tRNA) and released nascent chains (NC) are indicated. This demonstrates the functionality of the components of the reconstituted termination complex in mediating the release of the nascent chain, which is inhibited by the nonhydrolyzable GTP analog, GMPPCP.
Figure S2
Figure S2
Quality of Cryo-EM Maps and Models, Related to Figure 1 The EM map for each isolated RNC complex is shown colored according to individual factors (top row) or by local resolution (second row). Below each local resolution map are Fourier shell correlation (FSC) curves calculated between independent half maps (black), and calculated between the refined model and final map (purple), and with the self (blue) and cross-validated (magenta) correlations for each complex. The nominal resolution estimated from the map-to-map correlation at FSC = 0.143 is reported and agrees well with the model-to-map correlation at FSC = 0.5. The 80S⋅eRF1(AAQ)⋅ABCE1 map was generated by combining all of the datasets from (Brown et al., 2015b) to analyze eRF1 conformational changes during the termination pathway (see Figures 7 and S7).
Figure S3
Figure S3
Secondary Structure Topology Diagrams of Translational GTPases and Decoding Proteins, Related to Figure 1 (A) Topology diagram of the homologous regions of translational GTPases (e.g., eEF1A, eRF3, and Hbs1l), showing the G domain (red) and the two β-barrel domains (orange and yellow). The motifs important for GTP hydrolysis (Switch 1, Switch 2 (Sw2), and P loop) are highlighted. (B) Topology diagrams of eRF1 and Pelota, showing the divergent N domains and homologous M and C domains. The locations of the loop harboring the catalytic GGQ motif (blue) and the minidomain (mini) in eRF1 are indicated.
Figure S4
Figure S4
Decoding Center Interactions, Related to Figure 1 (A) Decoding center interactions of A/T aa-tRNA (purple) in the elongation complex, demonstrating how Gln61 and cis-Pro62 on a loop of uS12 (orange) can interact, via a water molecule or metal ion, with the mRNA (slate) backbone. Decoding nucleotides of 18S rRNA (yellow) are indicated. (B–D) EM map density and model showing that the interactions between eRF1 (purple) and stop codon mRNA (slate) remain unchanged in the (B) pre-accommodated (contoured at 8σ), (C) accommodated (contoured at 7σ), and (D) ABCE1-bound complexes (contoured at 8σ). (E and F) Decoding center interactions of (E) eRF1 (purple) in the termination complex and of (F) Pelota (pink), viewed as in panel (A).
Figure S5
Figure S5
Details of Pre-accommodation Architectures, Related to Figure 5 (A) The acceptor stem of aa-tRNA (purple) binds in a cleft between the G domain (red) and domains 2 (orange) and 3 (yellow) of eEF1A. (B) Surface model of eEF1A colored by electrostatic potential (same view as panel A). (C) EM map density contoured at 7σ and models of the interactions between the 3′ end of aa-tRNA (purple) and domain 2 (orange) and G domain (red) of eEF1A. (D and E) The M domains of (D) eRF1 and (E) Pelota bind their respective GTPase partners in a cleft analogous to where aa-tRNA binds eEF1A. Structures are aligned as in panel (A). (F and G) Surface model colored by electrostatic potential of (F) eRF3, and (G) Hbs1l. (H and I) Superposition of (H) the crystal structure of aRF1⋅aEF1A⋅GTP (gray) on ribosome-bound eRF1⋅eRF3⋅GMPPCP or of (I) the crystal structure of aPelota⋅aEF1A⋅GTP (gray) on ribosome-bound Pelota⋅Hbs1l⋅GMPPCP via domains 2 and 3 of the GTPase. Upon ribosome binding, the N domain of the decoding factor is reoriented, while the M domain forms additional contacts with the G domain of the GTPase. (J and K) Interactions between the M domains of (J) eRF1 or of (K) Pelota with the G domain of the respective GTPase. The β7-α5 loop, which harbors the GGQ motif of eRF1, makes interactions with the Switch 1 (Sw1, red) motif, and additional interactions are formed with the Switch 2 (Sw2, teal) motif harboring the catalytic histidine. (L) The backbone and CCA end of A/T aa-tRNA also interacts with catalytically important motifs of the G domain of eEF1A.
Figure S6
Figure S6
GTPase Active Sites, Related to Figure 5 (A) EM map density and model for GDP and GTP analogs in the indicated structures. eEF1A-bound GDP density is contoured at 7σ; Hbs1l-bound GMPPCP density is contoured at 6σ. Coordinating residues (pink) and magnesium ions (green) are indicated. (B) Interactions of the sarcin-ricin loop (SRL) with the catalytic histidine (teal) of the indicated GTPase. The residues of the hydrophobic gate are indicated in yellow.
Figure S7
Figure S7
Conformational Changes during Decoding Factor Accommodation, Related to Figure 7 (A) The minidomain of pre-accommodated eRF1 (colored by domains) forms an interaction (circled) with eS31 (yellow) that is stabilized by G1507 of 18S rRNA. (B) Upon accommodation, the M (purple) and C (pale blue) domains of eRF1, and the L7/L12 rRNA stalk base (blue) supporting uL11 (light cyan) undergo conformational changes to establish new interactions (circled) between the eRF1 minidomain with uL11 and the L7/L12 stalk base. Arrows indicate the direction and magnitude of movement of the minidomain and uL11 from the pre-accommodated state.

References

    1. Adams P.D., Afonine P.V., Bunkóczi G., Chen V.B., Davis I.W., Echols N., Headd J.J., Hung L.-W., Kapral G.J., Grosse-Kunstleve R.W. PHENIX: A comprehensive Python-based system for macromolecular structure solution. Acta Crystallogr. D Biol. Crystallogr. 2010;66:213–221. - PMC - PubMed
    1. Alksne L.E., Anthony R.A., Liebman S.W., Warner J.R. An accuracy center in the ribosome conserved over 2 billion years. Proc. Natl. Acad. Sci. USA. 1993;90:9538–9541. - PMC - PubMed
    1. Amunts A., Brown A., Bai X.-C., Llácer J.L., Hussain T., Emsley P., Long F., Murshudov G., Scheres S.H.W., Ramakrishnan V. Structure of the yeast mitochondrial large ribosomal subunit. Science. 2014;343:1485–1489. - PMC - PubMed
    1. Andersen G.R., Pedersen L., Valente L., Chatterjee I., Kinzy T.G., Kjeldgaard M., Nyborg J. Structural basis for nucleotide exchange and competition with tRNA in the yeast elongation factor complex eEF1A:eEF1Balpha. Mol. Cell. 2000;6:1261–1266. - PubMed
    1. Andersson D.I., van Verseveld H.W., Stouthamer A.H., Kurland C.G. Suboptimal growth with hyper-accurate ribosomes. Arch. Microbiol. 1986;144:96–101. - PubMed

Publication types