. 2016 Nov 17;167(5):1339-1353.e21.
doi: 10.1016/j.cell.2016.10.043.

A Dietary Fiber-Deprived Gut Microbiota Degrades the Colonic Mucus Barrier and Enhances Pathogen Susceptibility

Affiliations

A Dietary Fiber-Deprived Gut Microbiota Degrades the Colonic Mucus Barrier and Enhances Pathogen Susceptibility

Mahesh S Desai et al. Cell. .

Abstract

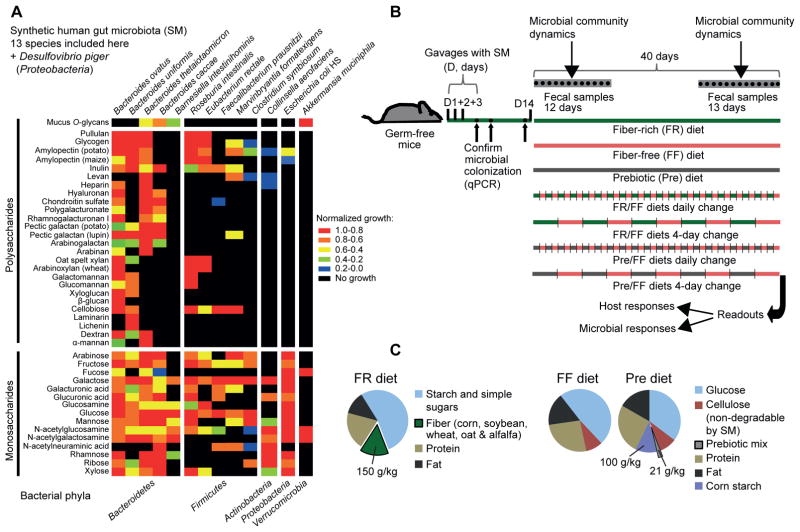
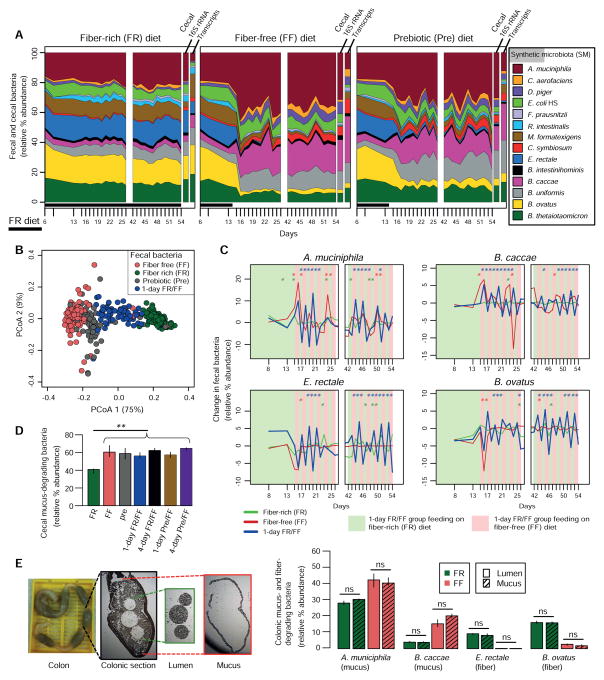
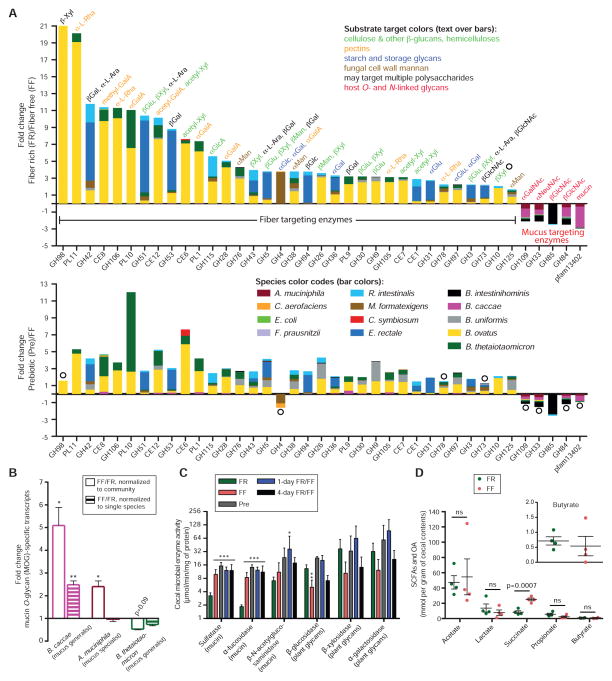
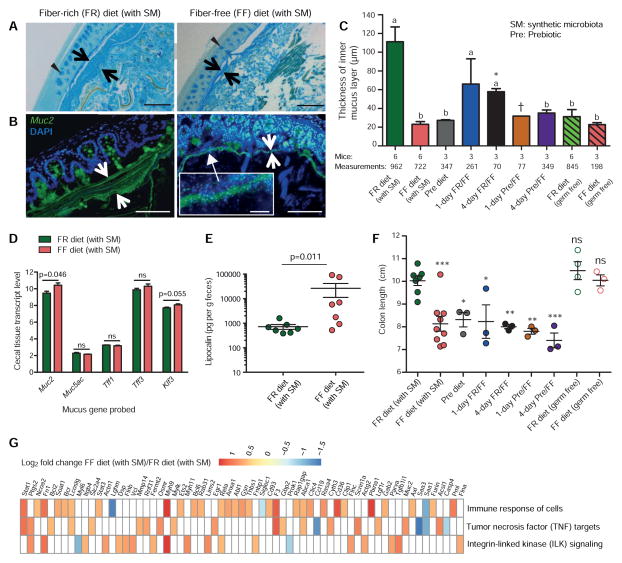
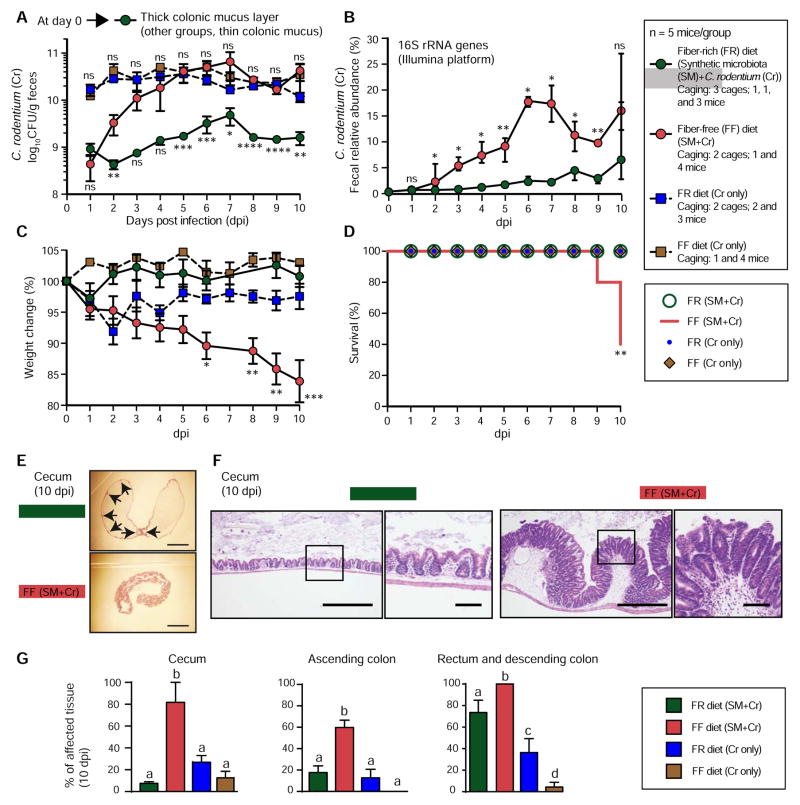
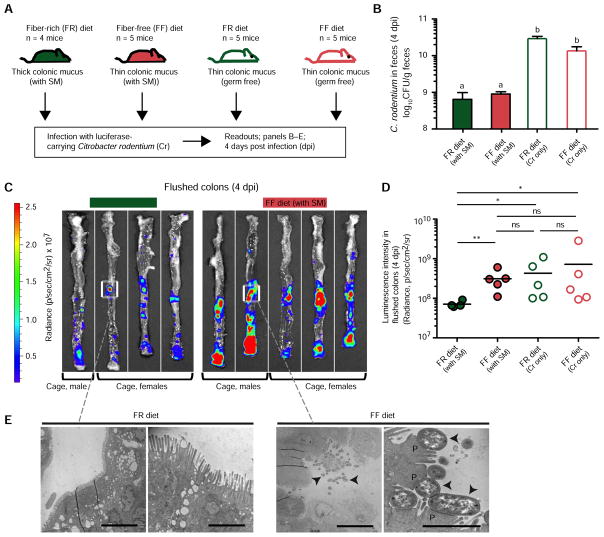
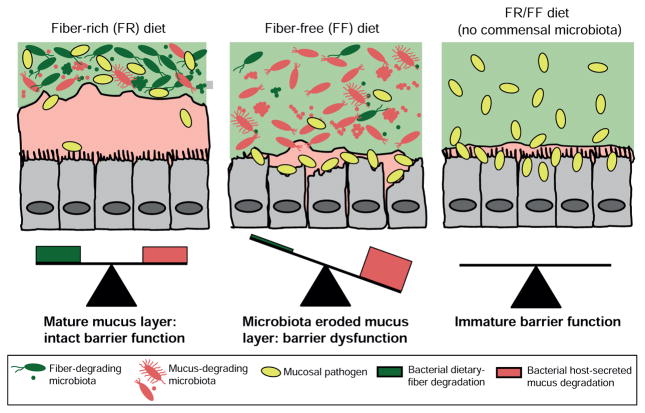
Despite the accepted health benefits of consuming dietary fiber, little is known about the mechanisms by which fiber deprivation impacts the gut microbiota and alters disease risk. Using a gnotobiotic mouse model, in which animals were colonized with a synthetic human gut microbiota composed of fully sequenced commensal bacteria, we elucidated the functional interactions between dietary fiber, the gut microbiota, and the colonic mucus barrier, which serves as a primary defense against enteric pathogens. We show that during chronic or intermittent dietary fiber deficiency, the gut microbiota resorts to host-secreted mucus glycoproteins as a nutrient source, leading to erosion of the colonic mucus barrier. Dietary fiber deprivation, together with a fiber-deprived, mucus-eroding microbiota, promotes greater epithelial access and lethal colitis by the mucosal pathogen, Citrobacter rodentium. Our work reveals intricate pathways linking diet, the gut microbiome, and intestinal barrier dysfunction, which could be exploited to improve health using dietary therapeutics.

Keywords: Akkermansia; Citrobacter rodentium; bacteroides; dietary fiber; gylcans; microbiome; microbiota; mucin; mucus layer; polysaccharides.


Figures

Figure 1
Figure 1. Carbohydrate utilization by the synthetic human gut microbiota (SM) members and gnotobiotic mouse treatments
(A) Heat map showing normalized growth values of 13/14 SM members. (B) Schematic of the gnotobiotic mouse model illustrating the timeline of colonization, feeding strategies and fecal sampling. (C) Compositions of the three distinct diets employed in this study (common additives such as vitamins and minerals are not shown). The prebiotic mix contained equal proportions of 14 host indigestible polysaccharides (see Table S1). See also Fig. S1.
Figure 2
Figure 2. Complex dietary fiber deficiency leads to proliferation of mucus-degrading bacteria
(A) Stream plots exhibiting fecal (over time, Fig. 1B) and cecal (end point) microbial community dynamics and average abundance of total species-specific transcripts from cecal RNA-Seq transcriptome mapping at the endpoint; for transcript abundance n = 3 mice/group. (B) Principal coordinate analysis (PCoA) based on bacterial community similarity. (C) Changes in relative bacterial abundance over time in mice oscillated for 1-day increments between FR and FF feeding. Changes in FR and FF control groups are shown for comparison. Asterisks (colored according to the dietary group) indicate a statistically significant difference in the change of relative abundance from the previous day within each group. Student’s t-test. (D) Additive relative abundances of four mucus-degrading bacteria (Fig. 1A). (E) Relative bacterial abundances in laser capture microdissected colonic lumen and mucus samples (images displayed on left). n = 3 mice/group. Microbial community abundance data are based on Illumina sequencing of 16S rRNA genes (V4 region) and median values at each time point are shown. Unless specified, significance was determined using Kruskal–Wallis test and n = 4 for FR and FF groups, n = 3 for all other groups. All data in Fig. 2A–E is from Experiment 1. See also Figs. S2, S3 and Tables S2, S3.
Figure 3
Figure 3. Diet-specific changes in carbohydrate active enzyme expression reveal a community shift from fiber to mucus degradation
(A) Positive and negative fold-changes in transcripts encoding carbohydrate active enzymes (CAZymes) between either FR/FF (top) or Pre/FF (bottom) comparisons. Only CAZyme families (x-axis) in which >2-fold changes and p < 0.05 (Student’s t-test) were observed for all of the genes in that family in RPKM-normalized cecal community transcriptomes are shown as averages; open circles denote statistically insignificant differences. n = 3 mice/group, Experiment 1. (B) Fold-change values of empirically validated (Table S5), MOG-specific transcripts of three mucus-degrading bacteria. n = 3 mice/group, Experiment 1. Data are shown as average ± SEM. Student’s t-test (C) Activities of cecal enzymes determined by employing p-nitrophenyl-linked substrates. n = 4 for FR and FF groups and n = 3 for other groups, Experiment 1. Data are shown as average ± SD. One-way ANOVA, FR diet group vs. other groups. (D) Concentrations of organic acid (OA, succinate) and short-chain fatty acids (SCFA) determined from cecal contents. n = 4 mice/group; 2 mice/dietary group in two independent experiments (#2A and 3). Student’s t-test. See also Fig. S4, Tables S4, S5, S6.
Figure 4
Figure 4. Microbiota-mediated erosion of the colonic mucus barrier and host responses
(A) Alcian blue-stained colonic sections showing the mucus layer (arrows). Scale bars, 100 μm. Opposing black arrows with shafts delineate the mucus layer that was measured and triangular arrowheads point to pre-secretory goblet cells. (B) Immunofluorescence images of colonic thin sections stained with α-Muc2 antibody and DAPI. Opposing white arrows with shafts delineate the mucus layer. Inset (FF diet group) shows a higher magnification of bacteria-sized, DAPI-stained particles in closer proximity to host epithelium and even crossing this barrier. Scale bars: 100 μm; inset, 10 μm. (C) Blinded colonic mucus layer measurements from Alcian blue stained sections. Mice in the FR and FF fed colonized groups (Experiments 1 and 2A), and in the FR-diet fed germfree groups are from two independent experiments; all other colonized mice are from Experiment 1. Asterisk and dagger indicate that colons of only 2 and 1 mice contained fecal masses, respectively. Data are presented as average ± SEM. Statistically significant differences are annotated with different letters p < 0.01; One-way ANOVA with Tukey’s test. (D) Microarray-derived transcript levels of genes involved in the production of colonic mucus (n = 4 for the FR diet group and n = 3 for the FF diet group). Data are from two independent experiments (#2A and 3). Values are shown as average ± SEM. Student’s t-test. (E) Levels of fecal lipocalin (LCN2) measured by ELISA in the FR and FF diet fed groups (day 50, Figure S6A; Experiment 2A). n = 7 mice/group. Mann-Whitney test. (F) Colon lengths of mice subjected to different dietary treatments. Data for the FR (with SM) and FF (with SM) are representative of 3 independent experiments (Experiments 1, 2A and 3). One-way ANOVA, FR diet group (with SM) vs. other groups. (G) Changes in the host cecal transcriptome between FR and FF diet conditions. Heatmap shows statistically significant fold changes of genes identified from Ingenuity Pathway Analysis (FDR < 0.05 and absolute Log2 Fold-Change > 0.5). n = 4 for the FR diet group and n = 3 for the FF diet group; data are from two independent experiments (#2A and 3). See also Fig. S5 and Table S7.
Figure 5
Figure 5. Fiber-deprived gut microbiota contributes to lethal colitis by Citrobacter rodentium
(A) Fecal C. rodentium levels over time. Data are shown as average ± SEM. Student’s t-test; FR (SM+Cr) group vs. FF (SM+Cr) group (bottom statistics labels) and FR (Cr) vs. FF (Cr) (top statistics labels). Data in Figure 5A–5G are from Experiment 2B. (B) Relative abundance of C. rodentium in fecal samples over time. Data are shown as median ± IQR. Wilcoxon test. (C) Weight changes in the four groups of mice. Values are shown as average ± SEM. One-way ANOVA, FF diet group (with SM) vs. other groups. (D) Survival curves for the four groups of mice. One-way ANOVA with Tukey’s test. (E) Representative images of unflushed ceca after Hematoxylin and Eosin (H/E) staining highlighting major differences in hyperplasia (indicated with arrows in the FR group, where hyperplasia is patchy and infrequent). Scale bars, 5 mm. (F) Images of representative H/E stained colonic thin sections depicting differences in hyperplasia between two groups. Scale bars: low power, 500 μm; high power, 50 μm. (G) Measurements of inflamed tissue area in different intestinal segments. n = 5 mice/group except that n = 4 mice were used for FF (SM+Cr) group. Values are shown as average ± SEM. Statistically significant differences are shown with letters within each intestinal segment; p < 0.0002; One-way ANOVA with Tukey’s test. See also Fig. S6, S7 and Table S2.
Figure 6
Figure 6. Fiber-deprived gut microbiota promotes faster C. rodentium access to the colonic epithelium
(A) Experimental setup for luminescent C. rodentium experiment (Experiment 4). (B) Fecal burdens of C. rodentium at 4 dpi. Data are shown as averages ± SEM; statistically significant differences are shown with different letters (p < 0.001). One-way ANOVA with Tukey’s test. (C) Bioluminescence images of flushed colons showing the location and intensity of adherent C. rodentium colonization. (D) Quantified bioluminescence intensities of C. rodentium from panel C and Fig. S7C. Kruskal-Wallis One-way ANOVA with Dunn’s test. (E) Transmission electron microscopy images of the representative colonic regions from flushed colons; arrowheads denote individual C. rodentium cells and “P” denotes epithelial pedestals in high power/FF image. Scale bars, low power views 10 μm and high power views 2 μm. See also Fig. S7.
Figure 7
Figure 7. Model of how a fiber-deprived gut microbiota mediates degradation of the colonic mucus barrier and heighted pathogen susceptibility
Schemes derived from results shown in Figs. 1–6 illustrating the balance between fiber degradation and mucus degradation in FR diet-fed mice; whereas an FF diet leads to proliferation of mucus-degrading bacteria and microbiota-mediated degradation of the colonic mucus layer. The latter results in more severe colitis by C. rodentium.

Comment in

Similar articles

Cited by

References

    1. Bergstrom KSB, Kissoon-Singh V, Gibson DL, Ma C, Montero M, Sham HP, Ryz N, Huang T, Velcich A, Finlay BB, et al. Muc2 protects against lethal infectious colitis by disassociating pathogenic and commensal bacteria from the colonic mucosa. PLoS Pathog. 2010;6:e1000902. - PMC - PubMed
    1. Brownlee IA, Havler ME, Dettmar PW, Allen A, Pearson JP. Colonic mucus: secretion and turnover in relation to dietary fibre intake. Proc Nutr Soc. 2003;62:245–249. - PubMed
    1. Burkitt DP, Walker ARP, Painter NS. Effect of dietary fibre on stools and transit-times, and its role in the causation of disease. Lancet. 1972;300:1408–1411. - PubMed
    1. Cameron EA, Sperandio V. Frenemies: signaling and nutritional integration in pathogen-microbiota-host interactions. Cell Host Microbe. 2015;18:275–284. - PMC - PubMed
    1. Chassaing B, Koren O, Goodrich JK, Poole AC, Srinivasan S, Ley RE, Gewirtz AT. Dietary emulsifiers impact the mouse gut microbiota promoting colitis and metabolic syndrome. Nature. 2015;519:92–96. - PMC - PubMed

Publication types