. 2016 Nov 17;167(5):1415-1429.e19.
doi: 10.1016/j.cell.2016.10.042.

The Allelic Landscape of Human Blood Cell Trait Variation and Links to Common Complex Disease

William J Astle  1 Heather Elding  2 Tao Jiang  3 Dave Allen  4 Dace Ruklisa  5 Alice L Mann  6 Daniel Mead  6 Heleen Bouman  6 Fernando Riveros-Mckay  6 Myrto A Kostadima  7 John J Lambourne  8 Suthesh Sivapalaratnam  9 Kate Downes  8 Kousik Kundu  10 Lorenzo Bomba  6 Kim Berentsen  11 John R Bradley  12 Louise C Daugherty  13 Olivier Delaneau  14 Kathleen Freson  15 Stephen F Garner  8 Luigi Grassi  8 Jose Guerrero  8 Matthias Haimel  16 Eva M Janssen-Megens  11 Anita Kaan  11 Mihir Kamat  3 Bowon Kim  11 Amit Mandoli  11 Jonathan Marchini  17 Joost H A Martens  11 Stuart Meacham  13 Karyn Megy  13 Jared O'Connell  17 Romina Petersen  8 Nilofar Sharifi  11 Simon M Sheard  18 James R Staley  3 Salih Tuna  19 Martijn van der Ent  11 Klaudia Walter  6 Shuang-Yin Wang  11 Eleanor Wheeler  6 Steven P Wilder  20 Valentina Iotchkova  21 Carmel Moore  3 Jennifer Sambrook  22 Hendrik G Stunnenberg  11 Emanuele Di Angelantonio  23 Stephen Kaptoge  24 Taco W Kuijpers  25 Enrique Carrillo-de-Santa-Pau  26 David Juan  26 Daniel Rico  27 Alfonso Valencia  26 Lu Chen  10 Bing Ge  28 Louella Vasquez  6 Tony Kwan  28 Diego Garrido-Martín  29 Stephen Watt  6 Ying Yang  6 Roderic Guigo  30 Stephan Beck  31 Dirk S Paul  32 Tomi Pastinen  28 David Bujold  28 Guillaume Bourque  28 Mattia Frontini  33 John Danesh  34 David J Roberts  35 Willem H Ouwehand  36 Adam S Butterworth  37 Nicole Soranzo  38
Affiliations

The Allelic Landscape of Human Blood Cell Trait Variation and Links to Common Complex Disease

William J Astle et al. Cell. .

Abstract

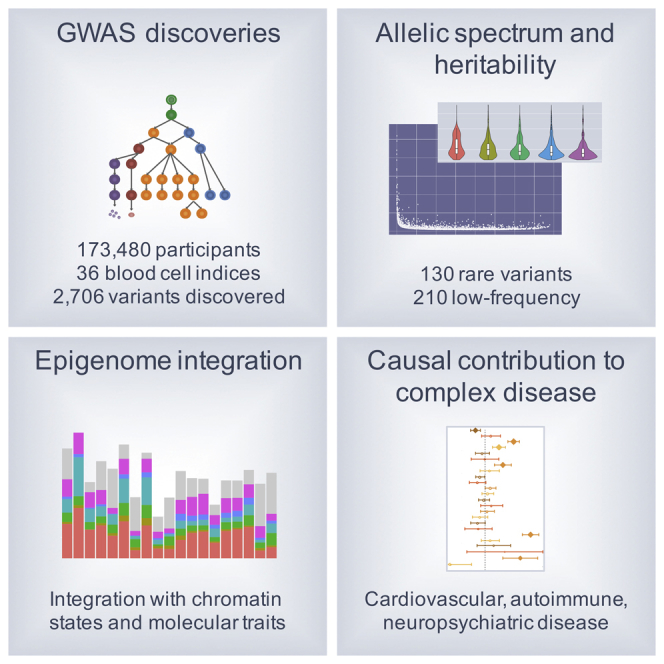
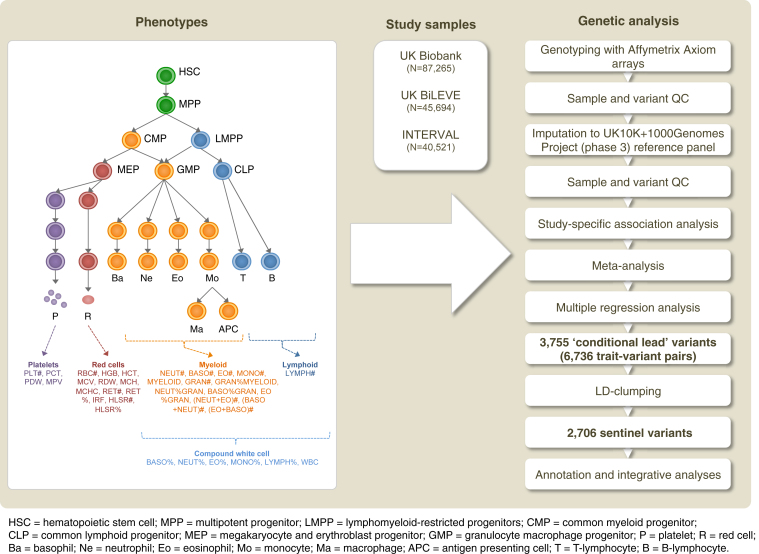
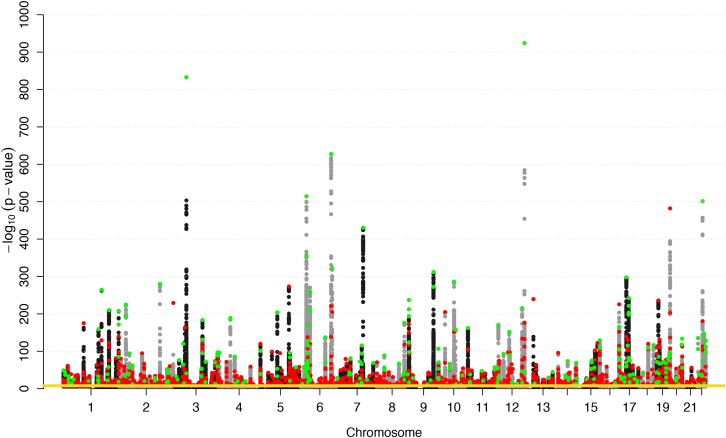
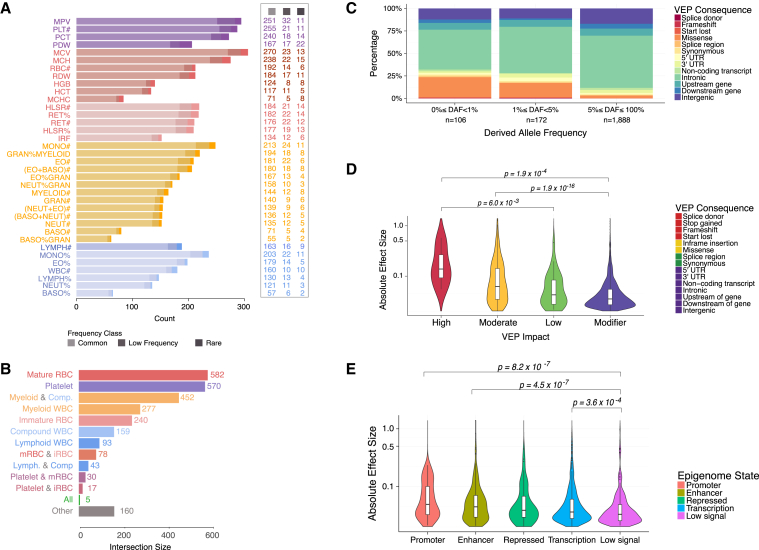
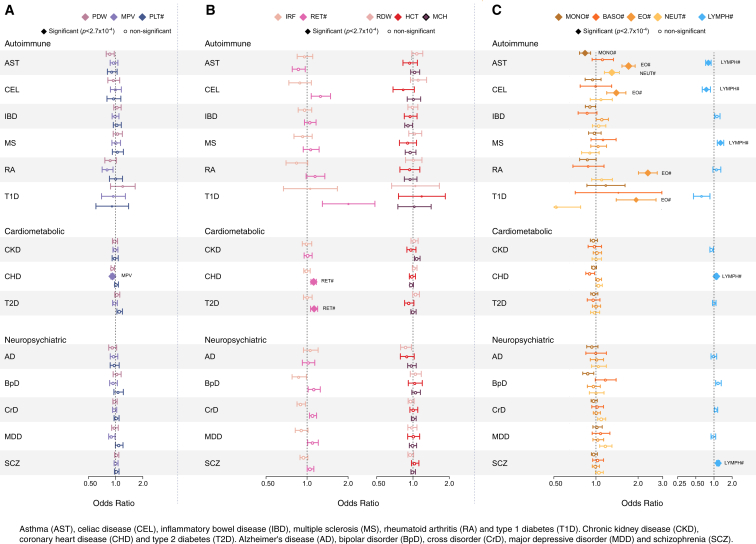
Many common variants have been associated with hematological traits, but identification of causal genes and pathways has proven challenging. We performed a genome-wide association analysis in the UK Biobank and INTERVAL studies, testing 29.5 million genetic variants for association with 36 red cell, white cell, and platelet properties in 173,480 European-ancestry participants. This effort yielded hundreds of low frequency (<5%) and rare (<1%) variants with a strong impact on blood cell phenotypes. Our data highlight general properties of the allelic architecture of complex traits, including the proportion of the heritable component of each blood trait explained by the polygenic signal across different genome regulatory domains. Finally, through Mendelian randomization, we provide evidence of shared genetic pathways linking blood cell indices with complex pathologies, including autoimmune diseases, schizophrenia, and coronary heart disease and evidence suggesting previously reported population associations between blood cell indices and cardiovascular disease may be non-causal.

Keywords: Mendelian randomization; autoimmune diseases; blood; cardiovascular diseases; complex disease; epigenetics; genetics; hematology; hematopoiesis.


Figures

None
Graphical abstract
Figure 1
Figure 1
Study Design for GWAS of Complete Blood Count Indices The phenotypes and their classification by hematopoietic cell type; the study sample sizes; and a summary of the analysis methods employed to identify associated loci. Blood cell index names are defined in Table S1. See also Figures S1 and S2.
Figure 2
Figure 2
Summary of Genetic Associations with the 36 Blood Cell Indices A Manhattan plot summarizing genome-wide phenotypic associations over 36 indices. Each dot corresponds to a variant. Its x coordinate represents its genomic position and its y coordinate represents the maximum -log10 (p value) for association over all phenotypes. Variants with -log10 (p value) <6 have been removed for clarity. The yellow horizontal line at p = 8.31 × 10−9 represents the GWAS significance threshold. Sentinel variants are colored green if their associations (or associations with their proxies) have been previously reported and are colored red otherwise. See also Table S3.
Figure 3
Figure 3
Distribution of Genetic Effects and Variant Consequences (A) Number of conditionally independent genetic associations categorized by blood cell index and by MAF range. (B) Summary of sizes of subsets of sentinel variants categorized by cell types of associated indices, showing that most associations are cell-type-specific. Each bar counts the number of sentinel variants associated with and only with the blood index class(es) shown. (mRBC, Mature RBC; iRBC, Immature RBC; Lymph, Lymphoid WBC; Comp, Compound WBC; All, Intersection of all blood index classes. “Other” counts variants uncounted by the other bars.) See Table S1 for blood index classification. (C) Bar plot showing the proportions of variants categorized by VEP consequence stratified by derived allele frequency (DAF) range. (D and E) Violin plots showing the distribution of the absolute value of the estimated effect size stratified by VEP impact categories (D) or cell-matched chromatin segmentation states (E). p values correspond to Mann-Whitney-Wilcoxon tests comparing the distributions indicated. See also Table S4.
Figure 4
Figure 4
Allelic Architecture of Blood Cell Indices (A) Scatterplot showing the relationship between estimated derived allele frequency (DAF) and the absolute value of the estimated effect size for the sentinel variants. The inset gives the same plot on the logit/log scales. Only associations annotated with an ancestral allele are shown. (B) Scatterplot of LD score estimated heritability (due to common variants) against the (unadjusted) phenotypic variance explained by the conditionally significant variants in a multiple regression model, colored according to index type. (C) A barplot showing the LD score estimated heritability due to common variants (upper limit of gray bars) and the distribution of the unadjusted proportion of phenotypic variance explained (R2) by the conditionally significant variants grouped by genomic location (range of color fills). (D) The same plot for variants grouped by cell-matched chromatin segmentation states. See also Table S4.
Figure 5
Figure 5
Enrichment of Trait Associations within Regulatory Regions Odds ratios (bar heights) and 95% confidence intervals (whiskers) for enrichment of blood-index associations with chromatin segmentation states from blood cells. P values for significance are obtained from a generalized linear model, modeling a threshold on the GWAS test statistic as a Bernoulli response while controlling for MAF, distance from gene, and number of LD proxies. The cell types are shown from left to right in each block as follows: megakaryocyte (i.e., the platelet progenitor, purple), erythroblast (i.e., the red cell progenitor, red), monocyte (orange), eosinophil (orange), neutrophil (orange), naive B cell (light blue), and T cell (light blue). See also Table S4.
Figure 6
Figure 6
Colocalization between Cellular and Molecular Traits (A) Illustrates the models tested using SMR, as well as the number of variants that were significant for both the cellular and molecular trait at a p value threshold of 8.4 × 10−6 that show colocalization (PHEIDI > 0.05) between the cellular and the molecular trait and the overlap of colocalized marks between the four marks across the three cell types. (B and C) Regional plots for the colocalization result in the (B) JAZF1, (C) SLC22A5I and GSDMB loci for monocytes and T cells. The gray squares represent the p value distribution for the corresponding (monocyte and lymphocyte) blood cell index. The black triangles represent the GWAS variant that colocalizes with the eQTL (pink diamond), hQTL (light blue diamonds), and sQTL (gold diamond). The dark blue diamonds represent QTL in the region that do not show colocalization. The crosses represent the regional QTL p value distribution. See also Table S6.
Figure 7
Figure 7
Causal Associations with Common Diseases (A–C) A forest plot showing the results of the multivariable Mendelian randomization (MR) analysis conducted on 13 blood cell indices versus fourteen common diseases. Colored diamonds represent the significant trait-disease association at our Bonferroni corrected p value threshold of 2.7 × 10−4 with uncolored circles denoting non-significant results. Each diamond/circle represents the estimated unconfounded causal odds ratio of disease risk per SD increase of the blood cell index, adjusted for all other blood cell indices tested. The size of the shape is inversely proportional to the SE and the whiskers denote 95% confidence intervals. Forest plots are presented for (A) platelet indices, (B) immature and mature red cell indices, and (C) myeloid and lymphoid white cell indices. See also Table S7.
Figure S1
Figure S1
Adjustment for Technical Covariates Affecting Full Blood Count Measurements, Related to Figure 1, Tables S1 and S2, and the STAR Methods (A) Day averaged measurements of MCV taken from a single instrument over the course of UK Biobank baseline recruitment. The discontinuities may have been generated by calibration of the machine against a variable deterministically related to MCV. Continuous drift is visible within some of the piecewise continuous segments. The left plot is obtained using the raw data while the right plot is obtained using the technically adjusted trait, showing elimination of discontinuities and drift. (B) The effect of the time of day of acquisition on the average measurement of MONO%. Data are taken from a single Coulter instrument over the full UK Biobank baseline recruitment period. The left plot is obtained using the raw data while the right plot is obtained using the technically adjusted trait, showing elimination of the dependence of the mean of MONO% on time of day. (C) Example of the effect of time delay between venipuncture and acquisition on the measurement of the mean white blood cell count. Each point gives the average WBC# for samples acquired during baseline UK Biobank recruitment on a single Coulter instrument during a fifteen minute delay interval. The boundaries of the shaded region interpolate the 95% confidence intervals of the means. The left plot is obtained using the raw data while the right plot is obtained using the WBC# trait data that has been adjusted for the technical covariates. The dependence of the mean cell count on delay time has been eliminated. (D) Percentages of the variance of each UK Biobank measured variable explained by the adjustment for technical covariates and seasonal drift on the relevant adjustment scale. Integer labels show the effective number of additional samples gained from making the technical adjustments, meaning the expected number of additional samples that would be required to obtain equivalent p values in a GWAS for the trait if the adjustment were not made. (E) As for (D) except for INTERVAL.
Figure S2
Figure S2
Adjustments for Sex and for Biological and Environmental Covariates Affecting Full Blood Count Measurements, Related to Figure 1, Tables S1 and S2, and the STAR Methods (A) The dependence of mean neutrophil count on sex and menopause status in the UK Biobank data adjusted for technical effects. The top plot is obtained using the raw data while the bottom plot is obtained adjusting the data for menopause and sex effects showing the elimination of the variance these covariates explain. (B) Day averaged measurements of neutrophil count taken from a single instrument over the course of the UK Biobank baseline recruitment. There is a long run upward drift in the average count over time. Seasonal oscillation in the average counts is also visible. The top plot is obtained using the raw data while the bottom plot is obtained using the technically adjusted data, showing the elimination of drift and seasonal oscillation. (C) Percentage of variance of UK Biobank traits explained (on the relevant adjustment scale) by sex and covariates affecting full blood counts, including age, menopausal status, smoking and alcohol variables. (D) As for (C) except for INTERVAL traits. (E) Illustration of the method used to determine the weight of evidence that heterogeneity in effect sizes across the three studies exceeded a tolerance criterion. The axes represent effect sizes in UK Biobank, INTERVAL and UK BiLEVE. The black dot represents the vector of study specific effect size estimates (βˆUK Biobank,βˆINTERVAL, βˆUK BiLEVE,) for a variant. If the dot lies inside the infinite yellow double-pyramid (defined by three planes intersecting the origin, each normal to one of n1 = (1,−1/4, −1/4), n2 = (−1/4,1, −1/4), n3 = (−1/4,−1/4, 1)) we consider that there is no evidence of between study heterogeneity. If the black dot lies outside the yellow double-pyramid we measure the strength of evidence for heterogeneity as the distance between the black dot and the nearest point on the surface of the pyramid (red dot), with distances scaled to account for the standard errors of the study specific estimators. The nearest point on the pyramid is thus defined as the point in the smallest confidence surface for the estimators that intersects the pyramid (blue ellipsoid). We thresholded the distance score at 5.2 and filtered all variant-blood index pairs exceeding the score from further analysis.
Figure S3
Figure S3
Quality Control of Genetic Data for UK Biobank, UK BiLEVE, and INTERVAL, Related to the STAR Methods Workflow describing QC steps for genotypic datasets. Detailed description of QC can be found in the STAR Methods and on the UK Biobank website (http://biobank.ctsu.ox.ac.uk/crystal/refer.cgi?id=155580). (A) INTERVAL samples. (B) UK Biobank + UK BiLEVE samples.

Comment in

References

    1. Abraham G., Inouye M. Fast principal component analysis of large-scale genome-wide data. PLoS ONE. 2014;9:e93766. - PMC - PubMed
    1. Adams P.C., Reboussin D.M., Barton J.C., McLaren C.E., Eckfeldt J.H., McLaren G.D., Dawkins F.W., Acton R.T., Harris E.L., Gordeuk V.R., Hemochromatosis and Iron Overload Screening (HEIRS) Study Research Investigators Hemochromatosis and iron-overload screening in a racially diverse population. N. Engl. J. Med. 2005;352:1769–1778. - PubMed
    1. Asleh R., Guetta J., Kalet-Litman S., Miller-Lotan R., Levy A.P. Haptoglobin genotype- and diabetes-dependent differences in iron-mediated oxidative stress in vitro and in vivo. Circ. Res. 2005;96:435–441. - PubMed
    1. 1000 Genomes Project Consortium. Auton A., Brooks L.D., Durbin R.M., Garrison E.P., Kang H.M., Korbel J.O., Marchini J.L., McCarthy S., McVean G.A., Abecasis G.R. A global reference for human genetic variation. Nature. 2015;526:68–74. - PMC - PubMed
    1. Boatman S., Barrett F., Satishchandran S., Jing L., Shestopalov I., Zon L.I. Assaying hematopoiesis using zebrafish. Blood Cells Mol. Dis. 2013;51:271–276. - PMC - PubMed

Publication types