. 2016 Dec 20;7(51):84839-84850.
doi: 10.18632/oncotarget.13321.

H2O2 treatment or serum deprivation induces autophagy and apoptosis in naked mole-rat skin fibroblasts by inhibiting the PI3K/Akt signaling pathway

Affiliations

H2O2 treatment or serum deprivation induces autophagy and apoptosis in naked mole-rat skin fibroblasts by inhibiting the PI3K/Akt signaling pathway

Shanmin Zhao et al. Oncotarget. .

Erratum in

Abstract

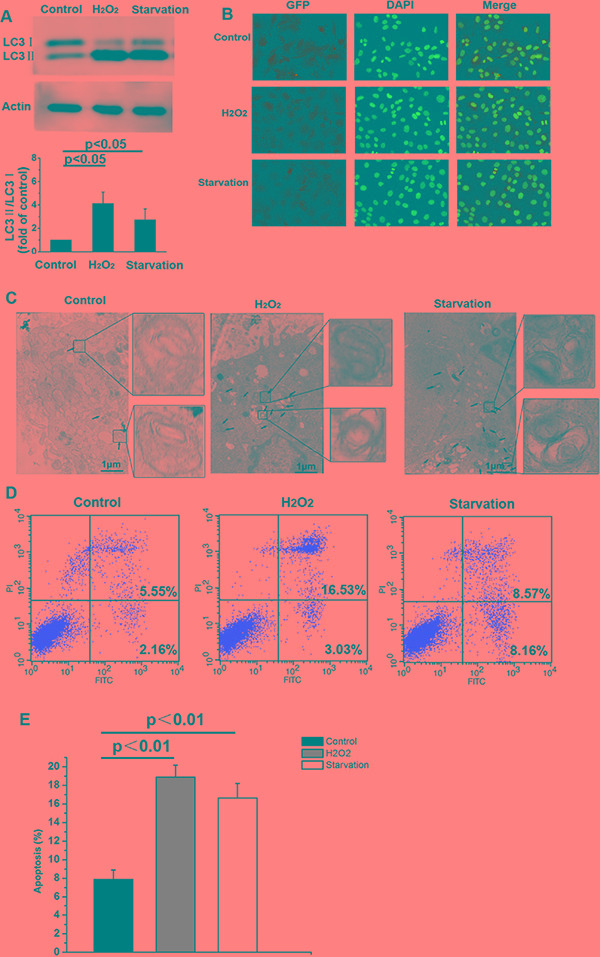
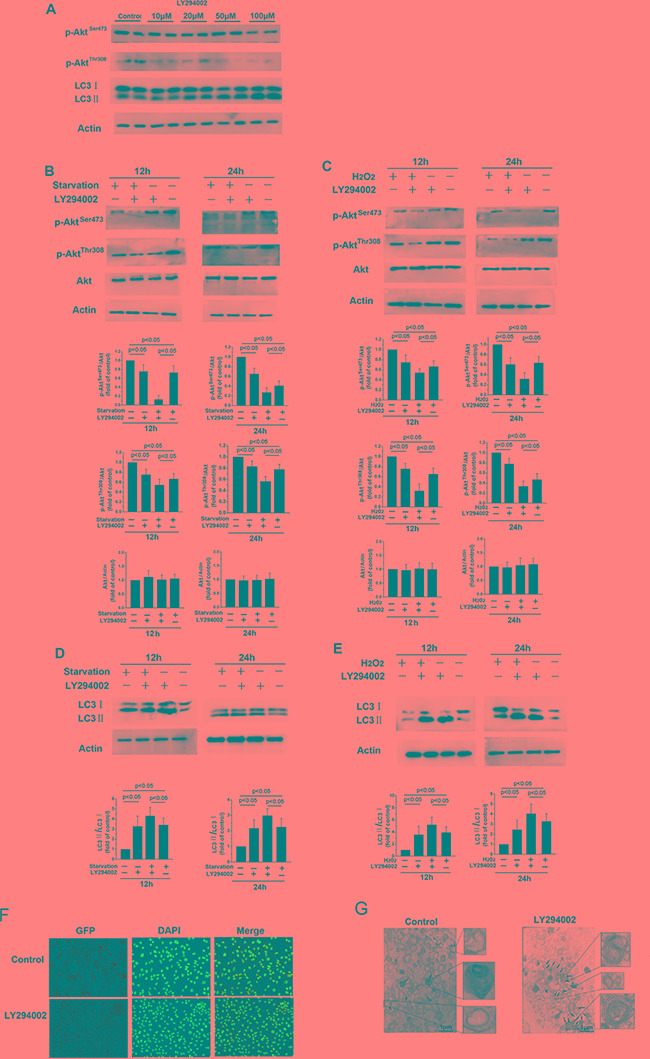
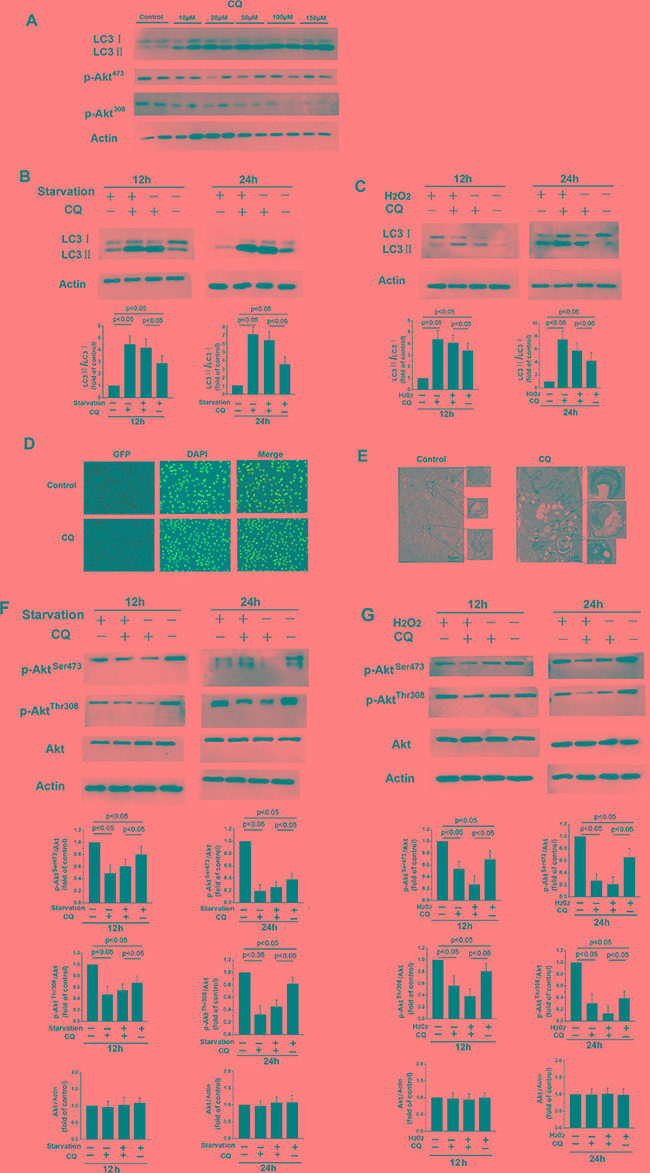
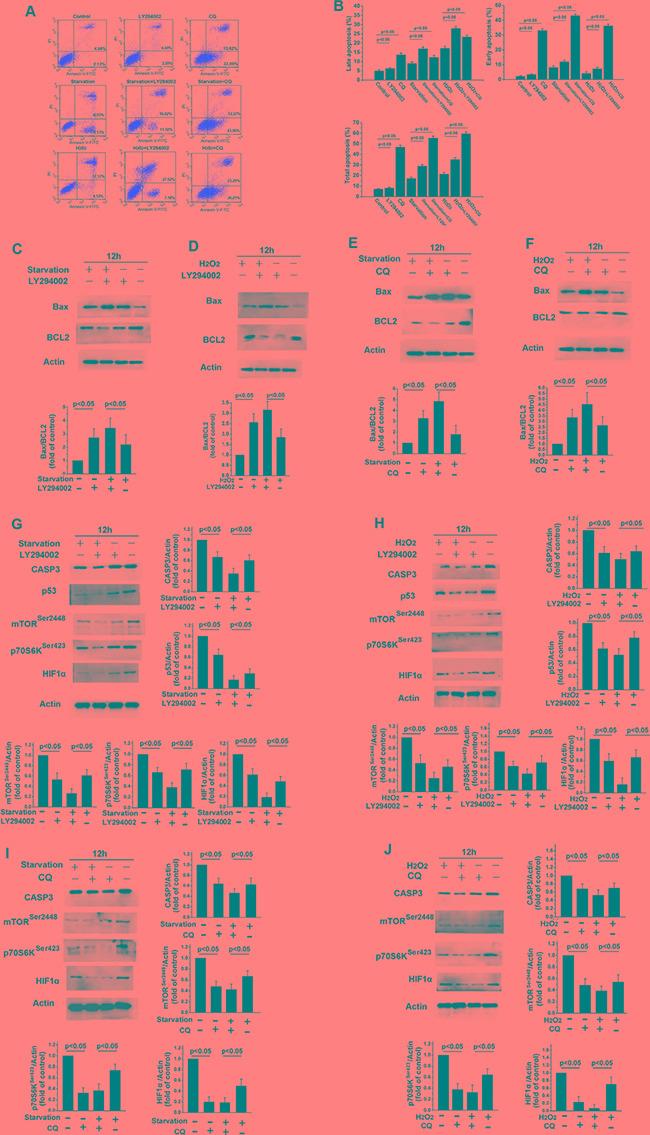
Naked mole-rats (NMR; Heterocephalus glaber) display extreme longevity and resistance to cancer. Here, we examined whether autophagy contributes to the longevity of NMRs by assessing the effects of the PI3K/Akt pathway inhibitor LY294002 and the autophagy inhibitor chloroquine (CQ) on autophagy and apoptosis in NMR skin fibroblasts. Serum starvation, H2O2 treatment, and LY294002 treatment all increased the LC3-II/LC3-I ratio and numbers of double-membraned autophagosomes and autophagic vacuoles, and decreased levels of p70S6K, p-AktSer473, and p-AktThr308. By contrast, CQ treatment decreased p70S6K, AktSer473, and AktThr308 levels. The Bax/Bcl-2 ratio increased after 12 h of exposure to LY294002 or CQ. These data show that inhibiting the Akt pathway promotes autophagy and apoptosis in NMR skin fibroblasts. Furthermore, LY294002 or CQ treatment decreased caspase-3, p53, and HIF1-α levels, suggesting that serum starvation or H2O2 treatment increase autophagy and apoptosis in NMR skin fibroblasts by inhibiting the PI3K/Akt pathway. CQ-induced inhibition of late autophagy stages also prevented Akt activation and induced apoptosis. Finally, the HIF-1α and p53 pathways were involved in serum starvation- or H2O2-induced autophagy in NMR skin fibroblasts.

Keywords: apoptosis; autophagy; naked mole-rats.


Conflict of interest statement

CONFLICTS OF INTEREST

The authors declare no competing financial interests.

Figures

Figure 1
Figure 1. Serum starvation or H2O2 treatment induce autophagy and apoptosis in NMR skin fibroblasts
(A) LC3-I and LC3-II levels were detected by Western blot in the untreated control and experimental groups after 12 h of treatment. β-actin served as a loading control. (B) Immunofluorescent labeling of LC3 in NMR skin fibroblasts following 12 h of serum starvation or H2O2 treatment. Coronal sections are labeled with an anti-LC3 antibody (green) and DAPI (blue; all panels, 200 × magnification). (C) Representative electron micrograph images showing autophagic vacuoles in each group. Arrows indicate autophagosomes. (D) Flow cytometric analysis of Annexin V-FITC and PI stained cells. Annexin V-positive, PI-negative cells are considered early apoptotic cells. Annexin V-positive, PI-positive cells are considered late apoptotic cells. (E) Bar graph showing early and late apoptotic cell percentages. Values represent means ± standard error.
Figure 2
Figure 2. LY294002-induced inhibition of the PI3K/Akt signaling pathway increases autophagy in skin fibroblasts
(A) Western blot showing protein levels in skin fibroblasts after 12 h of treatment with different concentrations of LY294002 for 12 h. (B, C, D, and E) Treatment with 20 μM LY294002 decreased p-AktSer473 and p-AktThr308 levels relative to total Akt levels, and increased LC3-II levels and the LC3-II/LC3-I ratio, after 12 or 24 h of serum starvation or H2O2 treatment. Bar graphs represents mean relative expression of protein normalized to untreated controls. (F) Immunofluorescence images of LC3 in skin fibroblasts treated with or without 20 μM LY294002 for 12 h. The coronal sections are labeled with an anti-LC3 antibody (green) and DAPI (blue; all panels, 100× magnification). (G) Representative electron micrograph images showing autophagic vacuoles in cells treated with or without 20 μM LY294002 for 12 hours. Arrows indicate autophagosomes.
Figure 3
Figure 3. CQ-induced inhibition of late-stage autophagy prevents Akt activation
(A) Western blot showing expression levels of LC3, Akt, p-AktSer473, and p-AktThr308 levels after 12 h of treatment with the indicated concentrations of CQ. β-actin served as a loading control. (B, C, F, and G) 12 or 24 h of treatment with 20 μM CQ decreased p-AktSer473 and p-AktThr308 protein levels relative to total Akt and increased LC3-II levels and the LC3-II/LC3I ratio. Bar graphs show mean relative protein levels normalized to β-actin/Akt. (D) Immunofluorescence images of LC3 in skin fibroblasts following 12 h of treatment with or without 20 μM CQ. The coronal sections are labeled with an anti-LC3 antibody (green) and DAPI (blue; all panels, 100× magnification). (E) Representative electron micrograph images showing autophagic vacuoles in cells treated with or without 20 μM CQ for 12 h. Arrows indicate autophagosomes.
Figure 4
Figure 4. LY294002-induced inhibition of PI3K/Akt signaling increases apoptosis in skin fibroblasts
(A) Flow cytometric analysis revealed that 12 h of treatment with LY294002 or CQ increased early and late apoptosis rates, and further increased starvation- or H2O2 treatment-induced increases in apoptosis rates, in skin fibroblasts. (B) Bar graph showing early and late apoptotic cell percentages. Means ± standard error are shown. (C–J) Western blots revealed that Bax levels increased, while Bcl2, p70S6K, p53, HIF1-α, and caspase-3 levels decreased, following 12 h of serum starvation or H2O2 treatment with or without LY294002 or CQ. Bar graphs show mean relative protein levels normalized to β-actin.

Similar articles

Cited by

References

    1. Edrey YH, Hanes M, Pinto M, Mele J, Buffenstein R. Successful aging and sustained good health in the naked mole rat: a long-lived mammalian model for biogerontology and biomedical research. ILAR J. 2011;52:41–53. - PubMed
    1. Grimes KM, Reddy AK, Lindsey ML, Buffenstein R. And the beat goes on: maintained cardiovascular function during aging in the longest-lived rodent, the naked mole-rat. Am J Physiol Heart Circ Physiol. 2014;307:H284–291. - PMC - PubMed
    1. Gorbunova V, Seluanov A, Zhang Z, Gladyshev VN, Vijg J. Comparative genetics of longevity and cancer: insights from long-lived rodents. Nat Rev Genet. 2014;15:531–540. - PMC - PubMed
    1. Seluanov A, Hine C, Azpurua J, Feigenson M, Bozzella M, Mao Z, Catania KC, Gorbunova V. Hypersensitivity to contact inhibition provides a clue to cancer resistance of naked mole-rat. Proc Natl Acad Sci U S A. 2009;106:19352–19357. - PMC - PubMed
    1. Liang S, Mele J, Wu Y, Buffenstein R, Hornsby PJ. Resistance to experimental tumorigenesis in cells of a long-lived mammal, the naked mole-rat (Heterocephalus glaber) Aging Cell. 2010;9:626–635. - PMC - PubMed

MeSH terms