. 2016 Dec 27;7(52):85680-85696.
doi: 10.18632/oncotarget.13341.

Different non-synonymous polymorphisms modulate the interaction of the WRN protein to its protein partners and its enzymatic activities

Affiliations

Different non-synonymous polymorphisms modulate the interaction of the WRN protein to its protein partners and its enzymatic activities

Jean-Philippe Gagné et al. Oncotarget. .

Abstract

Werner syndrome (WS) is characterized by the premature onset of several age-associated pathologies including cancer. The protein defective in WS patients (WRN) is a helicase/exonuclease involved in DNA replication and repair. Here, we present the results of a large-scale proteome analysis that has been undertaken to determine protein partners of different polymorphic WRN proteins found with relatively high prevalence in the human population. We expressed different fluorescently tagged-WRN (eYFP-WRN) variants in human 293 embryonic kidney cells (HEK293) and used a combination of affinity-purification and mass spectrometry to identify different compositions of WRN-associated protein complexes. We found that a WRN variant containing a phenylalanine residue at position 1074 and an arginine at position 1367 (eYFP-WRN(F-R)) possesses more affinity for DNA-PKc, KU86, KU70, and PARP1 than a variant containing a leucine at position 1074 and a cysteine at position 1367 (eYFP-WRN(L-C)). Such results were confirmed in a WRN-deficient background using WS fibroblasts. Interestingly, the exonuclase activity of WRN recovered from immunoprecipitated eYFP-WRN(L-C) variant was lower than the eYFP-WRN(F-R) in WS cells. Finally, HEK293 cells and WS fibroblasts overexpressing the eYFP-WRN(F-R) variant were more resistant to the benzene metabolite hydroquinone than cells expressing the eYFP-WRN(L-C) variant. These results indicate that the protein-protein interaction landscape of WRN is subject to modulation by polymorphic amino acids, a characteristic associated with distinctive cell survival outcome.

Keywords: Gerotarget; exonuclease; mass spectrometry; polymorphism; proteomics; werner syndrome.


Conflict of interest statement

CONFLICTS OF INTEREST

None to declare.

Figures

Figure 1
Figure 1. Co-purification of WRN-interacting proteins
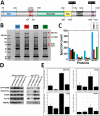
Affinity-purification of eYFP-tagged WRN variants was performed with antibody-coupled magnetic beads in HEK293 whole cell extracts. A. Schematic representation of the human WRN protein with the different polymorphic residues targeted in this study. C = cysteine; F = phenylalanine; L = leucine; R = arginine. Domain boundaries were drawn according to Uniprot (UniProtKB - Q14191) and [56]. B. Protein profiles of WRN-interacting proteins. Immunoprecipitation extracts obtained with each eYFP-WRN variants were resolved on SDS-PAGE and stained with SYPRO. All immunoprecipitations were performed 24 h after the transfection of eYFP-WRN expressing vectors. Molecular-mass sizes are indicated in kilodaltons (kDa). Arrows point to bands identified as major eYFP-WRN variants: DNA-PKc, KU86, and KU70 proteins. C. Diagram showing a summary of the spectral counts for YFP-WRN, DNA-PKc, KU86, and KU70 proteins from the tandem mass spectrometry analysis of protein extracts shown in B. D. Selected WRN-interacting proteins found by mass spectrometry analysis in eYFP-WRN immunoprecipitation extracts (anti-YFP IP) from transfected HEK293 cells were validated by Western blot analysis. A representative Western blot is shown with antibodies against DNA-PKc, KU86, KU70, and PARP1. E. Semi-quantitative analysis of protein abundance in eYFP-WRN immunoprecipitation extracts. The enrichment ratios of the indicated co-immunoprecipitated protein signal over the immunoprecipitated eYFP-WRN signal are indicated in the histograms. All co-immunoprecipitation analyses were performed in duplicate. Error bars (standard error of the mean (SEM)) are indicated for each histogram.
Figure 2
Figure 2. Immunoprecipitation of eYFP-WRN variants in WS fibroblasts (AG11395B) and evaluation of WRN exonluclease activity
A. Representative Western blots against selected WRN-interacting proteins in WRN immunoprecipitation extracts from WS fibroblasts transfected with the eYFP-WRN(L-C) and eYFP-WRN(F-R) variants. Longer exposures of the immunoblots are shown on the right for DNA-PKc and PARP1. B. Evaluation of the exonuclease activity in eYFP (control), eYFP-WRN(L-C) and eYFP-WRN(F-R) immunoprecipitation extracts. The volumes of magnetic beads containing the eYFP-WRN variants and their interacting proteins were added as indicated for the enzymatic reactions. A radiolabeled splayed arms DNA was used as a WRN substrate to evaluate its exonuclease activity. The position of the different DNA processed forms and the nuclease fragments are indicated on the left. The autoradiogram shown represents 18 h of exposition. The asterisk indicates the radioactive strand. C. Western blot showing the levels of eYFP-WRN variants in transfected WS fibroblasts that were used for the enzymatic assays in B. D. Quantification of WRN exonuclease activity associated with eYFP-WRN(L-C) and eYFP-WRN(F-R) immunoprecipitation extracts. Activity ratios were calculated relative to the undigested band signal from the autoradiogram shown in B. The experiments were performed in duplicates. The error bars represent the SE.
Figure 3
Figure 3. Dose-response curves of HEK293 cells expressing eYFP-WRN(L-C) and eYFP-WRN(F-R) variants exposed to genotoxic agents as determined by the sulforhodamine B colorimetric assay
A. Graph showing the hydroquinone sensitivity of HEK293 cells expressing the eYFP-WRN variants as determined by the sulforhodamine B colorimetric assay. Experiments were repeated four times. Bars represent SE. B. Representative Western blot showing the expression of the eYFP-WRN variants in transfected HEK293 cells. β-tubulin was used as a loading control. C. Histogram presenting the ratio of eYFP-WRN signal over β-tubulin signal from Western blots. Bars represent SE. D. Histogram representing the IC50 of HEK293 cells expressing the eYFP-WRN(L-C) and (F-R) variants exposed to hydroquinone. Bars represent SEM. (*Unpaired student t-test P-value = 0.028 compared to the eYFP-WRN(F-R) variant). E. Representative Western blots against selected WRN-interacting proteins in WRN immunoprecipitation extracts in HEK293 cells treated with or without 40 μM hydroquinone (HydroQ). F. Example of a representative Western blot showing the expression of the eYFP-WRN variants in transfected HEK293 cells exposed to neocarzinostatin. ß-tubulin was used as a loading control. G. Cell survival curve of HEK293 cells exposed to neocarzinostatin. H. Cell survival curve of HEK293 cells exposed to hydrogen peroxide (H2O2). HEK293 cells were transfected with the indicated eYFP-WRN expressing vectors, exposed to the DNA damaging agents for 30 minutes with the indicated concentration range and allowed to recover for 48 hours in fresh media. The neocarzinostatin and hydrogen peroxide experiments were done in triplicates. Bars represent SE.
Figure 4
Figure 4. Dose-response curves of HEK293 cells expressing the eYFP-WRN(L-C) and eYFP-WRN(F-R) variants in presence of hydroquinone and PARP inhibition
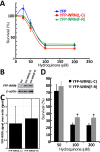
A. Cells were transfected with the indicated eYFP-WRN variants encoding vectors. Following overnight transfection, cells were treated one hour with 1 μM of the PARP1 inhibitor BMN-673 prior to exposure to increasing doses of hydroquinone for 24 hours. Hydroquinone dose-response curves were determined by the sulforhodamine B colorimetric assay. The experiments were performed in triplicates. Bars represent SE. B. Representative Western blot showing the expression of the eYFP-WRN variants in transfected cells. ß-tubulin was used as a loading control. C. Calculated IC50 (±SEM) of HEK293 cells expressing WRN variants from three different hydroquinone dose-response assays in the absence (control) or presence of the PARP1 inhibitor BMN-673. (*P-value = 0.011 and **P-value < 0.001 for eYFP-WRN(L-C) vs eYFP-WRN(F-R)).
Figure 5
Figure 5. Box plots depicting the distribution of nuclear
γ-H2AX foci in WS fibroblasts (AG11395B) expressing eYFP-WRN variants. A. Histogram representing the mean fluorescence intensity per tranfected WS fibroblast for each eYFP-WRN variant. FACS analyses were performed on triplicate transfections. B. WS fibroblasts were transfected with the indicated eYFP-WRN variants. Following overnight transfection, cells were fixed and processed for immunofluorescence analysis with an antibody against phosphorylated γ-H2AX. Tukey post ANOVA test P-values are shown (**P < 0.01 compared to eYFP transfected cells and †P < 0.05 compared to eYFP-WRN(L-C) transfected cells). C. Transfected WS fibroblasts were treated with 50 μM hydoquinone for four hours and then processed for immunofluorescence analysis with an antibody against phosphorylated γ-H2AX. Tukey post ANOVA test P-values are shown (**P < 0.01 compared to eYFP transfected cells and ††P < 0.01 compared to eYFP-WRN(L-C) transfected cells). The median number of γ-H2AX foci/cell is indicated in each box. All experiments were repeated three times.
Figure 6
Figure 6. Dose-response curves of WS fibroblasts (AG11395B) expressing eYFP-WRN(L-C) and eYFP-WRN(F-R) variants exposed to hydroquinone as determined by the MTT assay
A. Graph showing the hydroquinone sensitivity of WS fibroblasts expressing the eYFP-WRN variants as determined by MTT assay. Experiments were repeated 12 times. Bars represent SEM. B. Representative Western blot showing the expression of the eYFP-WRN variants in transfected WS fibroblasts. β-actin was used as a loading control. C. Histogram presenting the ratio of eYFP-WRN signal over β-actin signal from nine Western blots. Bars represent SE. D. Histogram representing the % survival of eYFP-WRN(L-C) and eYFP-WRN(F-R) transfected WS fibroblasts exposed to the indicated concentration of hydroquinone for 24 hours. Bars represent SEM for 12 transfections. (*Unpaired student t-test P-value < 0.01 compared to the eYFP-WRN(L-C) variant).

Similar articles

References

    1. Epstein CJ, Martin GM, Schultz AL, Motulsky AG. Werner's syndrome a review of its symptomatology, natural history, pathologic features, genetics and relationship to the natural aging process. Medicine (Baltimore) 1966;45:177–221. - PubMed
    1. Salk D. Werner's syndrome: a review of recent research with an analysis of connective tissue metabolism, growth control of cultured cells, and chromosomal aberrations. Hum Genet. 1982;62:1–5. - PubMed
    1. Ozgenc A, Loeb LA. Current advances in unraveling the function of the Werner syndrome protein. Mutat Res. 2005;577:237–51. - PubMed
    1. Yu CE, Oshima J, Fu YH, Wijsman EM, Hisama F, Alisch R, Matthews S, Nakura J, Miki T, Ouais S, Martin GM, Mulligan J, Schellenberg GD. Positional cloning of the Werner's syndrome gene. Science. 1996;272:258–62. - PubMed
    1. Schonberg S, Niermeijer MF, Bootsma D, Henderson E, German J. Werner's syndrome: proliferation in vitro of clones of cells bearing chromosome translocations. Am J Hum Genet. 1984;36:387–97. - PMC - PubMed