. 2017 Jan 3;8(1):133-144.
doi: 10.18632/oncotarget.13346.

Differentiated regulation of immune-response related genes between LUAD and LUSC subtypes of lung cancers

Affiliations

Differentiated regulation of immune-response related genes between LUAD and LUSC subtypes of lung cancers

Mengzhu Chen et al. Oncotarget. .

Abstract

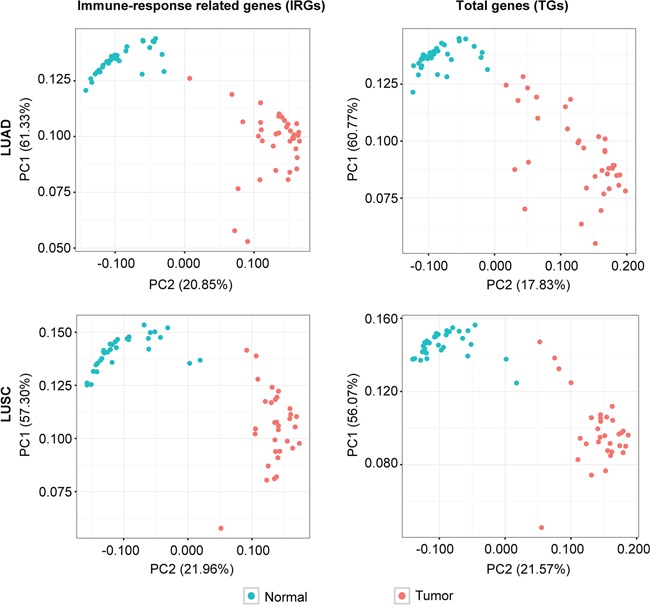
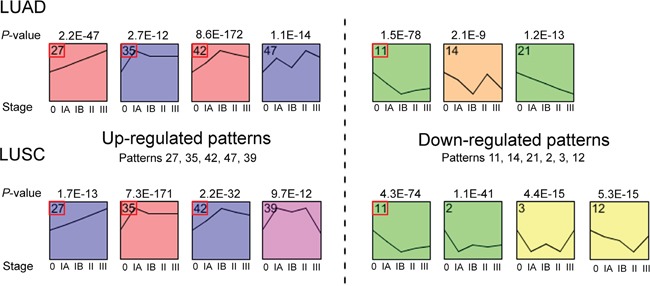
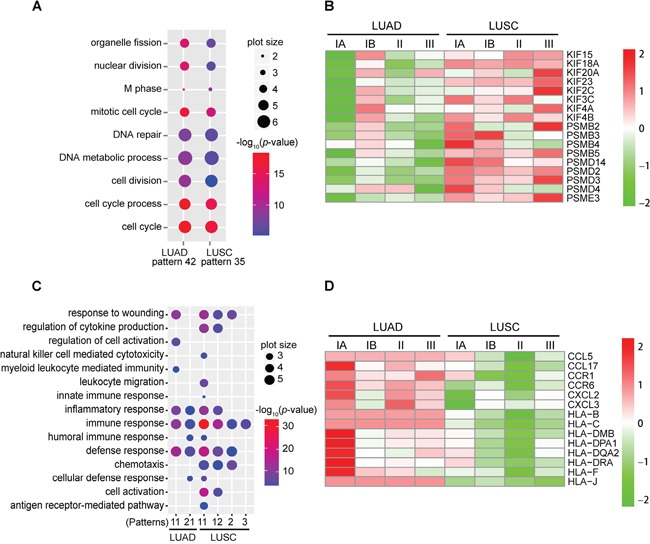
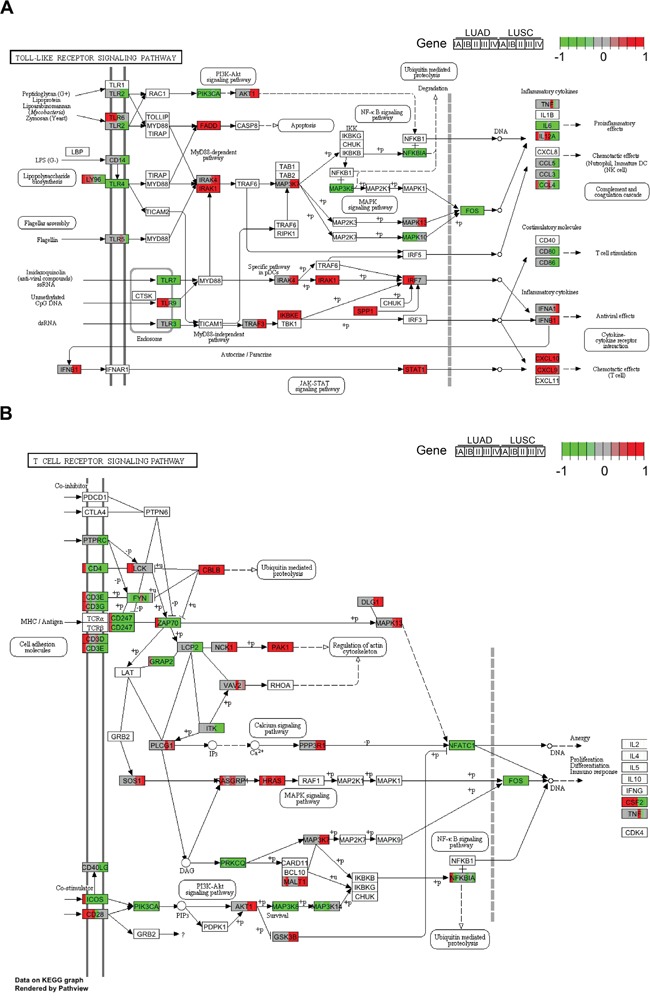
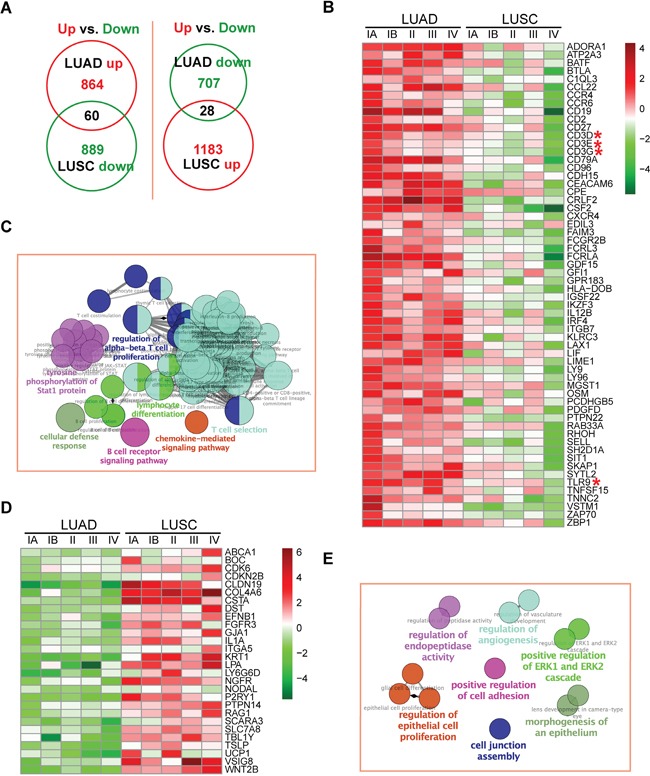
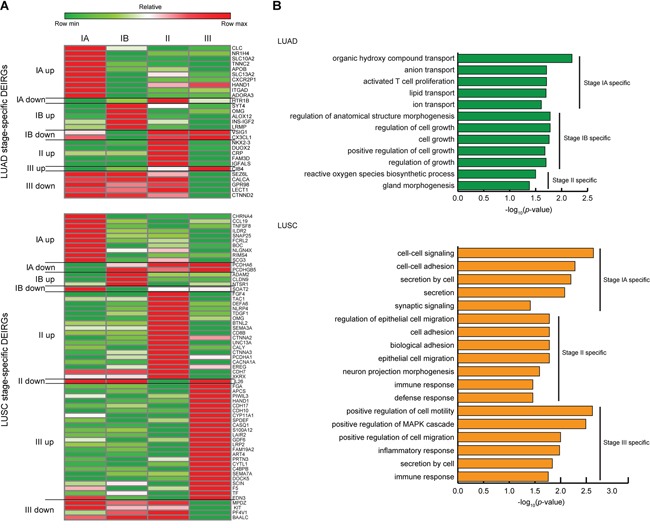
Lung squamous cell carcinoma (LUSC) and lung adenocarcinoma (LUAD) are the two major subtypes of lung cancer, with LUSC exhibits faster progression rate than LUAD. To investigate the roles of immune-response related genes (IRGs) in lung cancer progression, we used LUAD and LUSC samples at different cancer progression stages, and identified that the expression profiles of IRGs could serve as a better classification marker for cancerous tissues of both LUAD and LUSC. We found that the expression changes of IRGs were different between LUAD and LUSC. Cell cycle promoting genes, including KIFs and proteasomes, showed faster up-regulation in LUSC, whereas immune response promoting genes, including MHC molecules and chemokines, were more rapidly repressed in LUSC. Comparative pathway analysis revealed that members of the Toll-like receptor and T cell receptor signaling pathways exhibited diverged expression changes between LUAD and LUSC, especially at the early cancer stages. Our results revealed the difference of LUAD and LUSC from the immune response point of view, and provided new clues for the differential treatment of LUAD and LUSC.

Keywords: LUAD; LUSC; cancer progression rate; expression features; immune-response related genes.


Conflict of interest statement

CONFLICTS OF INTEREST

The authors declare no conflicts of interest.

Figures

Figure 1
Figure 1. Principle component analysis (PCA) of the expression levels of immune-response related genes (IRGs) and total genes (TGs) among the tumor (red points) and normal (blue points) samples from the LUAD and LUSC patients, respectively
Percentages in parenthesis are the proportion of variability presented by each PCA.
Figure 2
Figure 2. Schematic diagrams of the significantly enriched expression patterns of the differentially expressed immune-response related genes (DEIRGs) during LUAD or LUSC progression
Patterns present in both LUAD and LUSC samples are marked with red boxes.
Figure 3
Figure 3. Functional analysis of DEIRGs with significantly enriched expression patterns
A. Commonly enriched GO terms of DEIRGs with pattern 42 of LUAD and pattern 35 of LUSC. Shown are significantly enriched GO terms (FDR < 0.001, Fisher's exact test) of the biological process category. Dot size represents the frequency of the GO term in the Gene Ontology annotation (GOA) database. Dot color represents the log10-transformed enrichment p-value of each GO term. B. Expression changes of the KIFs and proteasome genes during LUAD and LUSC progression. The scaled relative abundances of log2-transformed RPKM ratio (tumor/normal) values are shown in the heatmap. C. Commonly enriched GO terms of DEIRGs with down-regulated expression patterns among LUAD and LUSC samples. Shown are the significantly enriched GO terms (FDR < 0.001, Fisher's exact test) of the biological process category. Pattern 14 of LUAD is not included as no enriched GO terms were identified among genes of this pattern. D. Expression changes of the MHC and chemokine genes during LUAD and LUSC progression. The scaled relative abundances of log2-transformed RPKM ratio (tumor/normal) values are shown in the heatmap.
Figure 4
Figure 4. Expression changes of the Toll-like receptor and T cell receptor signaling pathway genes during LUAD and LUSC progression
Each gene box is equally divided into ten pieces, sequentially representing the five stages (IA, IB, II, III, and IV) of LUAD and LUSC. Colors represent the scaled relative abundances of log2-transformed RPKM ratio (tumor/normal) values. A. Expression changes of DEIRGs in the Toll-like receptor signaling pathway. B. Expression changes of DEIRGs in the T cell receptor signaling pathway.
Figure 5
Figure 5. Expression profiles and GO analysis of DEIRGs with diverged changes between LUAD and LUSC
A. Venn diagram analysis of DEIRGs with unidirectional expression changes in LUAD and LUSC. B. Expression profiles of DEIRGs up-regulated in LUAD and down-regulated in LUSC. Log2-transformed RPKM ratio (tumor/normal) values are shown in the heatmap. The CD3-TCR complex members and Toll-like receptor were highlighted with red asterisks. C. Enriched GO terms (p-value < 0.01, corrected with Bonferroni step down) of DEIRGs in panel B. The names of processes and their related GO terms are shown in the same colors. Circles are connected according to the hierarchical relationships of GO terms. The sizes of circles are negatively correlated with the enrichment p-values of GO terms. D. Expression profiles of DEIRGs down-regulated in LUAD and up-regulated in LUSC. Log2-transformed RPKM ratio (tumor/normal) values are shown in the heatmap. E. Enriched GO terms (p-value < 0.05, corrected with Bonferroni step down) of DEIRGs in panel D.
Figure 6
Figure 6. Expression profiles and GO analysis of the stage-specific DEIRGs in LUAD and LUSC
A. Relative expression profiles of the stage-specific DEIRGs. Rows represent stage-specific DEIRGs with their gene symbols to the right, columns represent cancer stages. Up and down indicate the specifically up- and down-regulated DEIRGs at each stage, respectively. Heatmap is generated using the scaled relative abundance of log2-transformed RPKM ratios (tumor/normal). B. Enriched GO terms (p-value < 0.05, Fisher's exact test) of the stage-specific DEIRGs. X-axis represents log10-transformed p-values of GO term enrichment and y-axis stands for the enriched GO terms of the biological process category.

Similar articles

Cited by

References

    1. Siegel RL, Miller KD, Jemal A. Cancer statistics, 2015. CA: a cancer journal for clinicians. 2015;65:5–29. - PubMed
    1. Chen W, Zheng R, Baade PD, Zhang S, Zeng H, Bray F, Jemal A, Yu XQ, He J. Cancer statistics in China, 2015. CA: a cancer journal for clinicians. 2016;66:115–132. - PubMed
    1. Chang JTH, Lee YM, Huang RS. The impact of the Cancer Genome Atlas on lung cancer. Translational Research. 2015;166:568–585. - PMC - PubMed
    1. Detterbeck FC, Boffa DJ, Tanoue LT. The New Lung Cancer Staging System. Chest. 2009;136:260–271. - PubMed
    1. Subramanian J, Govindan R. Lung cancer in never smokers: a review. Journal of clinical oncology. 2007;25:561–570. - PubMed

MeSH terms