

Enumeration and targeted analysis of KRAS, BRAF and PIK3CA mutations in CTCs captured by a label-free platform: Comparison to ctDNA and tissue in metastatic colorectal cancer
- PMID: 27863403
- PMCID: PMC5356741
- DOI: 10.18632/oncotarget.13350
Enumeration and targeted analysis of KRAS, BRAF and PIK3CA mutations in CTCs captured by a label-free platform: Comparison to ctDNA and tissue in metastatic colorectal cancer
Abstract
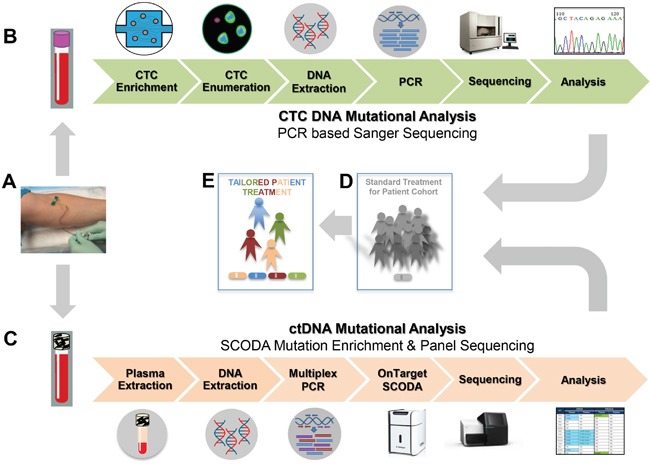
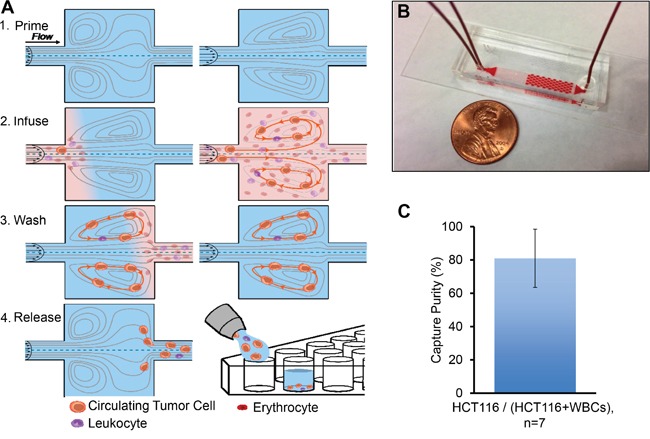
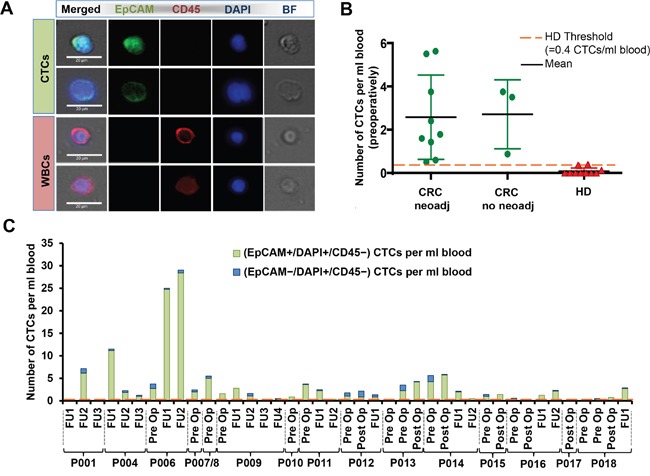
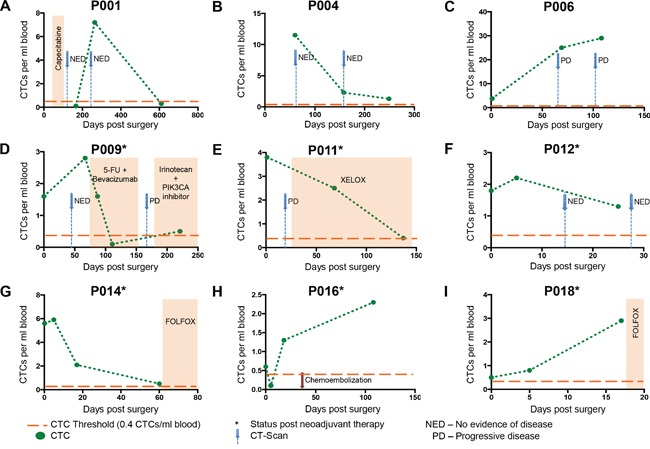
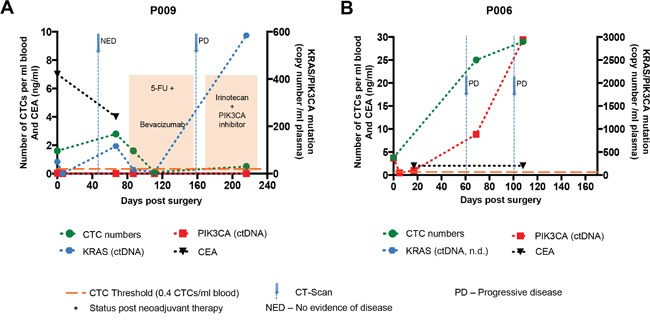
Treatment of advanced colorectal cancer (CRC) requires multimodal therapeutic approaches and need for monitoring tumor plasticity. Liquid biopsy biomarkers, including CTCs and ctDNA, hold promise for evaluating treatment response in real-time and guiding therapeutic modifications. From 15 patients with advanced CRC undergoing liver metastasectomy with curative intent, we collected 41 blood samples at different time points before and after surgery for CTC isolation and quantification using label-free Vortex technology. For mutational profiling, KRAS, BRAF, and PIK3CA hotspot mutations were analyzed in CTCs and ctDNA from 23 samples, nine matched liver metastases and three primary tumor samples. Mutational patterns were compared. 80% of patient blood samples were positive for CTCs, using a healthy baseline value as threshold (0.4 CTCs/mL), and 81.4% of captured cells were EpCAM+ CTCs. At least one mutation was detected in 78% of our blood samples. Among 23 matched CTC and ctDNA samples, we found a concordance of 78.2% for KRAS, 73.9% for BRAF and 91.3% for PIK3CA mutations. In several cases, CTCs exhibited a mutation that was not detected in ctDNA, and vice versa. Complementary assessment of both CTCs and ctDNA appears advantageous to assess dynamic tumor profiles.
Keywords: Vortex; circulating tumor DNA; circulating tumor cells; colorectal cancer; liquid biopsy.
Conflict of interest statement
H. Liu, J. Che and E. Sollier-Christen have financial interests in Vortex Biosciences. A. Marziali and M. Wiggin have financial interests in Boreal Genomics. The other authors have declared no conflicts of interest.
Figures
Similar articles
-
PIK3CA hotspot mutations in circulating tumor cells and paired circulating tumor DNA in breast cancer: a direct comparison study.Mol Oncol. 2019 Dec;13(12):2515-2530. doi: 10.1002/1878-0261.12540. Epub 2019 Sep 30. Mol Oncol. 2019. PMID: 31254443 Free PMC article.
-
In-depth assessment of BRAF, NRAS, KRAS, EGFR, and PIK3CA mutations on cell-free DNA in the blood of melanoma patients receiving immune checkpoint inhibition.J Exp Clin Cancer Res. 2025 Jul 12;44(1):202. doi: 10.1186/s13046-025-03457-w. J Exp Clin Cancer Res. 2025. PMID: 40652269 Free PMC article.
-
Use of Liquid Biopsy in Monitoring Colorectal Cancer Progression Shows Strong Clinical Correlation.Am J Med Sci. 2018 Mar;355(3):220-227. doi: 10.1016/j.amjms.2017.09.009. Epub 2017 Sep 20. Am J Med Sci. 2018. PMID: 29549923
-
Liquid Biopsy for the Management of Patients with Colorectal Cancer.Digestion. 2019;99(1):39-45. doi: 10.1159/000494411. Epub 2018 Dec 14. Digestion. 2019. PMID: 30554222 Review.
-
The Clinical Impact of Quantitative Cell-free DNA, KRAS, and BRAF Mutations on Response to Anti-EGFR Treatment in Patients with Metastatic Colorectal Cancer.Curr Pharm Des. 2021;27(7):942-952. doi: 10.2174/1381612826666201007163116. Curr Pharm Des. 2021. PMID: 33030125 Review.
Cited by
-
The diagnostic accuracy of digital PCR, ARMS and NGS for detecting KRAS mutation in cell-free DNA of patients with colorectal cancer: A systematic review and meta-analysis.PLoS One. 2021 Mar 26;16(3):e0248775. doi: 10.1371/journal.pone.0248775. eCollection 2021. PLoS One. 2021. PMID: 33770081 Free PMC article.
-
The Prospect and Challenges to the Flow of Liquid Biopsy in Africa.Cells. 2019 Aug 9;8(8):862. doi: 10.3390/cells8080862. Cells. 2019. PMID: 31404988 Free PMC article. Review.
-
Clinical significance of BRAFV600E mutation in circulating tumor DNA in Chinese patients with melanoma.Oncol Lett. 2018 Feb;15(2):1839-1844. doi: 10.3892/ol.2017.7529. Epub 2017 Dec 5. Oncol Lett. 2018. PMID: 29434880 Free PMC article.
-
Liquid Biopsies in Colorectal Liver Metastases: Towards the Era of Precision Oncologic Surgery.Cancers (Basel). 2022 Aug 31;14(17):4237. doi: 10.3390/cancers14174237. Cancers (Basel). 2022. PMID: 36077774 Free PMC article. Review.
-
Molecular Profiling of Circulating Tumour Cells and Circulating Tumour DNA: Complementary Insights from a Single Blood Sample Utilising the Parsortix® System.Curr Issues Mol Biol. 2024 Jan 17;46(1):773-787. doi: 10.3390/cimb46010050. Curr Issues Mol Biol. 2024. PMID: 38248352 Free PMC article. Review.
References
-
- Siegel RL, Miller KD, Jemal A. Cancer statistics, 2016. CA Cancer J Clin. 2016;66:7–30. - PubMed
-
- Arnold M, Sierra MS, Laversanne M, Soerjomataram I, Jemal A, Bray F. Global patterns and trends in colorectal cancer incidence and mortality. Gut. 2016. [Epub ahead of print] - PubMed
-
- Smith RA, Andrews K, Brooks D, DeSantis CE, Fedewa SA, Lortet-Tieulent J, Manassaram-Baptiste D, Brawley OW, Wender RC. Cancer screening in the United States, 2016: A review of current American Cancer Society guidelines and current issues in cancer screening. CA Cancer J Clin. 2016;66:95–114. - PubMed
-
- Miller KD, Siegel RL, Lin CC, Mariotto AB, Kramer JL, Rowland JH, Stein KD, Alteri R, Jemal A. Cancer treatment and survivorship statistics, 2016. CA Cancer J Clin. 2016;66:271–89. - PubMed
-
- Siegel R, Desantis C, Jemal A. Colorectal cancer statistics, 2014. CA Cancer J Clin. 2014;64:104–17. - PubMed
Publication types
MeSH terms
Substances
LinkOut - more resources
Full Text Sources
Other Literature Sources
Medical
Research Materials
Miscellaneous
