. 2016 Dec 20;7(51):85332-85348.
doi: 10.18632/oncotarget.13352.

Kallikrein-related peptidase 6 induces chemotherapeutic resistance by attenuating auranofin-induced cell death through activation of autophagy in gastric cancer

Affiliations

Kallikrein-related peptidase 6 induces chemotherapeutic resistance by attenuating auranofin-induced cell death through activation of autophagy in gastric cancer

Tae Woo Kim et al. Oncotarget. .

Abstract

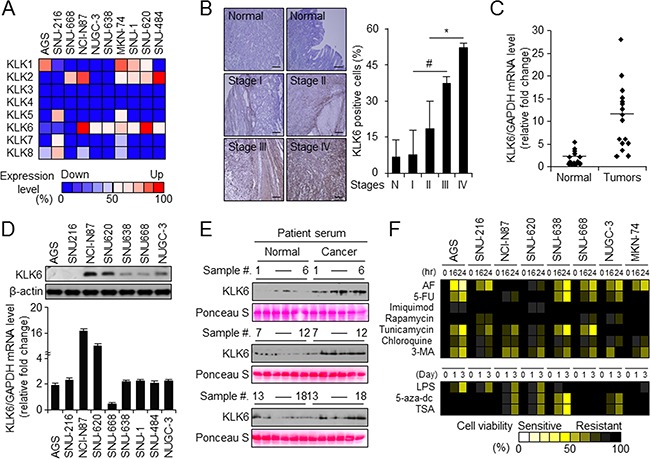
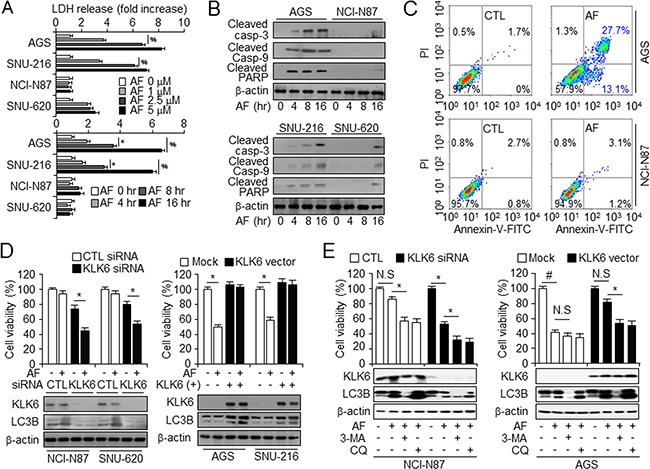
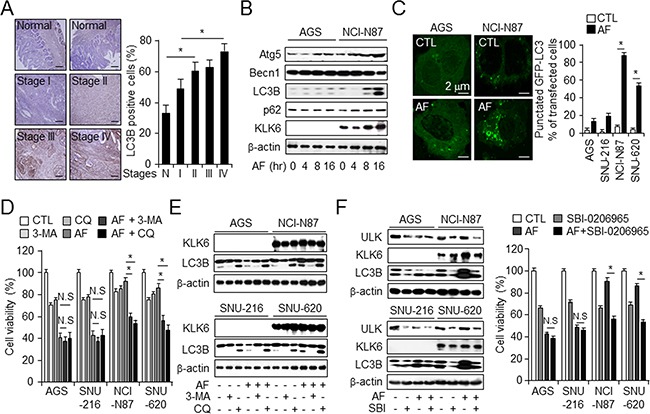
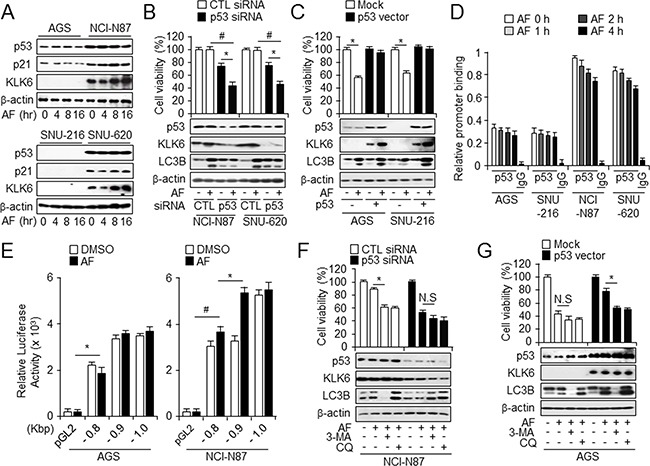
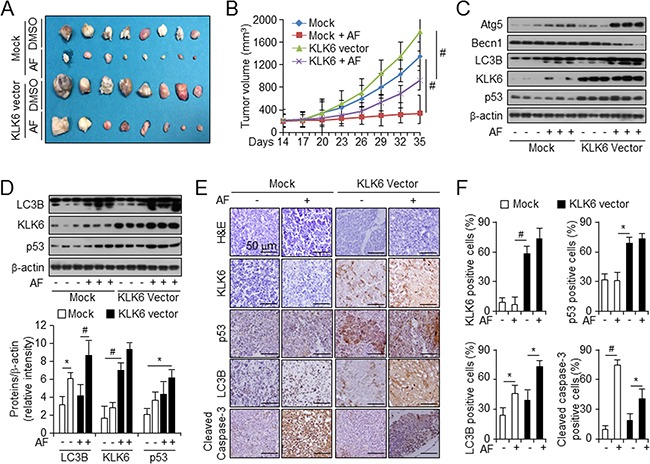
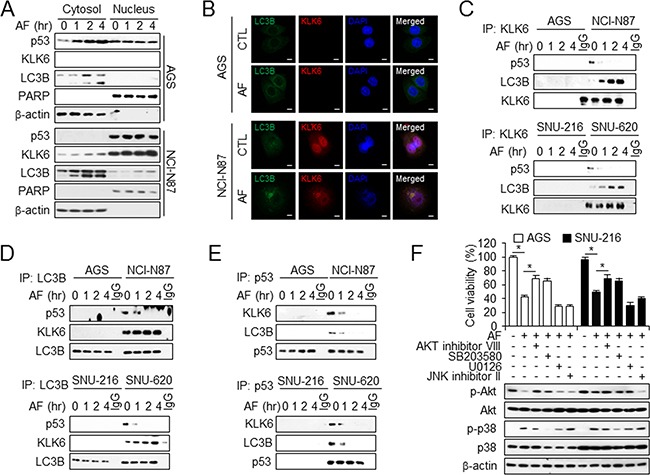
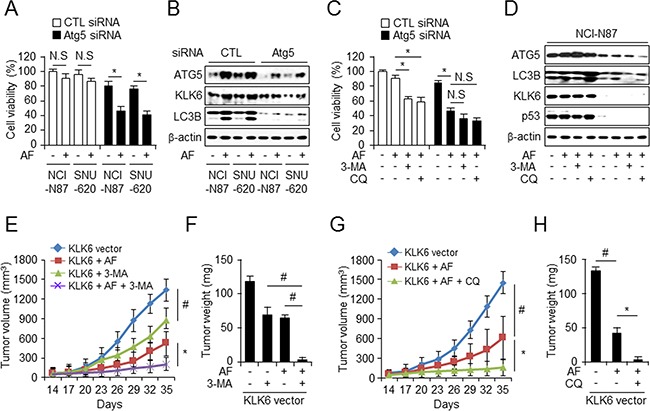
Kallikrein-related peptidase 6 (KLK6) is a biomarker of gastric cancer associated with poor prognosis. Mechanisms by which KLK6 could be exploited for chemotherapeutic use are unclear. We evaluated auranofin (AF), a compound with cytotoxic effects, in KLK6-deficient cells, and we investigated whether KLK6 expression induces autophagy and acquisition of drug resistance in gastric cancer. Using cultured human cells and a mouse xenograft model, we investigated how KLK6 affects antitumor-reagent-induced cell death and autophagy. Expression levels of KLK6, p53, and autophagy marker LC3B were determined in gastric cancer tissues. We analyzed the effects of knockdown/overexpression of KLK6, LC3B, and p53 on AF-induced cell death in cancer cells. Increased KLK6 expression in human gastric cancer tissues and cells inhibited AF-induced cell motility due to increased autophagy and p53 levels. p53 dependent induction of KLK6 expression increased autophagy and drug resistance, whereas KLK6 silencing decreased the autophagy level and increased drug sensitivity. During AF-induced cell death, KLK6 and LC3B colocalized to autophagosomes, associated with p53, and were then trafficked to the cytosol. In the xenograft model of gastric cancer, KLK6 expression decreased AF-induced cell death and KLK6-induced autophagy increased AF resistance. Taken together, the data suggest that the induction of autophagic processes through KLK6 expression may increase acquisition of resistance to AF. Our findings may contribute to a new paradigm for tumor therapeutics.

Keywords: auranofin; autophagy; cell death; chemoresistance; kallikrein-related peptidase 6.


Conflict of interest statement

CONFLICTS OF INTEREST

The authors declare no conflicts of interest.

Figures

Figure 1
Figure 1. KLK6 expression is upregulated in vivo and in vitro in late-stage gastric cancer
A. RT-PCR analysis of KLK1–8 expression compared relative intensity with GAPDH expression in the indicated gastric cancer cell lines. The intensity of each KLK1-7 mRNA band was quantified and normalized with that of the corresponding GAPDH band (ATTO Densitograph software library). B. Representative immunohistochemical images (left) and microarray-based quantitation (right) of KLK6 expression in normal (n = 59) and gastric cancer tissues at indicated stages (stage I, n = 8; II, n = 14; III, n = 24; and IV, n = 3). Original magnification, 200×; scale bars, 50 μm; *P < 0.05. C. KLK6 expression in 16 pairs of normal and cancer tissues from gastric cancer patients normalized to the GAPDH expression level as determined with qPCR. D. Western blot (top) and quantitation of real-time RT-PCR (bottom) data of KLK6 expression in the indicated cell lines. E. Western blot analysis of KLK6 levels in serum of gastric cancer patients and normal controls (n = 18 pairs) normalized to Ponceau S staining intensities. F. Cell viability of gastric cancer cells treated with AF (2.5 μM), 5-FU (2.5 μM), imiquimod (2.5 μM), rapamycin (10 nM), tunicamycin (2.5 μM), chloroquine (20 μM), 3-MA (5 mM), LPS (1 μM), 5-aza-dc (1 μM), and TSA (100 nM) for the indicated times as measured by WST-1 assay. The viability of drug-treated cells was expressed relative to that of DMSO-treated control cells, whose viability was set at 100%.
Figure 2
Figure 2. KLK6 expression is attenuated by AF-induced cell death in gastric cancer cell lines
A. LDH release from NCI-N87 and SNU-620 (AF-induced chemoresistant cell lines) and AGS and SNU-216 (AF-induced chemosensitive cell lines) cells incubated with DMSO or the indicated concentrations of AF (top). Cells treated with AF (2.5 μM) were further incubated for the indicated times (bottom). Values are the mean ± SD from triplicate experiments; *P < 0.05, #P < 0.01, B. Western blot analysis of cleaved caspase-3, caspase-9, and PARP in the indicated cell types treated with AF (2.5 μM) for the indicated times. C. FACS analysis of annexin V and PI staining in AGS (top) and NCI-N87 (bottom) cells treated with DMSO (CTL) or AF (2.5 μM). D. After transfection with control (CTL) or KLK6 siRNA (left panel) and KLK6 overexpression or mock vector (right panel) in the presence and absence of AF (2.5 μM) treatment, cell viability and expression of KLK6 and LC3B in AGS, SNU-216, NCI-N87, and SNU-620 cells were measured by WST-1 assay and western blot analysis, respectively. E. Cell viability assay and western blot analysis of KLK6, and LC3B in NCI-N87 and AGS cells following transfection with control (CTL) or KLK6 siRNA (left panels) and KLK6 overexpression plasmid or mock vector (right panels) in the presence and absence of AF (2.5 μM) and 3-MA (5 mM) or CQ (20 μM), *P < 0.05.
Figure 3
Figure 3. KLK6 expression decreases in AF-induced cell death via the activation of autophagy in gastric cancer
A. Representative immunohistochemical images and microarray-based quantitation of LC3B expression in normal and cancer tissues at the indicated stages used in Figure 1B. Original magnification, 200×; scale bars, 50 μm; *P < 0.05. B. Western blot analysis of expression of indicated autophagy markers in indicated cell types treated with AF (2.5 μM) for the indicated times. C. Fluorescence microscopic analysis and quantitation of autophagy activation, characterized by punctate LC3B staining, in indicated cell types transfected with pEGFP-LC3B and treated with AF (2.5 μM) or DMSO for 16 h. *P < 0.05. Cell viability D. and western blot analysis of KLK6 and LC3B E. in the indicated cell types treated with DMSO or a combination of AF and autophagy inhibitor 3-MA (5 mM) or CQ (20 μM) for 16 h. F. Western blot analysis of KLK6 and LC3B expression (left) and cell viability (right) in the indicated cell types treated with AF (2.5 μM) in the presence or absence of SBI-0206965 (SBI) (10 μM) for 16 hr; * P <0.05.
Figure 4
Figure 4. Enrichment of p53 is important for AF-induced KLK6 expression and autophagic activation
A. Western blot analysis of KLK6, p53, and p21 levels in AF-induced AGS and NCI-N87 cells. B. After transfection with control or p53 siRNA in the presence or absence of AF (2.5 μM) treatment, cell mortality and expression of p53, KLK6, and LC3B were measured by WST-1 assay and western blot analysis in NCI-N87 and SNU-620 cells. C. After transfection with p53 overexpression or mock vector in the presence or absence of AF treatment, cell viability and the expression level of the indicated proteins in AGS and SNU-216 cells were measured by WST-1 and immunoblot assay. D. Chromatin immunoprecipitation (ChIP) analysis of relative KLK6 promoter binding to p53 in the indicated cell types treated with AF for the indicated times. IgG was included as a negative control. E. The 1-kb sequence upstream of KLK6 was divided into the three indicated regions that were cloned into luciferase reporter vector pGL3. After transient transfection into AGS and NCI-N87 cells, luciferase activity was measured using a triple luciferase assay. *P<0.05. After transfection of KLK6 siRNA or control siRNA F. in NCI-N87 (KLK6-positive) cells and p53 overexpression plasmid or mock vector G. into AGS (KLK6-negative) cells, cells were treated with AF alone, AF plus 3-MA, or AF plus CQ. For measuring the level of autophagy flux, cell viability was detected using WST-1 assay and expression of indicated proteins by immunoblot assay using KLK6, LC3B and p53 antibodies. *P < 0.05.
Figure 5
Figure 5. KLK6 overexpression with AF treatment decreases therapeutic effects on xenograft tumor growth in vivo
A. Image of xenograft tumors from mice treated with mock or KLK6 expression vector, with or without AF treatment. B. Tumor volumes on the indicated days after injection of cells transfected with indicated vectors in the presence or absence of AF treatment into mice. Values are the mean ± SD for each group (n = 8) C. Western blot analysis of the indicated proteins in tumors from cells transfected with the indicated vectors in the presence and absence of AF treatment of mice D. Western blot analysis (top) and quantitation (bottom) of the indicated proteins normalized to β-actin in spleens from mice of each treatment group. *P < 0.05; #P < 0.01. E. Hematoxylin and eosin staining (top row) and immunohistochemical analysis of the indicated proteins (lower rows) of sections of indicated types of xenograft tumors. Original magnification, 200×; scale bars, 50 μm. F. Quantification of immunohistochemical staining in (E). *P < 0.05; #P < 0.01.
Figure 6
Figure 6. Interaction of KLK6, LC3B, and p53 is required for AF-induced autophagy activation
A. Western blot analysis of the indicated proteins in cytosolic and nuclear extracts of AGS (top) and NCI-N87 (bottom) cells treated with AF or DMSO for the indicated times. β-actin and PARP served as cytosolic and nuclear loading controls, respectively. B. Colocalization of KLK6 and LC3B on gastric cancer cells. AGS and NCI-N87 cells were treated with AF, and stained at 4°C with KLK6 and LC3B antibody. After primary staining, also stained with Alexa488 (green) and Alexa555 (red), and nuclear stained with DAPI. Colocalization is represented by yellow appearance in the merge. Western blot analysis of KLK6, LC3B, and p53 co-immunoprecipitated (IP) with anti-KLK6 C. anti-LC3B D. and anti-p53 E. from AF-induced chemosensitive (AGS and SNU-216) and chemoresistant (NCI-N87 and SNU-620) cells treated with AF for the indicated times using p53, KLK6, and LC3B antibodies. F. Viability (top) and Western blot analysis of total and phosphorylated Akt and p38 (bottom) in AGS and SNU-216 cells treated with Akt inhibitor VIII (10 μM), p38 inhibitor SB203580 (30 μM), MEK1, 2 inhibitor U0126 (20 μM), and JNK inhibitor II (20 μM). *P < 0.05.
Figure 7
Figure 7. CQ enhances AF-induced growth inhibition of tumor xenografts in KLK6-overexpressing cells
WST-1 cell viability assay A. and western blots B. with ATG5, LC3B, and KLK6 antibodies performed after transfection of ATG5 siRNA or control siRNA into NCI-N87 and SNU-620 cells. WST-1 assay C. and western blot analysis D. after transfection of ATG5-targeted siRNA into NCI-N87 cells treated with AF and/or 3-MA (5 mM) or CQ (20 μM). Combined treatment with AF (4 mg/kg) in the presence or absence with 3-MA (10 mg/kg) E. or CQ (60 mg/kg) G. (i.p) injection every other day for the indicated period inhibits tumor volume and tumor weight in the presence or absence of 3-MA F. and CQ H. of KLK6-overexpressing human gastric cancer xenografts in nude mice (n = 6).

Similar articles

Cited by

References

    1. Turner R. Gastric cancer gets the run-around. Nat Med. 2002;8:449. - PubMed
    1. Fan K, Fan D, Cheng LF, Li C. Expression of multidrug resistance-related markers in gastric cancer. Anticancer Res. 2000;20:4809–14. - PubMed
    1. Zhou J, Yong WP, Yap CS, Vijayaraghavan A, Sinha RA, Singh BK, Xiu S, Manesh S, Ngo A, Lim A, Ang C, Xie C, et al. An integrative approach identified genes associated with drug response in gastric cancer. Carcinogenesis. 2015;36:441–51. - PubMed
    1. Gray-Schopfer VC, Karasarides M, Hayward R, Marais R. Tumor necrosis factor-a blocks apoptosis in melanoma cells when BRAF signaling is inhibited. Cancer Res. 2007;67:122–9. - PubMed
    1. Thorburn A, Thamm DH, Gustafson DL. Autophagy and cancer therapy. Mol Pharmacol. 2014;85:830–8. - PMC - PubMed

MeSH terms