. 2016 Dec 20;7(51):84989-84998.
doi: 10.18632/oncotarget.13356.

Induction of mitochondria-mediated apoptosis and PI3K/Akt/ mTOR-mediated autophagy by aflatoxin B2 in hepatocytes of broilers

Affiliations

Induction of mitochondria-mediated apoptosis and PI3K/Akt/ mTOR-mediated autophagy by aflatoxin B2 in hepatocytes of broilers

Binlong Chen et al. Oncotarget. .

Abstract

Aflatoxins have been shown to induce hepatotoxicity in animal models, but the effects of aflatoxin B2 (AFB2) on broiler hepatocytes is unclear. This study aimed to investigate the effects of AFB2 on apoptosis and autophagy to provide an experimental basis for understanding the mechanism of aflatoxin-induced hepatotoxicity. One hundred-twenty Cobb500 broilers were allocated to four groups and exposed to 0 mg/kg, 0.2 mg/kg, 0.4 mg/kg, and 0.8 mg/kg of AFB2 per day for 21 d. AFB2 exerted potent proapoptotic and proautophagic effects on hepatocytes, with increased numbers of apoptotic and autophagic hepatocytes.Poly ADP-ribose polymerase (PARP) was cleaved and caspase-3 was activated in experimental groups, showing that the apoptosis of hepatocytes was triggered by AFB2. Increased levels of the autophagy factors Beclin-1 and LC3-II/LC3-I, as well as down-regulation of p62, a marker of autophagic flux, provided additional evidence for AFB2-triggered autophagy. AFB2 induced mitochondria-mediated apoptosis via the production of reactive oxygen species (ROS) and promotion of the translocation of Bax and cytochrome c (cyt c) between mitochondria and the cytosol, triggering the formation of apoptosomes. AFB2 also inhibited the phosphoinositide 3-kinase/Akt/mammalian target of rapamycin (PI3K/Akt/mTOR) pathway by activating PI3K, Akt, and mTOR and inhibiting their phosphorylation, contributing to the proautophagic activity of AFB2. These findings provide new insights into the mechanisms involved in AFB2-induced hepatotoxicity in broilers.

Keywords: PI3K/Akt/mTOR-mediated autophagy; aflatoxin B2; broiler; hepatocytes; mitochondria-mediated apoptosis.


Conflict of interest statement

CONFLICTS OF INTEREST

The authors declare that they have no conflicts of interest.

Figures
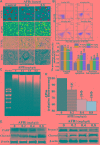
Figure 1
Figure 1. Effect of AFB2 on apoptosis of hepatocytes
(A) Showing normal and early apoptotic cells stained by AO (green fluorescence) and late apoptotic cells stained by EB (red fluorescence) (200×). Nuclear morphological changes in hepatocytes were observed using a fluorescence microscope after DAPI (highlight, arrow). TUNEL-positive hepatocytes are shown (black arrow, 200×). Ultrastructural observations of swainsonine-treated cells visualized under a transmission electron microscope (black arrow, 11000×). (B) A scattergram of apoptotic hepatocytes analyzed using flow cytometry after annexin V and PI staining. (C) Induction of DNA fragmentation. The DNA fragmentation of broilers’ hepatocytes were measured via 2% agarose gel electrophoresis, followed by visualization of bands and photography. (D) AFB2 induced the collapse of ΔΨm. The cell suspension was filtered through 300-mesh nylon and then stained with JC-1, followed by FCM analysis. (E) The protein levels of PARP and caspase-3 examined by a Western blot analysis. The data are presented as the means ± SD of three independent experiments. *p < 0.05 and **p < 0.01 compared with the control group.
Figure 2
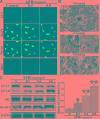
Figure 2. Effect of AFB2 on autophagy of hepatocytes in broilers
(A) Hepatocytes stained with MDC (bright color) and LC3 (green) antibody using a fluorescence microscope (200×), respectively. Nuclei were stained with DAPI (blue) (bar: 10 μm). (B) Morphological observation of autophagy in hepatocytes, showing the characteristic ultrastructural morphology of autophagy, such as autophagic vacuoles (black arrow, ×12000, in hepatocytes. (C) Representative blots showing the expression levels of LC3-I, LC3-II, p62, and Beclin-1 in hepatocytes. β-actin was used as an internal control. The bar graph shows the ratio of LC3-II/LC3-I. The data are presented as the means ± SD of three independent experiments. *p < 0.05 and **p < 0.01 compared with the control group.
Figure 3
Figure 3. AFB2-induced apoptosis of hepatocytes via activation of the mitochondria-dependent pathway
(A) DCFH-DA staining and the detection of intracellular ROS levels in hepatocytes of broilers given AFB2. (B) Intracellular ROS levels determined using H2DCFDA staining. The histogram of FCM showing the dose-dependent increase in the probe fluorescence intensity. (C–D) Detection of mRNA levels and protein levels of Bax and Bcl-2 following the extraction of total RNA and protein from hepatocytes via a quantitative real-time polymerase chain reaction (qRT-PCR) assay and Western blot analysis, respectively. (E) Results of the Western blot analyses of the proteins extracts from the mitochondrial and cytosolic fractions of hepatocytes used to measure the translocation of Bax and cytochrome c (cyt c). COX 4 and β-actin were used as internal controls for the mitochondrial and cytosolic fractions, respectively. (F) AFB2 induced the formation of apoptosomes. Protein extracts from hepatocytes were collected and the immunoprecipitation assays against Apaf-1 were performed to detecte the protein levels of full-length caspase-9 and cyt c via western blot aiming to indicate the formation of the apoptosome complex. All the data are presented with the means ± SD and mean values of three independent experiments. *p < 0.05, compared with the control group; **p < 0.01, compared with the control group.
Figure 4
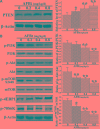
Figure 4. Effect of AFB2 on phosphoinositide 3-kinase/Akt/mammalian target of rapamycin (PI3K/Akt/mTOR)-mediated autophagy in hepatocytes
(A) Protein extracts from hepatocytes were collected, and the protein level of PTEN was analyzed via a Western blot. The bar graph shows the relative level of PTEN. (B) Representative blots showing the expression levels of p-PI3K, PI3K, p-Akt, Akt, p-mTOR S2448, and mTOR in hepatocytes of broilers administered AFB2. The bar graphs show the ratio of p-PI3K/PI3K, p-Akt/Akt, p-mTOR S2448/mTOR, p-4EBP1, and p-70S6K in the hepatocytes. All the data are presented with the means ± SD and mean values of three independent experiments. *p < 0.05, compared with the control group; **p < 0.01, compared with the control group.

References

    1. Cea J. Update on worldwide regulations for mycotoxins. The Mercosur harmonization of limits on mycotoxins with the international regulations. Innotec. 2011.
    1. Maurice O. Mycotoxins in Agriculture and Food Safety. Int J Food Sci Tech. 2000;35:354–355.
    1. Galvano F, Ritieni A, Piva G, Pietri A, Diaz DE. MYCOTOXINS IN THE HUMAN FOOD CHAIN. Mycotoxins Blue Book. 2005. pp. 187–224.
    1. Raisuddin S, Singh KP, Zaidi SI, Paul BN, Ray PK. Immunosuppressive effects of aflatoxin in growing rats. Mycopathologia. 1993;124:189–194. - PubMed
    1. Dugyala RR, Sharma RP. The effect of aflatoxin B1 on cytokine mRNA and corresponding protein levels in peritoneal macrophages and splenic lymphocytes. Int J Immunopharmaco. 1996;18:599–608. - PubMed