. 2016 Dec 20;7(51):85365-85380.
doi: 10.18632/oncotarget.13378.

TSC loss distorts DNA replication programme and sensitises cells to genotoxic stress

Affiliations

TSC loss distorts DNA replication programme and sensitises cells to genotoxic stress

Govind M Pai et al. Oncotarget. .

Abstract

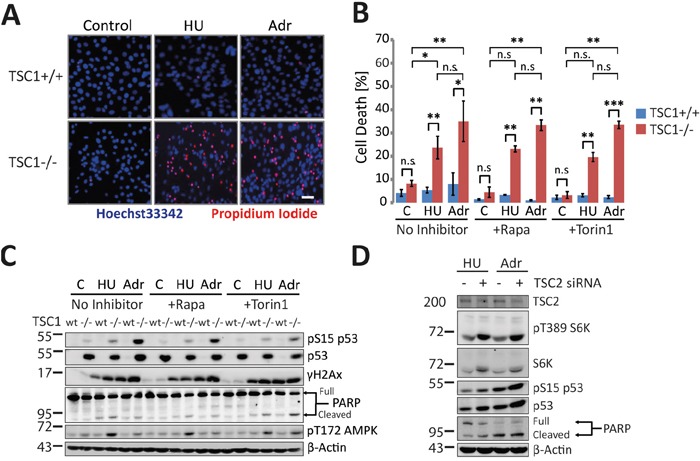
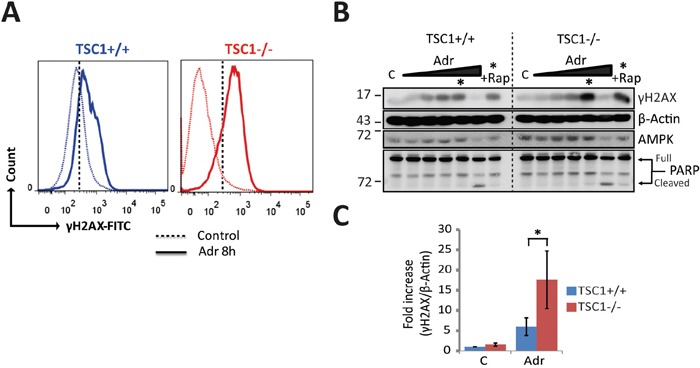
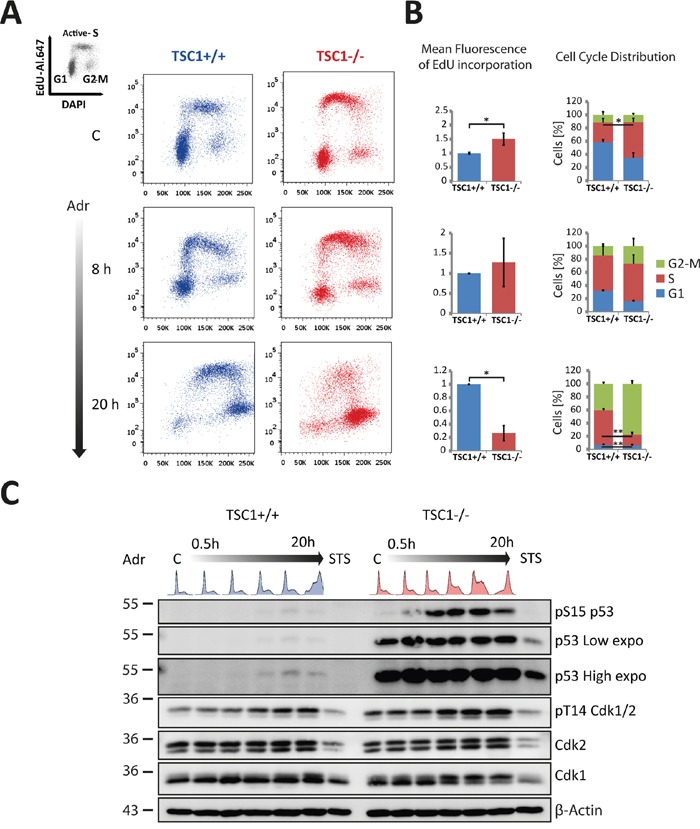
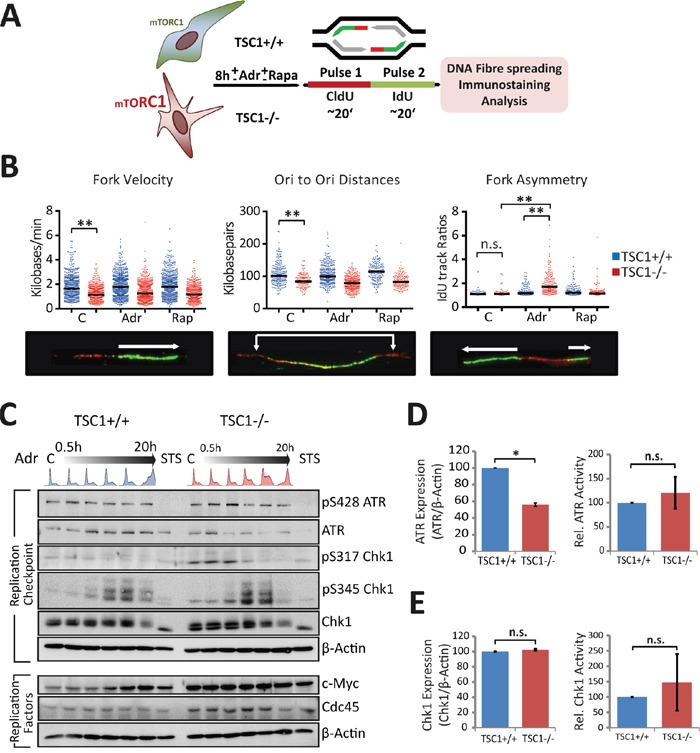
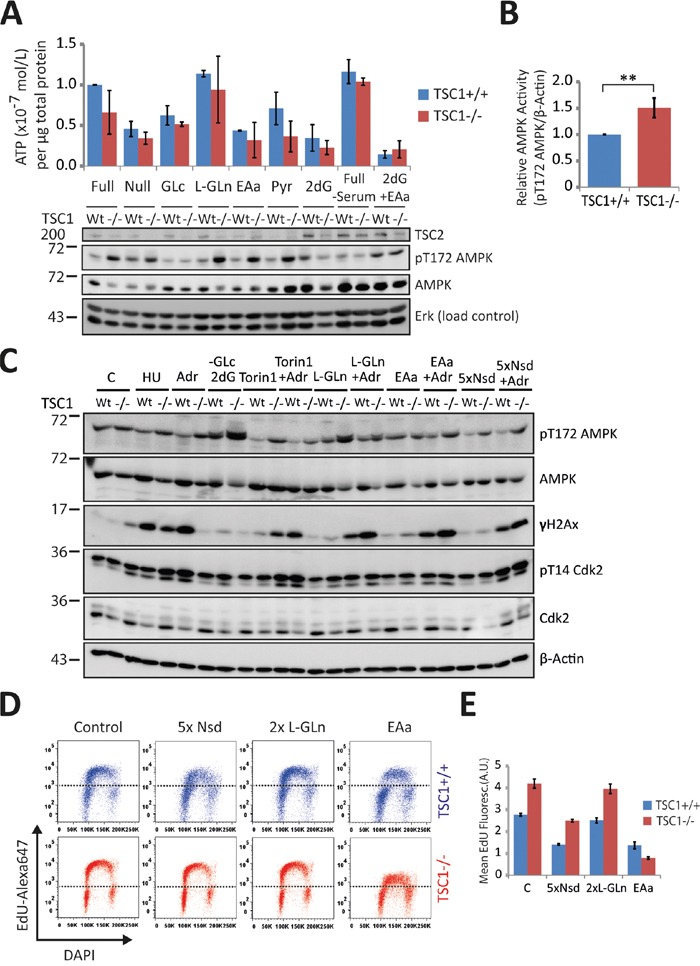
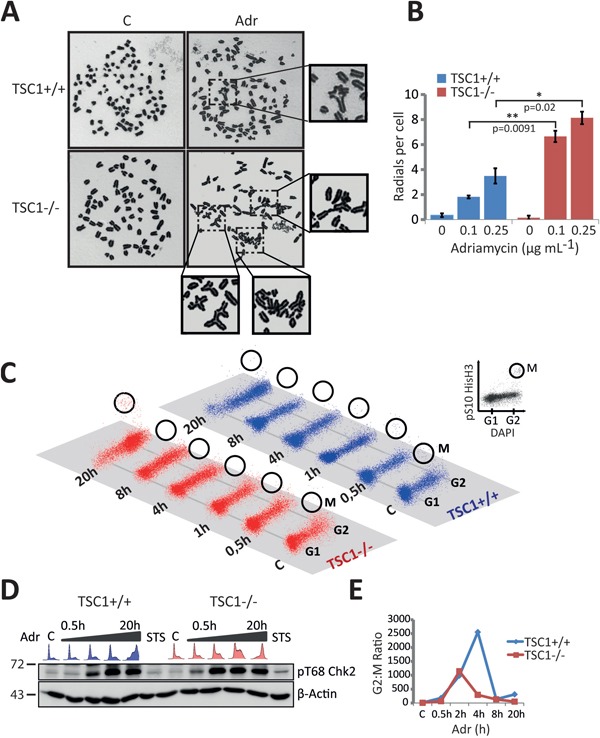
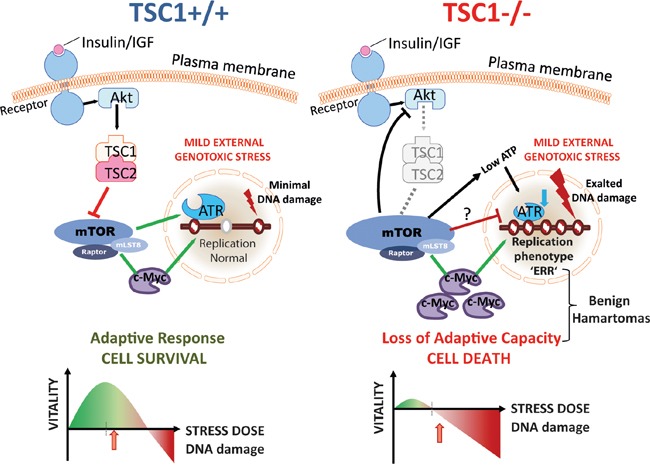
Tuberous Sclerosis (TSC) is characterized by exorbitant mTORC1 signalling and manifests as non-malignant, apoptosis-prone neoplasia. Previous reports have shown that TSC-/- cells are highly susceptible to mild, innocuous doses of genotoxic stress, which drive TSC-/- cells into apoptotic death. It has been argued that this hypersensitivity to stress derives from a metabolic/energetic shortfall in TSC-/- cells, but how metabolic dysregulation affects the DNA damage response and cell cycle alterations in TSC-/- cells exposed to genotoxic stress is not understood. We report here the occurrence of futile checkpoint responses and an unusual type of replicative stress (RS) in TSC1-/- fibroblasts exposed to low-dose genotoxins. This RS is characterized by elevated nucleotide incorporation rates despite only modest origin over-firing. Strikingly, an increased propensity for asymmetric fork progression and profuse chromosomal aberrations upon mild DNA damage confirmed that TSC loss indeed proved detrimental to stress adaptation. We conclude that low stress tolerance of TSC-/- cells manifests at the level of DNA replication control, imposing strong negative selection on genomic instability that could in turn detain TSC-mutant tumours benign.

Keywords: adaptive responses; genotoxic stress; mTORC1; replication stress; tuberous sclerosis.


Conflict of interest statement

CONFLICTS OF INTERESTS

All authors declare no competing financial interests or elsewise conflict of interests related to this work.

Figures

Figure 1
Figure 1. TSC1 loss predisposes cells to genotoxic stress-induced cell death
A. Fluorescent microscopy of TSC1+/+ and TSC1-/- MEFs untreated or treated with Hydroxyurea (HU, 2 mM) and Adriamycin (Adr, 0.5 μg/ml), respectively for 20 h. Hoechst33342 (membrane permeable, live-cell nuclear stain) and Propidium iodide (membrane impermeable dead cell stain) mark live and dead cells. Scale bar = 20 μm. See also Supplementary Figure S1. B. Propidium iodide exclusion flow cytometry for cell death estimation. TSC1+/+ and TSC1-/- MEFs untreated or treated with Hydroxyurea (HU, 2 mM) and Adriamycin (Adr, 0.5 μg/ml) respectively for 20h. Wherever indicated, mTORC1 Inhibitors Rapamycin (Rapa, 20 nM) or Torin1 (10 nM) were spiked 2h prior to genotoxic treatments. Data-set are a mean of duplicate samples from three independent experiments. Error bars represent standard deviation (SD) of the three repeats. One-way non-parametric ANOVA (for group comparisons) and the non-parametric Mann-Whitney U test (for pair-wise comparison) were used for statistical analysis. *P<0.05, **p<0.01, ***p<0.001, n.s.- not significant. Pair-wise significance is as indicated (TSC1+/+ vs TSC1-/-). See also Supplementary Figure S5. C. Representative western blot of WT and TSC1-/- MEFs treated as in (B). D. siRNA-mediated acute knockdown of TSC2 in wild type MEFs followed by genotoxic treatment and immunoblot detection of the indicated proteins.
Figure 2
Figure 2. TSC1-/- cells gather primary genetic insults under mild genotoxic stress
A. Representative histograms of Ser139-phosphorylated H2AX /DNA content (propidium iodide) flow cytometry for DNA damage estimation in TSC1+/+ and TSC1-/- MEFs, untreated or acutely treated with 0.5 μg/ml Adr for 8h. Dotted vertical line corresponds to the arbitrary gating threshold also used in Supplementary Figure S6 for illustrative reasons. Note that the data shown here and in Supplementary Figure S6 represent the same experiment. B. Dose-response western blot analysis for γH2AX as an indicator of DNA strand breaks of TSC1+/+ and TSC1-/- MEFs after Adr treatment for 20 h. Treatment range included 0.01, 0.05, 0.1, 0.5 and 10 μg/ml respectively. Asterisk denotes the 0.5 μg/ml Adr point, and +Rap indicates rapamycin co-treatment. Notice the clearly higher phosphorylation levels of H2AX indicating higher DNA damage accumulation. Weak protein signals at 10 μg/ml reflect poor protein recovery due to collossal cell loss, evident from cleaved PARP. C. Densitometry of γH2AX western blots from 3 independent experiments indicating higher phosphorylation levels in TSC1-/- MEFs after Adr treatment. Values are mean ± SD. Statistical significance was calculated using the non-parametric Mann-Whitney U test.
Figure 3
Figure 3. TSC1-/- MEFs feature altered cell cycle distribution, aberrant S-phase progression and G2-M accumulation under mild genotoxic stress
A. Representative EdU incorporation cell cycle profiles of TSC1+/+ and TSC1-/- MEFs untreated or Adr (0.5 μg/ml) treated for the indicated time-periods. The complete time series is shown in Supplementary Figure S7A. B. Quantification of mean EdU incorporation intensities (left) and mean cell cycle distribution (right) corresponding to A. Notice the recovery of the S-phase arc in the wt MEFs as opposed to the chaotic S-phase arc in TSC1-/- MEFs at 20 h accompanied by the massive G2-M arrest. Over 75 % of TSC1-/- pass through S-phase and accumulate in G2/M. Values are mean + SD. Statistical significance was calculated using two-tailed t-test. * p<0.05, ** p<0.01. A complete series of EdU incorporation profiles for all treatment times is presented in Supplementary Figure S7A. C. Western blot analysis of samples treated for up to 20 h with Adr (0.5 μg/ml). A long exposure of the p53 western is shown to illustrate that p53 does accumulate in wild-type MEF cells, too. Cell cycle patterns are highlighted on top of the lanes to assist interpretation of the blots. STS: Staurosporine (1 μM) serves as a positive control for apoptosis induction.
Figure 4
Figure 4. TSC loss perturbs S-phase progression
A. Schematic of the pulse labelling protocol for fibre assay. See experimental section for details. B. Panel shows fork velocity (kb/min), Ori-Ori distances (Kb), and fork asymmetry (IdU track ratios). Dots indicate individual measurements from 3 independent experiments. Statistical significance was calculated using one-way ANOVA (non-parametric Kruskal-Wallis test). *p<0.05, **p<0.01, ***p<0.001, n.s.- not significant. C. Western blot analysis of S-phase checkpoint response and replication proteins in TSC1+/+ and TSC1-/- MEFs treated with 0.5 μg/ml Adr over lengths of time up to 20 h. STS: Staurosporine. D, E. Densitometry for relative expression and activity levels of the replication checkpoint kinases ATR and Chk1 respectively, in untreated TSC1+/+ and TSC1-/- MEFs from six independent experiments. Data represent mean ± SD. Statistical significance was estimated using the non-parametric Mann-Whittney U –test. *p<0.05.
Figure 5
Figure 5. Energetic enrichment in TSC1-/- MEFs alleviates DNA damage accumulation
A. Above – Luminometric ATP measurements of TSC1+/+ and TSC1-/- MEFs under diverse growth conditions as indicated for 20 h. Below – Western analysis of duplicate samples. Note that AMPK activity, scored here as phosphorylation at Thr172, reflects the drop in ATP levels, and is consistently high in TSC1-/- MEFs. B. Densitometry of AMPK activity in untreated TSC1+/+ and TSC1-/- MEFs maintained in complete DMEM supplemented with 10 % serum. Notice the higher phosphoT172-AMPK levels (activity) due to the increased anabolic demand imposed by constitutive mTORC1 signalling in TSC1-/- MEFs. Bars are mean ± SD. Statistical significance was calculated using the non-parametric Mann Whitney U test. **p<0.01 C. Western blot of TSC1+/+ and TSC1-/- MEFs cultured for 8h in the presence of the indicated media/supplements. Note that energy deprivation alone does not manifest as spontaneous DNA damage in TSC1-/- MEFs. GLc: Glucose, 2dG: 2-deoxy-Glucose, L-Gln: L-Glutamine, EAa: Amino acids, Nsd – Nucleosides. D. Pulse EdU-incorporation cell cycle profiles of TSC1+/+ and TSC1-/- MEFs subjected to nucleoside supplementation (5xNsd), high-energy substrate-feeding (2xL-Gln) or amino acid feeding (EAa). Dotted black line is arbitrarily placed to aid visualisation of the changes in EdU-incorporation arc heights E. Mean fluorescence of EdU incorporation. Data represent duplicate measurements from one experiment.
Figure 6
Figure 6. Leaky G2-M checkpoint and catastrophic cell death in TSC1-/- MEFs
A-B. Representative metaphase chromosome spreads and quantification indicating frequency of aberrations following low-dose Adriamycin treatment per 100 spreads from two independent experiments. C. Mitotic entry monitored at various time-points after 0.5 μg/ml Adriamycin treatment in TSC1+/+ and TSC1-/- MEFs, by DAPI/pSer10–HisH3 flow cytometry to distinguish between G2 and M phase cells. D. Western blot showing Chk2 activation, indicating a proficient ATM-Chk2-mediated G2-M checkpoint after Adriamycin damage. E. Percentage ratios of G2 to M phase cells as a measure of the fidelity of G2/M checkpoint, plotted as the geometric mean of 2 experiments; the lower ratios in TSC1-/- MEFs suggest a checkpoint maintenance defect, eventually permitting damage-prone mitotic entry. Representative flow cytometry gating strategy is presented in Supplementary Figure S8. Raw data are provided in Supplementary Table S1.
Figure 7
Figure 7. mTORC1, genotoxic stress response and tuberous sclerosis
Model summarising various factors converging in the loss of mild stress adaptation in TSC1-/- cells. A constitutively anabolic state with increased energy expenditure, perturbed cell cycle progression including S-phase checkpoint kinase–ATR downregulation, a restrained replication phenotype with modest origin over-use and declined fork progression rates, high p53 levels, altogether set stage for a failure of adaptation of TSC1-/- cells to mild external stress doses, given the inherent stress milieu (also see Supplementary Table S2).

Similar articles

Cited by

References

    1. Hanahan D, Weinberg RA. The Hallmarks of Cancer. Cell. 2000;100:57–70. - PubMed
    1. Hanahan D, Weinberg RA. Hallmarks of cancer: the next generation. Cell. 2011;144:646–674. - PubMed
    1. Shaw RJ, Cantley LC. Ras, PI(3)K and mTOR signalling controls tumour cell growth. Nature. 2006;441:424–430. - PubMed
    1. Laplante M, Sabatini DM. mTOR signaling in growth control and disease. Cell. 2012;149:274–293. - PMC - PubMed
    1. Hengstschläger M, Rodman DM, Miloloza A, Hengstschläger-Ottnad E, Rosner M, Kubista M. Tuberous sclerosis gene products in proliferation control. Mutation research. 2001;488:233–239. - PubMed

MeSH terms

LinkOut - more resources