. 2017 Jan 3;8(1):900-914.
doi: 10.18632/oncotarget.13400.

Epigenetically upregulated WIPF1 plays a major role in BRAF V600E-promoted papillary thyroid cancer aggressiveness

Affiliations

Epigenetically upregulated WIPF1 plays a major role in BRAF V600E-promoted papillary thyroid cancer aggressiveness

Tao Zhang et al. Oncotarget. .

Abstract

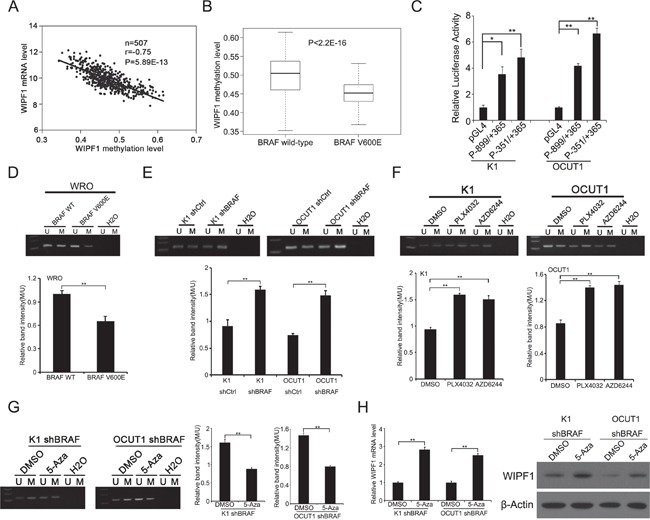
How the BRAF V600E mutation promotes the pathogenesis and aggressiveness of papillary thyroid cancer (PTC) is not completely understood. Here we explored a novel mechanism involving WASP interacting protein family member 1 (WIPF1). In PTC tumors, compared with the wild-type BRAF, BRAF V600E was associated with over-expression and hypomethylation of the WIPF1 gene. In thyroid cancer cell lines with wild-type BRAF, WIPF1 expression was robustly upregulated upon introduced expression of BRAF V600E (P=0.03) whereas the opposite was seen upon BRAF knockdown or treatment with BRAF V600E or MEK inhibitors in cells harboring BRAF V600E. Methylation of a functionally critical region of the WIPF1 promoter was decreased by expressing BRAF V600E in cells harboring the wild-type BRAF and increased by BRAF knockdown or treatment with BRAF V600E or MEK inhibitors in cells harboring BRAF V600E mutation. Under-expression and hypermethylation of WIPF1 induced by stable BRAF knockdown was reversed by DNA demethylating agent 5'-azadeoxycytidine. Knockdown of WIPF1 robustly inhibited anchorage-independent colony formation, migration, and invasion of thyroid cancer cells and suppressed xenograft thyroid cancer tumor growth and vascular invasion, mimicking the effects of BRAF knockdown. In human PTC tumors, WIPF1 expression was associated with extrathyroidal invasion (P=0.01) and lymph node metastasis (P=2.64E-05). In summary, BRAF V600E-activated MAP kinase pathway causes hypomethylation and overexpression of WIPF1; WIPF1 then functions like an oncoprotein to robustly promote aggressive cellular and tumor behaviors of PTC. This represents a novel mechanism in BRAF V600E-promoted PTC aggressiveness and identifies WIPF1 as a novel therapeutic target for thyroid cancer.

Keywords: BRAF V600E; WIPF1; oncogenesis; thyroid cancer; tumor aggressiveness.


Conflict of interest statement

CONFLICTS OF INTEREST

M.X. received royalty payments as co-holder of a licensed USA patent related to BRAF V600E mutation in thyroid cancer. No potential conflicts of interest were disclosed by other authors.

Figures

Figure 1
Figure 1. BRAF V600E upregulates WIPF1 expression in thyroid cancer tumor and thyroid cancer cells
A. mRNA expression levels of WIPF1 were analyzed, RSEM-normalized and log2(n+1) transformed in 203 PTC patients without BRAF V600E mutation and 287 PTC patients with BRAF V600E mutation from the TCGA database (P=2.83E-12). B. Left panel: Relative mRNA levels of WIPF1 were detected by qRT-PCR in WRO cells stably transfected with BRAF wild-type (WT) or BRAF V600E. Right panel: WIPF1 protein, phosphorylated ERK (p-ERK) and total ERK (t-ERK) were detected by Western blotting in WRO cells stably transfected with BRAF WT or BRAF V600E. C. Left panel: Relative mRNA levels of WIPF1 were detected by qRT-PCR in K1 and OCUT1 cells stably transfected with control shRNA (shCtrl) or BRAF shRNA (shBRAF). Right panel: Proteins of WIPF1, BRAF, p-ERK and t-ERK were detected by Western blotting in K1 and OCUT1 cells stably transfected with shCtrl or shBRAF. D. Left panel: Relative mRNA levels of WIPF1 were detected by qRT-PCR in K1 and OCUT1 cells treated with the BRAF V600E inhibitor PLX4032 (PLX) at 0.5 μM or the MEK1/2 inhibitor AZD6244 (AZD) at 0.2 μM or DMSO (Ctrl). Right panel: Proteins of WIPF1, p-ERK and t-ERK were detected by Western blotting in K1 and OCUT1 cells treated with 0.5 μM PLX4032 (PLX) or 0.2 μM AZD6244 (AZD) or DMSO (Ctrl). Beta Actin (β-Actin) was used as a loading control in Western blotting analysis. Data were shown as mean±SD of three independent experiments. Statistically significant differences were indicated as *P<0.05; **P<0.01 per two-tailed Student's t test.
Figure 2
Figure 2. BRAF V600E downregulates methylation of the WIPF1 promoter
A. The relationship between WIPF1 mRNA levels and its methylation levels was analyzed in 507 PTC patients from the TCGA database. B. The promoter methylation levels of WIPF1 were examined in 205 PTC patients with BRAF wild-type and 287 PTC patients with BRAF V600E mutation from the TCGA database (P<2.2E-16). C. The WIPF1 promoter activities (P-899/+365 and P-351/+365) were detected in K1 and OCUT1 cells. D. The methylation levels of WIPF1 promoter were examined by methylation-specific PCR (MSP) analysis in WRO cells transfected with BRAF wild-type (WT) or BRAF V600E. U represented the unmethylated and M represented the methylated DNA. H2O was used as the negative control for the PCR reaction. The bar graph showed the relative band intensity of the methylation/unmethylation ratio using the Image J software. E and F. WIPF1 methylation was examined by MSP in K1 and OCUT1 cells after stable knockdown of BRAF or treatment with the BRAF V600E inhibitor PLX4032 at 0.5 μM or the MEK1/2 inhibitor AZD6244 at 0.2 μM for 72 h. U represented unmethylated and M represented methylated DNA. H2O was used as a negative control for the PCR reaction. The bar graph showed the relative band intensity of the methylation/unmethylation ratio using the Image J software. G and H. WIPF1 methylation, relative mRNA levels of WIPF1, and protein levels of WIPF1 were examined by MSP, qRT-PCR, and Western blotting, respectively, in K1 and OCUT1 cells with stable BRAF knockdown and with further treatment with control vehicle (DMSO) or 5 μM demethylating agent 5-Aza-2′-deoxycytidine (5-Aza) for 72h. The bar graph in Figure 2G showed the relative band intensity of the methylation/unmethylation ratio using the Image J software. β-Actin was used as a loading control in Western blotting analysis. Data represented mean±SD of three independent experiments. Statistically significant differences were indicated as*P<0.05; **P<0.01 per Student's t test.
Figure 3
Figure 3. Knockdown of WIPF1 inhibits thyroid cancer cell migration
A. The protein expression of WIPF1 was examined by Western Blotting in K1, OCUT1 and FTC133 cells after stable transfection with WIPF1 shRNA (shWIPF1) or scrambled control shRNA (shCtrl). B-D. Left panel: Stable knockdown of WIPF1 decreased cell motility in K1, OCUT1 and FTC133 cells by wound-healing assay. Wound width was analyzed at 0 h, 24 h and 48 h after wounding. Right panel: The results were presented as the percentage of wound closure as follows: (cell migration distance at the time of measurement/initial wound width) × 100 corresponding to (B-D). The results of each column represented mean±SD of wound closure from three independent experiments. Statistically significant differences were indicated as *P<0.05; **P<0.01 per Student's t test.
Figure 4
Figure 4. Knockdown of WIPF1 inhibits thyroid cancer cell invasion
A. K1, OCUT1 and FTC133 cells were stably silenced with WIPF1 shRNA (shWIPF1) followed by the cell invasion assay. Shown were the cells that invaded on the Matrigel matrix-coated polyethylene terephthalate membrane after removal of the non-invasive cells. B-D. Relative mRNA levels of MMP9, MMP7 and E-cadherin were determined by qRT-PCR in K1, OCUT1 and FTC133 cells with knockdown of WIPF1 (shWIPF1), respectively. Data were presented as mean ±SD of three independent experiments. Statistically significant differences were indicated as NS, non-significant; *P<0.05; and **P<0.01 per Student's t test.
Figure 5
Figure 5. Knockdown of WIPF1 suppresses anchorage-independent cell growth in vitro and tumor growth in vivo
A. Representative results of colony formation in K1, OCUT1 and FTC cells after stable knockdown of WIPF1. B. Time course of xenograft tumor growth that developed in mice after subcutaneous inoculation with K1 cells transfected with control shRNA (shControl) or BRAF shRNA (shRBAF) (P=0.004) or WIPF1 shRNA (shWIPF1) (P=0.023). Each time point represented mean±SD of the values obtained from five mice in each group. C. Photographs of surgically removed tumors from nude mice at 27 days from the cell inoculation. D. Bar graph of average weight of tumors corresponding to (C). E. The expression of BRAF and WIPF1 protein was examined by Western blotting in tumor tissues from mice. Different groups of proteins were run on different gels using the same electrophoresis conditions, but their films were exposed and developed together for the same length of time for all the panels shown. F. Bar graph presentation of BRAF and WIPF1 protein levels relative to the β-actin levels by calculating the ratios of band intensities of BRAF/β-Actin and WIPF1/β-Actin corresponding to (E). Data were presented as mean ±SD of three independent experiments. Statistically significant differences were indicated: NS, non-significant; *P<0.05; and **P<0.01 per Student's t test.
Figure 6
Figure 6. Tumor vascular invasion is suppressed by knockdown of WIPF1 or BRAF in BRAF V600E-bearing thyroid cancer cell-derived tumors
Xenograft tumors derived from BRAF V600E-positive K1 cells in nude mice were sectioned for histological H & E staining to examine intravascular invasion. A. Vascular invasion of the tumor was seen in the control tumors with intact WIPF1 and BRAF (arrow-pointed). B and C. No vascular invasion was seen in the tumors with knockdown of WIPF1 (Panel B) or knockdown of BRAF (Panel C). Blood vessels containing blood and fibrin but no tumor cells were seen in the tumors in Panel B (arrow pointed) and small blood vessels containing no tumor cells were seen in the tumors in Panel C (arrow pointed). In each panel, the left portion represented a view at 20X magnification and the right portion represented a view at 200 X magnification of the tumor tissue slide. The figures were representatives of histological staining of the tumors corresponding to Figure 5C.
Figure 7
Figure 7. Overexpression of WIPF1 is associated with poor clinicopathological outcomes of PTC in TCGA database
A. The relationship between WIPF1 mRNA levels and three major subtype of PTC (CPTC, FVPTC and TCPTC) was analyzed from TCGA database. B and C. The relationship between WIPF1 mRNA levels and extrathyroid invasion or lymph node metastasis was analyzed from TCGA database, respectively. N0: there was no lymph node metastasis. N1: positive for lymph node metastasis.
Figure 8
Figure 8. Schematic diagram illustrating the role of WIPF1 in BRAF W600E/MAP kinase pathway-promoted tumorigenesis and aggressiveness of thyroid cancer
The BRAF V600E/MAP kinase pathway signaling causes hypomethylation of the WIPF1 promoter, resulting in over-expression of WIPF1, which in turn promoted thyroid cancer cell migration and invasion and tumor growth, leading to the development of aggressive thyroid cancer. Upregulation of the tumor-promoting molecule MMP9 and down-regulation of tumor suppressor molecule E-cadherin by WIPF1 are involved in this process. This represented a novel mechanism in the widely known BRAF V600E-associagted aggressiveness of thyroid cancer.

Similar articles

Cited by

References

    1. Howlader N, Noone AM, Krapcho M, Miller D, Bishop K, Altekruse SF, Kosary CL, Yu M, Ruhl J, Tatalovich Z, Mariotto A, Lewis DR, Chen HS, et al. SEER Cancer Statistics Review, 1975-2013. National Cancer Institute; Bethesda, MD: Apr, 2016. http://seercancergov/csr/1975_2013/ based on November 2015 SEER data submission, posted to the SEER web site. Accessed on July 5, 2016.
    1. Xing M. Molecular pathogenesis and mechanisms of thyroid cancer. Nat Rev Cancer. 2013;13:184–99. - PMC - PubMed
    1. Tuttle RM, Ball DW, Byrd D, Dilawari RA, Doherty GM, Duh QY, Ehya H, Farrar WB, Haddad RI, Kandeel F, Kloos RT, Kopp P, Lamonica DM, et al. Thyroid carcinoma. J Natl Compr Canc Netw. 2010;8:1228–74. - PubMed
    1. Mao Y, Xing M. Recent incidences and differential trends of thyroid cancer in the United States. Endocr Relat Cancer. 2016;23:313–22. - PMC - PubMed
    1. Lam AK, Lo CY, Lam KS. Papillary carcinoma of thyroid: A 30-yr clinicopathological review of the histological variants. Endocr Pathol. 2005;16:323–30. - PubMed

MeSH terms

Substances